Lnd: Question: expected resource usage for lnd
I've noticed the resource usage (CPU and mem) seem rather high for lnd. Far higher than bitcoind or parity, for example. Given that the number of transactions passing through my lnd node is ~0 on average, this doesn't make much sense to me. I'd be worried about the scalability implications if this is how much compute is required for an idle node.
Is this expected? Have I encountered a bug?
brenden@instance-5:~$ sudo docker exec -it lnd /bin/bash
root@instance-5:/lnd# lncli getinfo
{
    "identity_pubkey": "0327049d8d63f0c40193cdf3afc61817c8647808a4e482de0716fcef74e6d92ebf",
    "alias": "FederalReserve",
    "num_pending_channels": 0,
    "num_active_channels": 6,
    "num_peers": 14,
    "block_height": 514535,
    "block_hash": "0000000000000000000d5c6d4c9561d8a58c4052a58b9ea36400323ae5db6f55",
    "synced_to_chain": true,
    "testnet": false,
    "chains": [
        "bitcoin"
    ],
    "uris": [
        "0327049d8d63f0c40193cdf3afc61817c8647808a4e482de0716fcef74e6d92ebf@35.184.46.254:9735"
    ],
    "best_header_timestamp": "1521640825"
}
root@instance-5:/lnd#
Here's a portion of my lnd log: https://gist.github.com/brndnmtthws/303b320e0ea98578f3af5a89d5b6df61
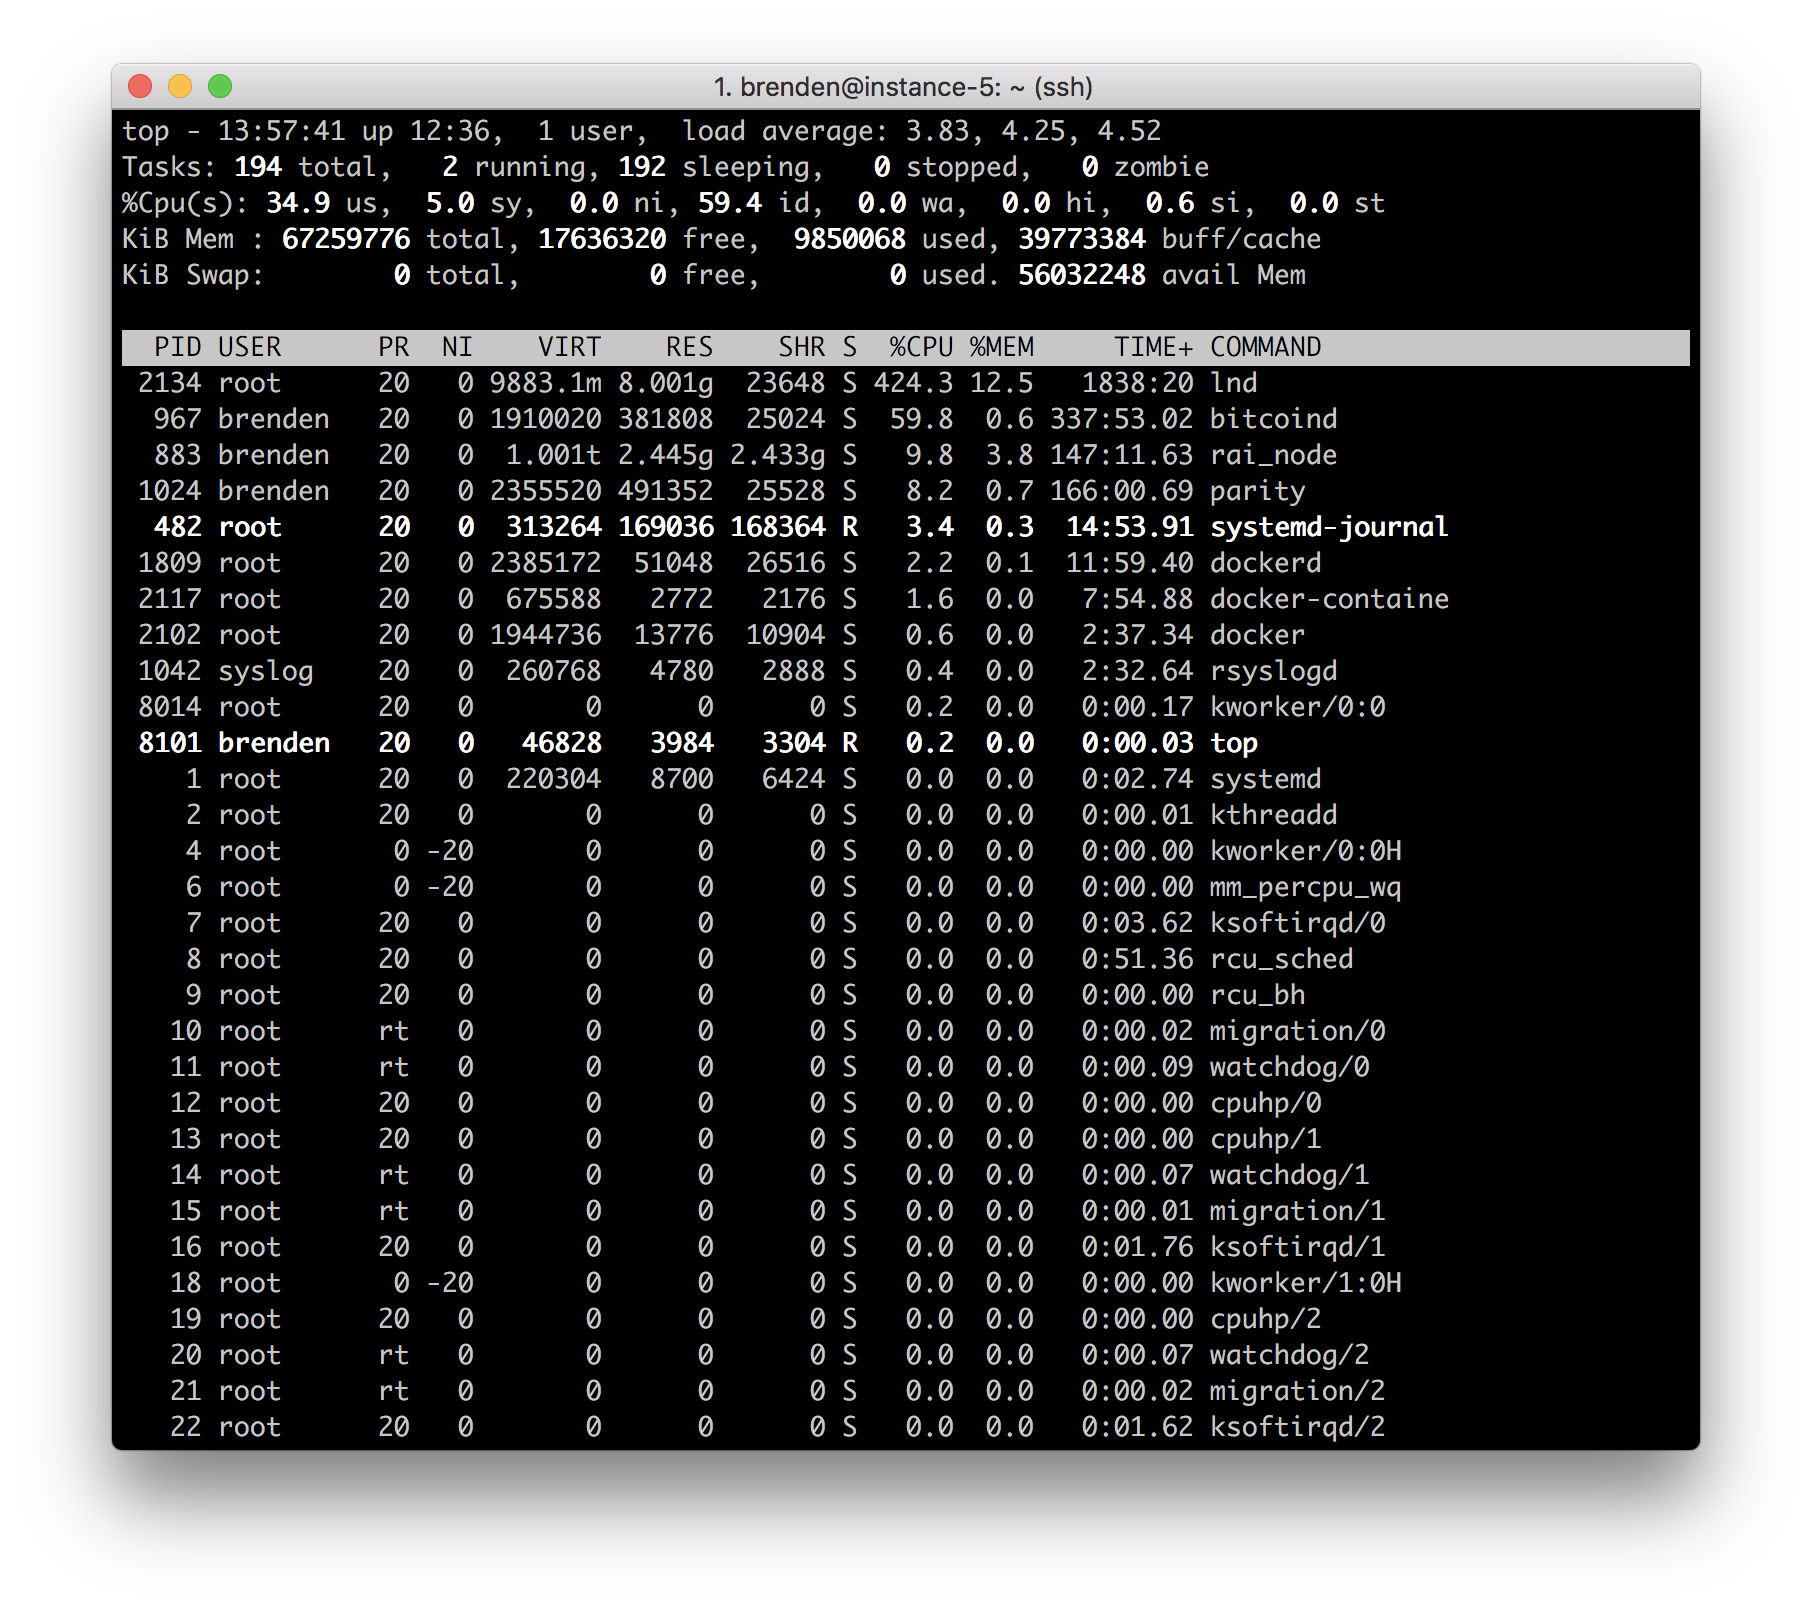
The sample period for the screenshot above is 5s.
 brndnmtthws
All 20 comments
Cpu usage depends on how much information you node broadcast and recives. From what i understand each network change is broadacasted. So if anyone does a transaction, that changes a channel state and it is brodcasted, same if any nodes comes off or online and so on. Cpu usage is high when you just started lnd, later is should be way lower.
Each time i have to restart my pi my lnd takes up to 350% of cpu. But after it catches up it stays around 3-5% till a lot of network traffic comes in, then it jumps to like 150%.
 halfik
on 21 Mar 2018
halfik
on 21 Mar 2018
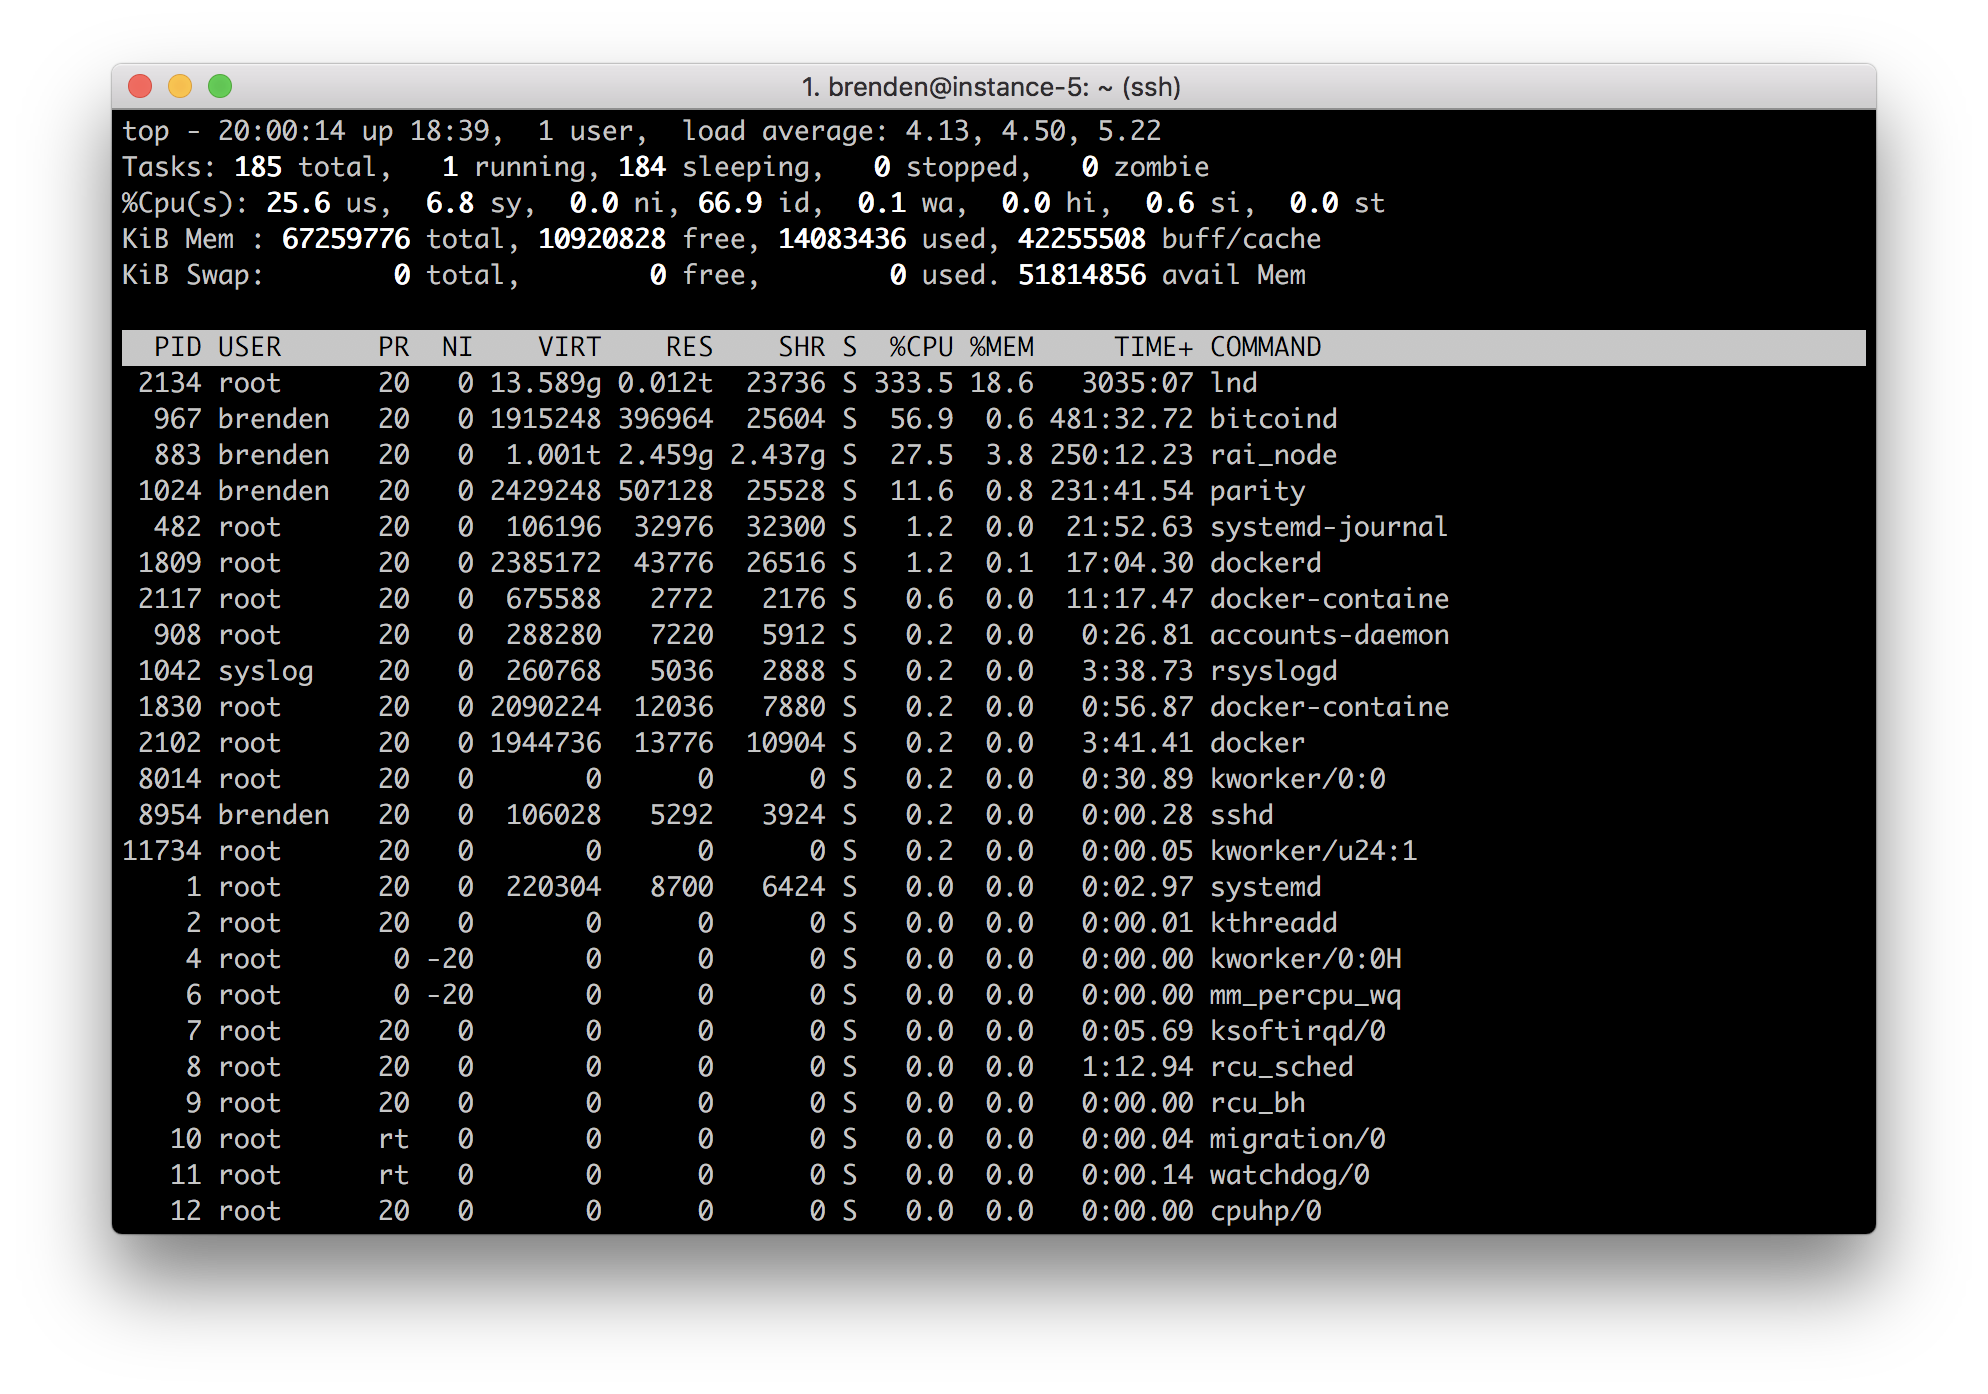
The CPU usage stays above 200% on average even after a few days of running. The memory usage seems to grow without limit (it got as high as 20G before I restarted it yesterday).
brndnmtthws
on 21 Mar 2018
Hello,
The same thing happens to me with a raspberry, the consumption of resources is too high. Until yesterday I worked well, but since yesterday the consumption of CPU does not go down. Can it be caused by the ddos attack?
 johnny-cash
on 21 Mar 2018
johnny-cash
on 21 Mar 2018
Hmm im using cache clear script. I had problems with cpu usage when bitcoind was syncing. Can you guys check if it helps: https://github.com/lizquilty/scripts/blob/master/cacheclear.sh
halfik
on 21 Mar 2018
Hmm im using cache clear script. I had problems with cpu usage when bitcoind was syncing. Can you guys check if it helps: https://github.com/lizquilty/scripts/blob/master/cacheclear.sh
What's the point of dropping the disk caches?
brndnmtthws
on 21 Mar 2018
The problem has nothing to do with the disk cache. Bitcoind works correctly, the problem is from the lnd server.
johnny-cash
on 21 Mar 2018
@halfik's description is false.
@brndnmtthws looking at your logs it appears that this IP 91.234.48.232 is repeatedly connecting, then disconnecting again. With the way the initial handshake works atm, there's a burst of activity post peer connection. With a new extension to the protocol that will be phased in by feature bits (which we'll make mandatory), this burst will go away.
Looking at the logs again, we see this:
Mar 21 14:01:29 instance-5 docker[2102]: 2018-03-21 14:01:29.986 [ERR] HSWC: ChannelPoint(cfb20ad3e33e6649ddc7a3e0079b13a4001954c30a111b68ff119f8c97db41fa:0): unable to accept new commitment: commitment transaction dips peer below chan reserve
The peer you're connected to may be an older peer, and doesn't actually adhere to the constraints w.r.t channel reserve. If you force close that channel (and maybe also use iptables to ban that peer) things should return to normal. We're working on a patchset to automatically force close channels from faulty nodes like these. It requires a bit of reworking in the contractcourt to only dispatch notifications on block confirmations, while ceasing to use a channel once broadcast.
Here's my node on mainnet for example:
14036 kek 20 0 710340 154184 13384 S 3.0 1.9 131:39.60 lnd_linux
As you can see it's hovering around 1.9% CPU, but once we apply this new protocol enchantment, it should go down even further unless were doing high-throughput payment forwarding.
 Roasbeef
on 21 Mar 2018
Roasbeef
on 21 Mar 2018
@Roasbeef good to know. Other people might bump into this problem too, so it might be good to have some kind of workaround. It also sounds like it could be used as a DoS attack vector (starve a node of its resources by firing up a bunch of nodes and reconnecting over and over).
Aside from blocking that IP with iptables, any suggestions on how to mitigate this sort of problem? Any plan to implement a banlist of bad nodes like bitcoind et al?
brndnmtthws
on 21 Mar 2018
Yep, we have plans to implement a banlist, the scaffolding is already there, so what's left is: figuring out what actions constitute an increase in ban score, banning, and also writing the banlist persistently to disk.
We're also working on a workaround, but to do it properly requires a bit of additional testing and a change in the way we handle spend notifications in the contractcourt.
If it's OK with you @brndnmtthws, I'll close this issue, then create another issue that outlines our plan for DoS mitigation, and also persistent peer banning.
Roasbeef
on 21 Mar 2018
I blocked the IP mentioned above, but the CPU usage for lnd hasn't leveled off after 5 minutes or so:
The log is filled with errors that look like this: https://gist.github.com/brndnmtthws/30ba00e1a43d8f05882760ee9a06e728
If you look through the log, you'll see the same channel point (ex. 6860485751e2dd6d98b55b7f7a908d91d1502d0d287fc7ddfe5fb9f668936c28) is repeated over and over.
I'm not sure what this means, but it smells like a problem to me.
brndnmtthws
on 21 Mar 2018
You'll need to close out that channel (with a force close) since it has desyn'd. That was just an IP that I spotted in the logs, it might have been a different node.
Roasbeef
on 21 Mar 2018
You'll get those log errors if you're connected to an old clightning implementation, as they seem to do sending out invalid channel announcements. From speaking with the devs, this is fixed in newer versions of the implementation. You may also want to ban/disconnect the node sending those announcements. Worth mentioning again, that once the new protocol features are finished, there will no longer be this initial burst on reconnect.
Roasbeef
on 21 Mar 2018
Got it. Thanks for the info. I'll keep an eye on it as things progress.
brndnmtthws
on 21 Mar 2018
Not sure of the quality of this article, but it popped up in my Twitter feed and thought it might be relevant: https://www.trustnodes.com/2018/03/21/lightning-network-ddos-sends-20-nodes
brndnmtthws
on 22 Mar 2018
That article is mostly garbage; the author is uninformed. The attacks it details have _kernel_ level defenses and are unrelated to implementations. That "attack" can be launched on any public facing misconfigured Internet service.
20% of nodes didn't go down. This is an issue with the way explorers are interpreted by users today. We'll only accept advertisements from nodes that actually have channels. However, if a node closes out all its channels, we don't yet remove them from our network view. This is why you at times see unconnected nodes on these explorers. When users updated to the new version of lnd, they didn't accept the announcements from nodes that no longer had channels open. To the uninformed this looks like many nodes "went down".
Roasbeef
on 22 Mar 2018
I noticed quite high memory consumption too (almost 2GB), is this normal or a memory leak?
 Kixunil
on 29 Mar 2018
Kixunil
on 29 Mar 2018
Recently the memory use grew beyond 65GB and was OOM killed by the OS (after running for about a week):
[692522.295214] lnd invoked oom-killer: gfp_mask=0x14280ca(GFP_HIGHUSER_MOVABLE|__GFP_ZERO), nodemask=(null),  order=0, oom_score_adj=0
[692522.295218] lnd cpuset=4e089be143a56b32069053c7d7f4e75453dfe74a316d9b60ecdcf0c05d58f20f mems_allowed=0
[692522.295225] CPU: 2 PID: 20133 Comm: lnd Not tainted 4.13.0-37-generic #42-Ubuntu
[692522.295226] Hardware name: Google Google Compute Engine/Google Compute Engine, BIOS Google 01/01/2011
[692522.295227] Call Trace:
[692522.295234]  dump_stack+0x63/0x8b
[692522.295239]  dump_header+0x97/0x225
[692522.295245]  ? security_capable_noaudit+0x4b/0x70
[692522.295247]  oom_kill_process+0x20b/0x410
[692522.295250]  out_of_memory+0x2b6/0x4d0
[692522.295252]  __alloc_pages_slowpath+0xa35/0xe00
[692522.295254]  ? get_page_from_freelist+0x37a/0xb20
[692522.295257]  __alloc_pages_nodemask+0x260/0x280
[692522.295262]  alloc_pages_vma+0x88/0x1f0
[692522.295266]  __handle_mm_fault+0x802/0x1030
[692522.295268]  handle_mm_fault+0xb1/0x200
[692522.295271]  __do_page_fault+0x24d/0x4d0
[692522.295273]  do_page_fault+0x22/0x30
[692522.295276]  ? page_fault+0x36/0x60
[692522.295278]  page_fault+0x4c/0x60
[692522.295280] RIP: 0033:0x45c853
[692522.295281] RSP: 002b:00007f5f30ff9da0 EFLAGS: 00010287
[692522.295283] RAX: 0000000000000000 RBX: 0000000000004000 RCX: 0000000000004000
[692522.295284] RDX: 00000001258b66cb RSI: 0000000000000031 RDI: 000000d2eb5a2000
[692522.295285] RBP: 00007f5f30ff9de8 R08: 000000c000000000 R09: 0000000000765ad2
[692522.295286] R10: 00007f5ecb6b57c8 R11: 1fffffffffffffff R12: 0000000000000000
[692522.295287] R13: 0000000000000003 R14: 0000000000000003 R15: 0000000000000003
[692522.295288] Mem-Info:
[692522.295294] active_anon:16498969 inactive_anon:342 isolated_anon:0
                 active_file:1035 inactive_file:1204 isolated_file:0
                 unevictable:3205 dirty:1 writeback:0 unstable:0
                 slab_reclaimable:20097 slab_unreclaimable:36391
                 mapped:3146 shmem:961 pagetables:36802 bounce:0
                 free:83475 free_pcp:147 free_cma:0
[692522.295297] Node 0 active_anon:65995876kB inactive_anon:1368kB active_file:4140kB inactive_file:4816kB unevictable:12820kB isolated(anon):0kB isolated(file):0kB mapped:12584kB dirty:4kB writeback:0kB shmem:3844kB shmem_thp: 0kB shmem_pmdmapped: 0kB anon_thp: 11427840kB writeback_tmp:0kB unstable:0kB all_unreclaimable? no
[692522.295298] Node 0 DMA free:15908kB min:12kB low:24kB high:36kB active_anon:0kB inactive_anon:0kB active_file:0kB inactive_file:0kB unevictable:0kB writepending:0kB present:15992kB managed:15908kB mlocked:0kB kernel_stack:0kB pagetables:0kB bounce:0kB free_pcp:0kB local_pcp:0kB free_cma:0kB
[692522.295302] lowmem_reserve[]: 0 2979 65651 65651 65651
[692522.295305] Node 0 DMA32 free:253664kB min:3064kB low:6112kB high:9160kB active_anon:2796600kB inactive_anon:0kB active_file:760kB inactive_file:1176kB unevictable:0kB writepending:0kB present:3129292kB managed:3063724kB mlocked:0kB kernel_stack:0kB pagetables:1176kB bounce:0kB free_pcp:132kB local_pcp:120kB free_cma:0kB
[692522.295309] lowmem_reserve[]: 0 0 62671 62671 62671
[692522.295311] Node 0 Normal free:64328kB min:64500kB low:128672kB high:192844kB active_anon:63198952kB inactive_anon:1368kB active_file:3164kB inactive_file:4072kB unevictable:12820kB writepending:4kB present:65273856kB managed:64180140kB mlocked:12820kB kernel_stack:7968kB pagetables:146032kB bounce:0kB free_pcp:456kB local_pcp:240kB free_cma:0kB
[692522.295315] lowmem_reserve[]: 0 0 0 0 0
[692522.295318] Node 0 DMA: 1*4kB (U) 0*8kB 0*16kB 1*32kB (U) 2*64kB (U) 1*128kB (U) 1*256kB (U) 0*512kB 1*1024kB (U) 1*2048kB (M) 3*4096kB (M) = 15908kB
[692522.295328] Node 0 DMA32: 1772*4kB (UME) 4161*8kB (UMEH) 1681*16kB (UMEH) 727*32kB (UMEH) 312*64kB (UMEH) 157*128kB (UMEH) 104*256kB (UME) 61*512kB (UME) 44*1024kB (UMEH) 4*2048kB (E) 3*4096kB (E) = 253992kB
[692522.295340] Node 0 Normal: 93*4kB (UMEH) 197*8kB (UMEH) 2638*16kB (UMEH) 695*32kB (UMEH) 0*64kB 0*128kB 0*256kB 0*512kB 0*1024kB 0*2048kB 0*4096kB = 66396kB
[692522.295350] Node 0 hugepages_total=0 hugepages_free=0 hugepages_surp=0 hugepages_size=1048576kB
[692522.295352] Node 0 hugepages_total=0 hugepages_free=0 hugepages_surp=0 hugepages_size=2048kB
[692522.295353] 4739 total pagecache pages
[692522.295353] 0 pages in swap cache
[692522.295355] Swap cache stats: add 0, delete 0, find 0/0
[692522.295355] Free swap  = 0kB
[692522.295356] Total swap = 0kB
[692522.295357] 17104785 pages RAM
[692522.295357] 0 pages HighMem/MovableOnly
[692522.295358] 289842 pages reserved
[692522.295358] 0 pages cma reserved
[692522.295359] 0 pages hwpoisoned
[692522.295359] [ pid ]   uid  tgid total_vm      rss nr_ptes nr_pmds swapents oom_score_adj name
[692522.295371] [  499]     0   499    26356      322      20       3        0             0 lvmetad
[692522.295373] [  858]     0   858     7918      526      21       3        0             0 cron
[692522.295375] [  870]   105   870    11957      425      26       3        0          -900 dbus-daemon
[692522.295377] [  908]     0   908    72145      808      42       3        0             0 accounts-daemon
[692522.295378] [  940]     0   940    16411      356      36       3        0             0 systemd-logind
[692522.295380] [  965]     0   965   169520      520      30       3        0             0 lxcfs
[692522.295382] [  967]  1001   967   500540   120954     430       5        0             0 bitcoind
[692522.295384] [  983]     0   983     7064      502      20       3        0             0 atd
[692522.295386] [ 1011]     0  1011     1113       19       8       3        0             0 atopacctd
[692522.295388] [ 1024]  1001  1024   770640   155235    1406       6        0             0 parity
[692522.295390] [ 1042]   104  1042    65192      946      29       4        0             0 rsyslogd
[692522.295391] [ 1083]     0  1083   505761     1703      76       7        0          -900 snapd
[692522.295394] [ 1217]     0  1217     1148      170       9       3        0             0 sshguard-journa
[692522.295396] [ 1218]     0  1218    15062      703      32       3        0             0 journalctl
[692522.295397] [ 1219]     0  1219    20458      311      11       3        0             0 sshguard
[692522.295399] [ 1220]     0  1220     1148      392       8       3        0             0 sshg-fw
[692522.295401] [ 1244]     0  1244    72317      778      43       4        0             0 polkitd
[692522.295403] [ 1289]     0  1289     6321       58      16       3        0             0 iscsid
[692522.295405] [ 1292]     0  1292     6447     1302      18       3        0           -17 iscsid
[692522.295407] [ 1383]     0  1383     4085      439      13       3        0             0 agetty
[692522.295409] [ 1495]     0  1495     3704      342      12       4        0             0 agetty
[692522.295411] [ 1523]     0  1523    18034      661      39       3        0         -1000 sshd
[692522.295413] [ 1524]     0  1524    18106     4410      41       3        0             0 google_ip_forwa
[692522.295415] [ 1526]     0  1526    18041     4411      38       4        0             0 google_clock_sk
[692522.295417] [ 1530]     0  1530    18124     4424      38       3        0             0 google_accounts
[692522.295418] [ 1809]     0  1809   635801     5024     126       8        0          -500 dockerd
[692522.295420] [ 1830]     0  1830   559422     1111      79       8        0          -500 docker-containe
[692522.295422] [20058]     0 20058   486536      776      72       7        0             0 docker
[692522.295424] [20072]     0 20072   169185      299      29       5        0          -500 docker-containe
[692522.295426] [20090]     0 20090 16618233 16156092   31687      69        0             0 lnd
[692522.295428] [24038]     0 24038   150400      285      27       5        0          -500 docker-containe
[692522.295430] [24054]     0 24054     4552      140      14       3        0             0 bash
[692522.295432] [28160]   101 28160    18651      544      37       3        0             0 systemd-network
[692522.295433] [28217]   102 28217    16428      632      35       3        0             0 systemd-resolve
[692522.295435] [28357]     0 28357    28628      597      47       4        0             0 systemd-journal
[692522.295437] [ 1446]     0  1446    10625      543      23       3        0         -1000 systemd-udevd
[692522.295439] [16995]  1001 16995 268814875    29190    1388       9        0             0 rai_node
[692522.295442] [25048]  1001 25048    20056      993      44       3        0             0 systemd
[692522.295443] [25049]  1001 25049    63020      624      54       4        0             0 (sd-pam)
[692522.295445] [25771]     0 25771    26400      820      55       3        0             0 sshd
[692522.295447] [25825]  1001 25825    26476      351      54       3        0             0 sshd
[692522.295449] [25826]  1001 25826     5881     1004      15       3        0             0 bash
[692522.295451] [25842]     0 25842    15962      613      34       3        0             0 sudo
[692522.295460] [25843]     0 25843   219896      715     339       4        0             0 journalctl
[692522.295463] [ 7604]   112  7604    24593      571      24       3        0             0 ntpd
[692522.295465] [ 7748]  1001  7748     1148      188       8       3        0             0 run_rebalancyma
[692522.295467] [ 7750]     0  7750     6658     2396      18       3        0             0 atop
[692522.295469] [ 7780]  1001  7780   175578     8820      90       4        0             0 python3
[692522.295471] Out of memory: Kill process 20090 (lnd) score 962 or sacrifice child
[692522.303246] Killed process 20090 (lnd) total-vm:66472932kB, anon-rss:64624368kB, file-rss:0kB, shmem-rss:0kB
[692527.069765] oom_reaper: reaped process 20090 (lnd), now anon-rss:0kB, file-rss:0kB, shmem-rss:0kB
@Kixunil 2GB sounds abnormal. I'd check the set of open TCP connections on your node, there've been reports of resource draining attacks on nodes via various TCP level attacks. Simpe iptables configurations should stomp them out.
@brndnmtthws that's very odd. The faucet (as an example) has 50+ peers and channels atm, yet is using only 88KB. Similar to the comment above, I'd check to ensure that you don't have any ongoing TCP resource draining attacks, and also that you don't have any flapping peers in tight reconnection loops.
Roasbeef
on 30 Mar 2018
@Roasbeef I'll try banning all the bad hosts with iptables -A INPUT -s <ip> -j DROP and see how it goes.
brndnmtthws
on 30 Mar 2018
@Roasbeef so, I didn't have enough time to play with it and just found, that it was OOM killed. I'll check the connections next time.
Kixunil
on 3 Apr 2018
Related issues
 whizz
·
3Comments
Roasbeef
·
3Comments
whizz
·
3Comments
Roasbeef
·
3Comments
 BitBargain
·
3Comments
BitBargain
·
3Comments
 alexbosworth
·
3Comments
alexbosworth
·
3Comments
 sunnya97
·
3Comments
sunnya97
·
3Comments
Most helpful comment
That article is mostly garbage; the author is uninformed. The attacks it details have _kernel_ level defenses and are unrelated to implementations. That "attack" can be launched on any public facing misconfigured Internet service.
20% of nodes didn't go down. This is an issue with the way explorers are interpreted by users today. We'll only accept advertisements from nodes that actually have channels. However, if a node closes out all its channels, we don't yet remove them from our network view. This is why you at times see unconnected nodes on these explorers. When users updated to the new version of
lnd, they didn't accept the announcements from nodes that no longer had channels open. To the uninformed this looks like many nodes "went down".