Lisk-sdk: Benchmark default parameters of transaction pool
Description
Measure the performance of new transaction pool implementation, this measurement should give us constants which can be defined as default transaction pool processing capability.
Motivation
With the implementation of a new transaction pool, we need to measure the performance of transaction processing capability to identify the constants for optimal utilization of our transaction pool.
Acceptance Criteria
- Define and use benchmark environment (CPU, Memory, etc..) to be able to get consistent results
- maxTransactions: 4096
- maxTransactionsPerAccount: 64
- Test transfer, votes, and multisig-transfer transactions
- Test parameters maxTransactions (4096,8192) and maxTransactionsPerAccount (64, 128)
- Measure time to create a 15kb full block
- Derive transaction pool default configs
Additional Information
It would be better to conduct this research write after we implement the priority queue so that we identify if there are any bottlenecks to processing transactions.
Related issues
4841
 ManuGowda
All 3 comments
Benchmark Environment
| | |
|---|---|
| VPS Provide | Digital Ocean |
| OS | Linux 18.04.3 LTS x 64 |
| Processor | 1 CPU |
| Memory | 1 GB |
| Storage | 25GB SSD|
| NodeJS | v12.13.1 |
| PostgreSQL | 10.12 |
| Network | devnet |
| Build Type | Source |
| Branch | release/4.0.0 |
Benchmark Process
Step 1
- Started the node with dev environment which contains
forging: { force: true } - Transferred few LSK to 1000 accounts and kept track of those 1000 passphrases
Step 2
- Started a node
forging: { force: false }so it does not forge any block, as we just need to measure the performance of a transaction pool. - This node was specially patched with profiling code.
Step 3
- Now that we have 1000 valid accounts
- Started transferring 1 LSK transfer from those accounts to some random account
- These accounts were repeated in a round-robin fashion and continue sending transactions continuously
Step 4
- The patched profiler code used the following values for the
maxTransactionsconfiguration of the transaction pool.
[ 1024, 2048, 3072, 4096, 5120, 6144, 7168, 8192, 9216, 10240 ]
- The patched profiler used the following values for the
maxTransactionsPerAcountconfiguration of the transaction pool.
[ 16, 32, 48, 64, 80, 96, 112, 128, 144, 160, 176, 192, 208, 224, 240, 256, 272, 288, 304, 320, 336, 352, 368, 384, 400, 416, 432, 448, 464, 480, 496, 512 ]
- The profiler code pick 1 value from
maxTransactionsand then benchmarked it against each value ofmaxTransactionsPerAcount - For benchmark used
txPool.getAll.stop()to first stop processing, and then removed every transaction with help oftxPool.getAll()andtxPool.remove(). And then started the pool withtxPool.getAll.start() - So transactions coming in started to process in the pool and we called
txPool.getProcessableTransactions()every 50ms. - As soon we observed that response from this method just crossed
15kbpayload of transactions, we stopped the pool. Recorded the time and configuration and then repeat the whole process with the next configuration value. - For every configuration combination, repeated the whole process for 10 times and then calculated the min, max, and average for all iterations.
- In last aggregated the data to generate the CSV Format.
Benchmark Data
The raw data can be found on the below link.
https://gist.github.com/nazarhussain/356ba6012b5aac324d94b63a5230ff94
For clarity, we plotted some of the values here on this graph.
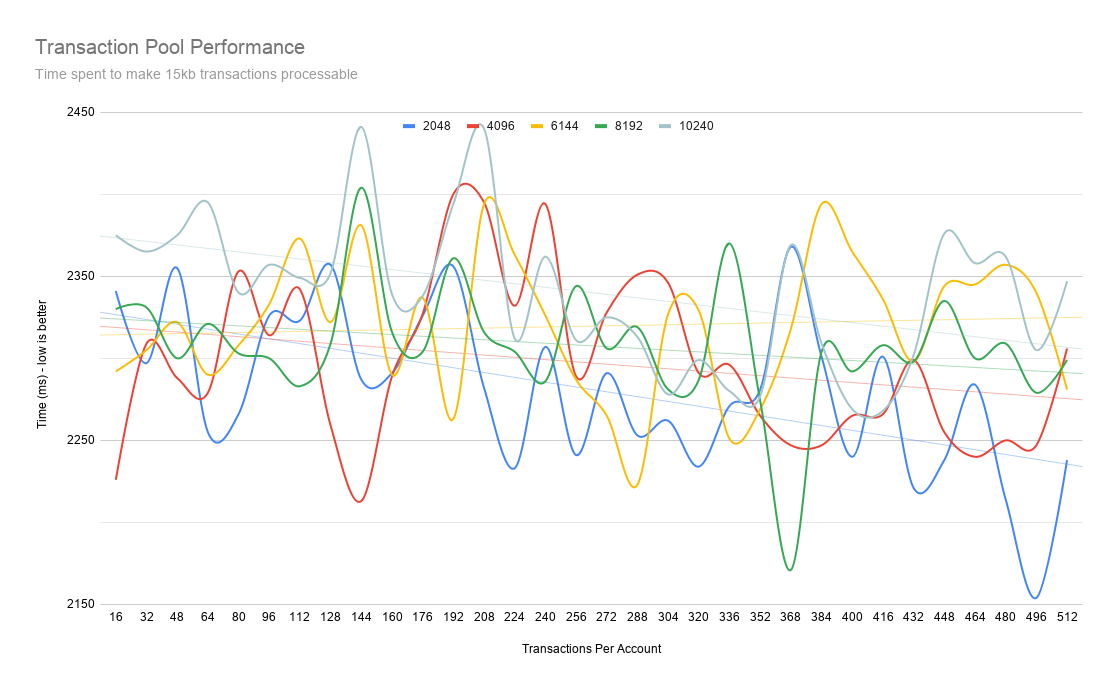
Observations
- One very clear finding from the looking over trend lines is if we increase
maxTransactionsPerAccountvalue the performance is increased. - Some values of
maxTransactionsperformed well for lower values ofmaxTransactionsPerAccount, but overall trend lines show the same. - The higher value of
maxTransationsperformed badly compared to lower values. - It is to be noted that the transaction pool was receiving transactions continuously without any delay through HTTP API.
- The profiling code was running on the same NodeJS process in which the actual Node was running, so it may also create extra overhead.
- These benchmarked performed here is only with transfer transactions. But my common understanding is with other types of transactions, the trend will remain the same.
- During the whole process of benchmarking the node processed
392698transactions in the transaction pool. - One point of interest, which is not part of data but got in my observation is that on average
110-115transfer transactions made up to15kb.
Conclusions
The current configuration of (4096, 64) provides roughly 2300 ms average, which is good enough considering the 10s block time.
We can achieve more performance if we decrease the max number of transactions to 2048 and per account limit to 48, the performance increase here will be rough 30ms - 50ms, which is not that significant.
So I suggest keeping the current configurations as it is and if we observe something special in beta net phase, we can decrease these values. And if we observe high traffic volume, we can increase the values as well with some understanding from the above graph how much performance will be decreased.
 nazarhussain
on 17 Apr 2020
nazarhussain
on 17 Apr 2020
@ManuGowda @shuse2 Please look into the above findings and details and share your feedback.
nazarhussain
on 17 Apr 2020
Great job =)
We have concluded that the current default parameter is good with the current setup.
 shuse2
on 20 Apr 2020
shuse2
on 20 Apr 2020
Related issues
 slaweet
·
4Comments
slaweet
·
4Comments
 toschdev
·
3Comments
toschdev
·
3Comments
 willclarktech
·
4Comments
willclarktech
·
4Comments
 Nazgolze
·
3Comments
ManuGowda
·
3Comments
Nazgolze
·
3Comments
ManuGowda
·
3Comments
Most helpful comment
Benchmark Environment
| | |
|---|---|
| VPS Provide | Digital Ocean |
| OS | Linux 18.04.3 LTS x 64 |
| Processor | 1 CPU |
| Memory | 1 GB |
| Storage | 25GB SSD|
| NodeJS | v12.13.1 |
| PostgreSQL | 10.12 |
| Network | devnet |
| Build Type | Source |
| Branch | release/4.0.0 |
Benchmark Process
Step 1
forging: { force: true }Step 2
forging: { force: false }so it does not forge any block, as we just need to measure the performance of a transaction pool.Step 3
Step 4
maxTransactionsconfiguration of the transaction pool.maxTransactionsPerAcountconfiguration of the transaction pool.maxTransactionsand then benchmarked it against each value ofmaxTransactionsPerAcounttxPool.getAll.stop()to first stop processing, and then removed every transaction with help oftxPool.getAll()andtxPool.remove(). And then started the pool withtxPool.getAll.start()txPool.getProcessableTransactions()every 50ms.15kbpayload of transactions, we stopped the pool. Recorded the time and configuration and then repeat the whole process with the next configuration value.Benchmark Data
The raw data can be found on the below link.
https://gist.github.com/nazarhussain/356ba6012b5aac324d94b63a5230ff94
For clarity, we plotted some of the values here on this graph.
Observations
maxTransactionsPerAccountvalue the performance is increased.maxTransactionsperformed well for lower values ofmaxTransactionsPerAccount, but overall trend lines show the same.maxTransationsperformed badly compared to lower values.392698transactions in the transaction pool.110-115transfer transactions made up to15kb.Conclusions
The current configuration of
(4096, 64)provides roughly2300 msaverage, which is good enough considering the10sblock time.We can achieve more performance if we decrease the max number of transactions to
2048and per account limit to48, the performance increase here will be rough30ms - 50ms, which is not that significant.So I suggest keeping the current configurations as it is and if we observe something special in beta net phase, we can decrease these values. And if we observe high traffic volume, we can increase the values as well with some understanding from the above graph how much performance will be decreased.