Linkerd2: Consolidate dashboard API requests further to speed up dashboard
3467 simplified and sped up the dashboard by reducing API requests, adding a namespace selection button and removing the sidebar's list of resources and their green/red status icons. It also expanded our use of React's Context API. The user's selected namespace is now shared to all components that are consuming context. We can update that shared context from within the app when the user changes the namespace.
We may be able to reduce API requests even more by leaning into the Context API. We should investigate each component that is making API calls to see if the calls can be further consolidated.
 scottcarol
All 13 comments
Hey @tegioz, thanks for taking on this issue!
Before a PR, I'd like to have a discussion, that can take place in this issue, about different options we can consider to achieve a faster dashboard, on the React/JavaScript side.
Can you evaluate our existing architecture and API requests, and propose some options (without a PR)? This will enable us to have a conversation before making any major changes to dashboard architecture.
Whatever we decide, due to the upcoming dashboard redesign, it may be best to wait on making these changes, to prevent doing work that will be undone with a new UI. In the meantime, I'm looking forward to your thoughts!
scottcarol
on 16 Nov 2019
A bit of context first
In #3258 it was pointed out that the Linkerd dashboard imposed a lot of CPU stress on Prometheus. In my following comments in this issue I'll propose some possible improvements we could apply to reduce the load on Prometheus. This is an ongoing work, I'll keep posting any new findings.
At the moment, I'm using a local minikube cluster for my tests with only the emojivoto app running on it. The initial goal is to start thinking about improvements that may have a positive impact at any scale.
None of the improvements identified so far are silver bullets. They may have a positive impact in some use cases, but won't apply to others. However, most of them are easy to implement, so if they help to make the life of some users easier, they may be worth considering.
 tegioz
on 20 Nov 2019
tegioz
on 20 Nov 2019
Improvement 1
Avoid fetching data not needed from the dashboard
In the ResourceDetail view, when fetching data for upstream and downstream resources, we use all as the resource type. Up in the chain, when getting metrics from Prometheus, using all leads to querying Prometheus for each resource kind individually both for inbound and outbound directions. However, that view isn't really interested in all those stats, as it filters them out later on when processing the data received. When looking at a pod details, we actually only look at pods metrics. When looking at other resources, we are not interested on the pods metrics, for example.
I've run a minimal PoC based on this, asking only for pods metrics when viewing a pod details view. The number of queries to Prometheus every 2s went from 78 to 22 and the impact on Prometheus is already noticeable, even though the load in the cluster is minimal. In addition to the improvement on the Prometheus load, the load on the controller, web, proxies and the browser is also reduced as there is less data to move around and process.
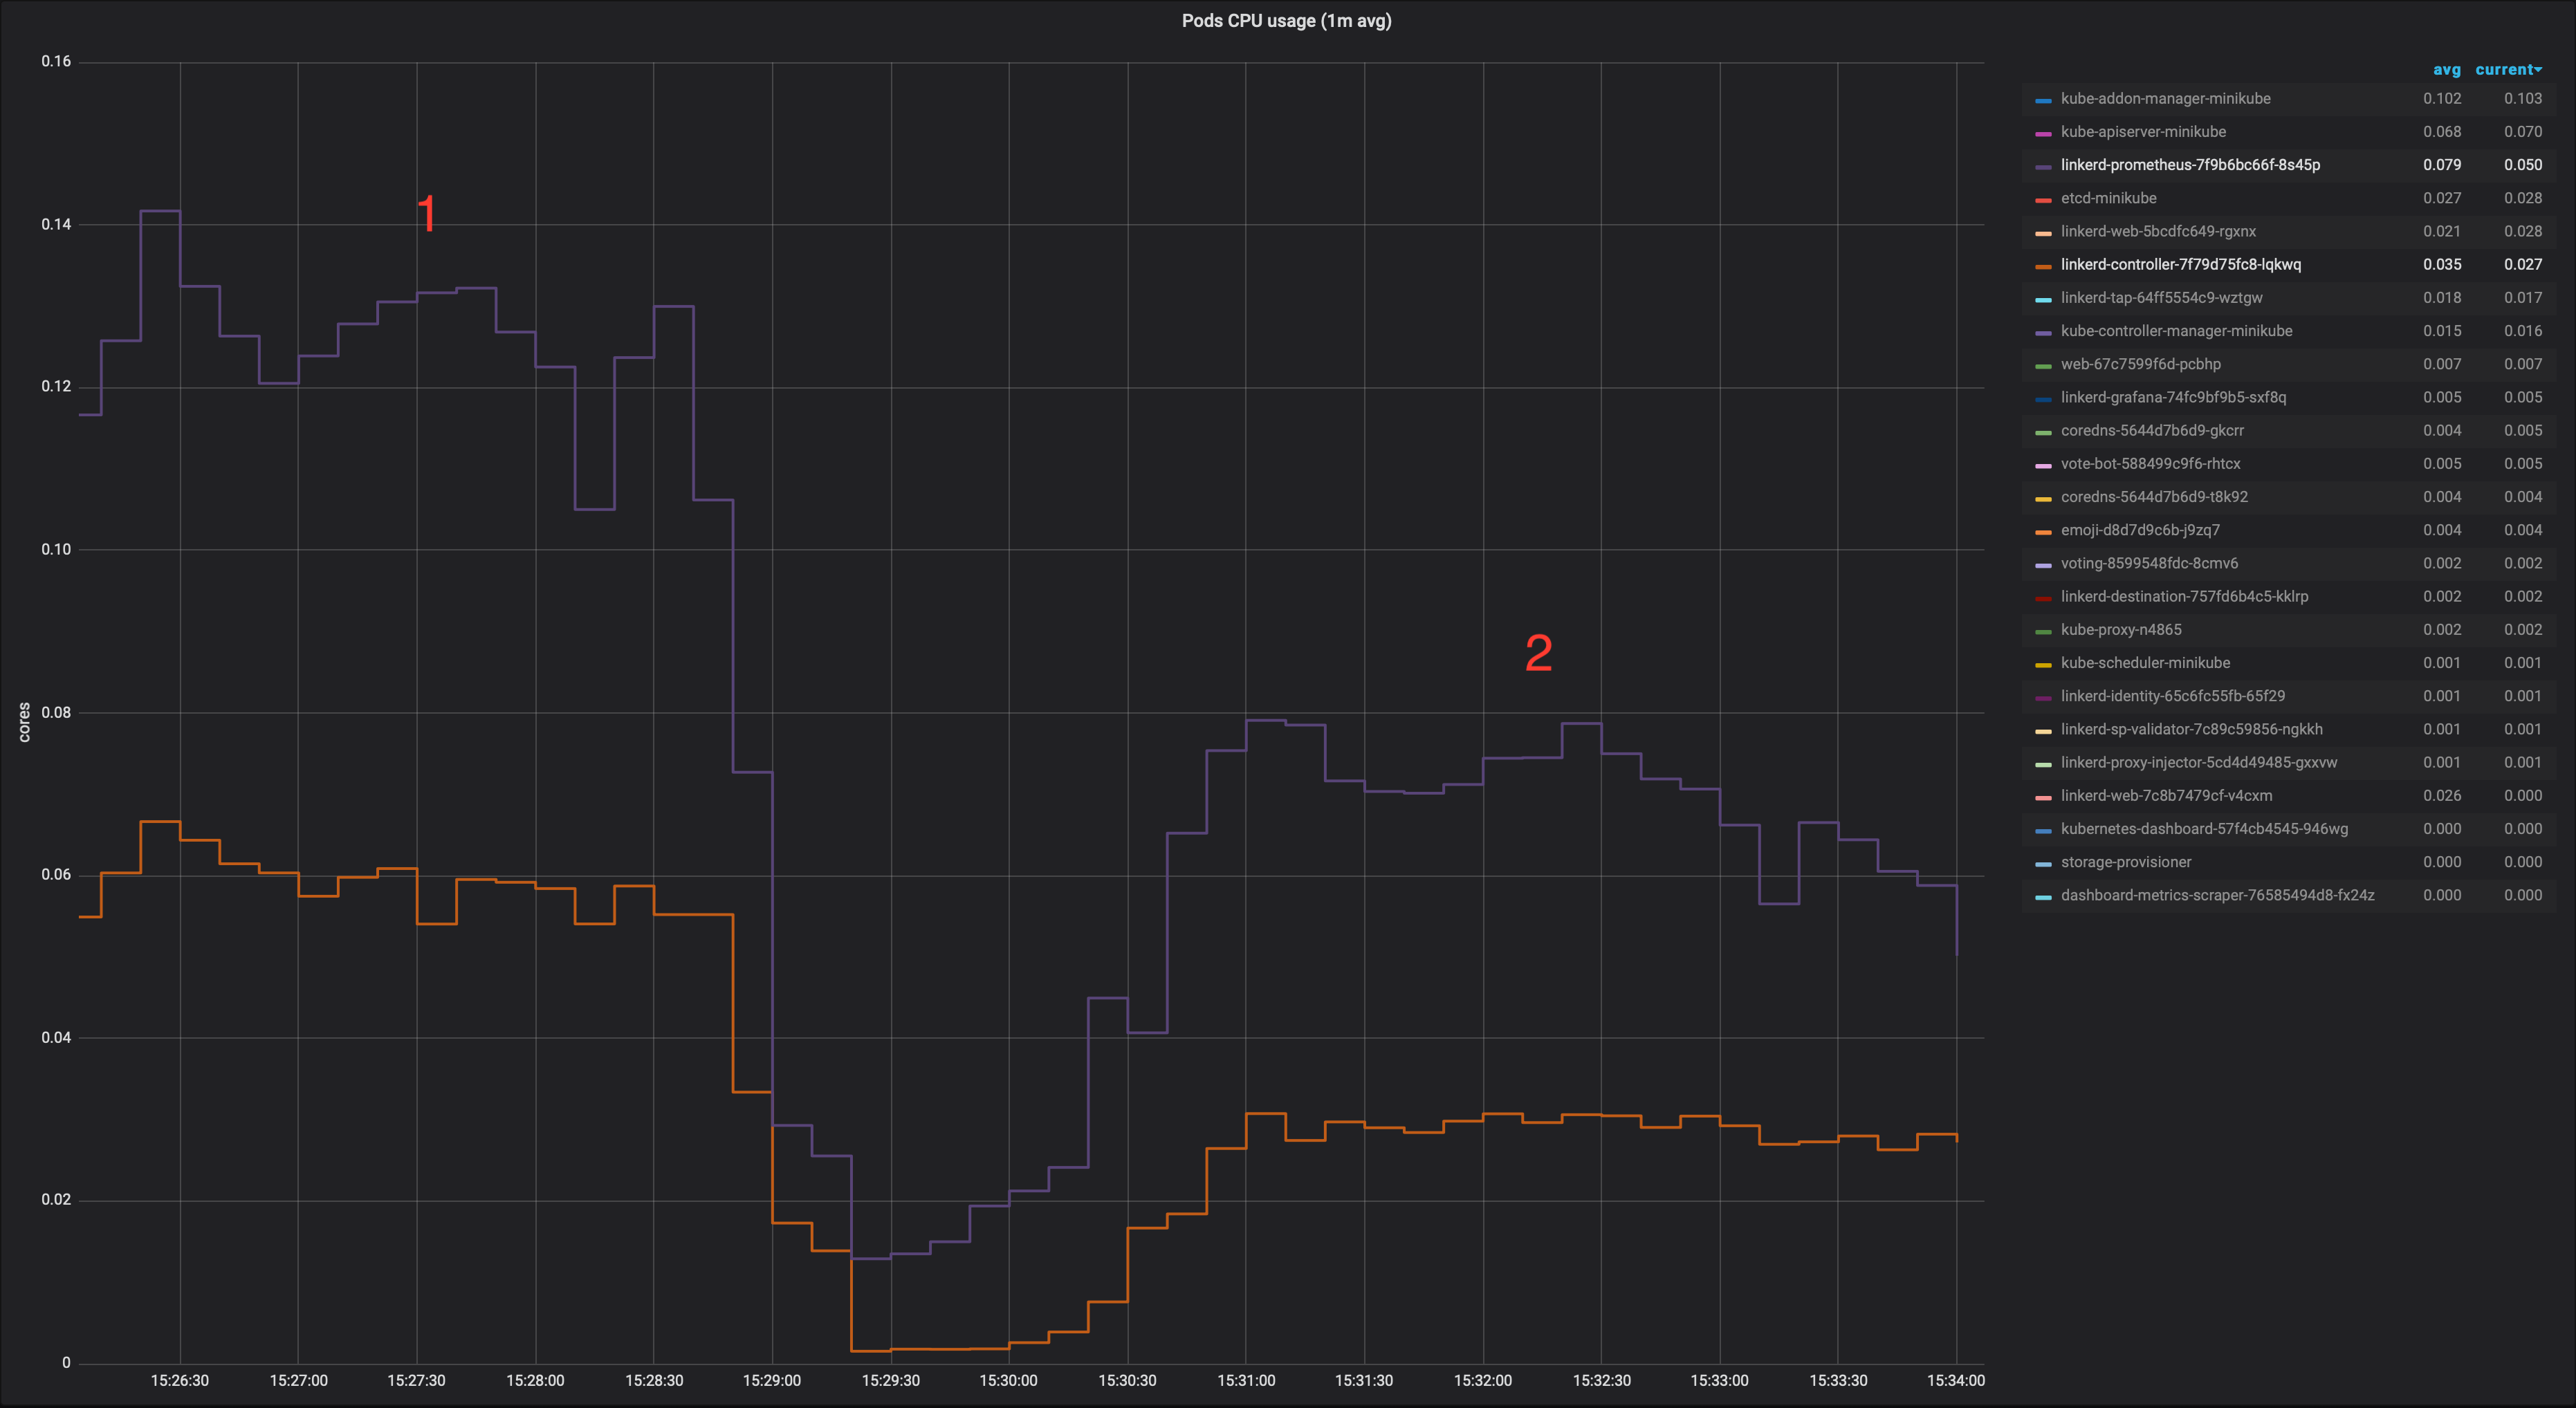
1: baseline (master)
2: only fetching metrics needed from the dashboard
I think we could try to improve this requesting only the data we actually need for upstream/downstream resources. Happy to submit a PR for this.
EDIT 1: The number of queries to Prometheus every 2s went from 24 to 10. I forgot to include quantiles queries, the correct numbers would be from 78 to 22.
tegioz
on 20 Nov 2019
Improvement 2
Pause dashboard network activity when dashboard is not visible
At the moment, if a user opens the dashboard and leaves it in a browser tab or a minimised window, it will keep polling the backend every 2 seconds. This may have an important impact on Prometheus, specially on big clusters and/or if multiple users do the same.
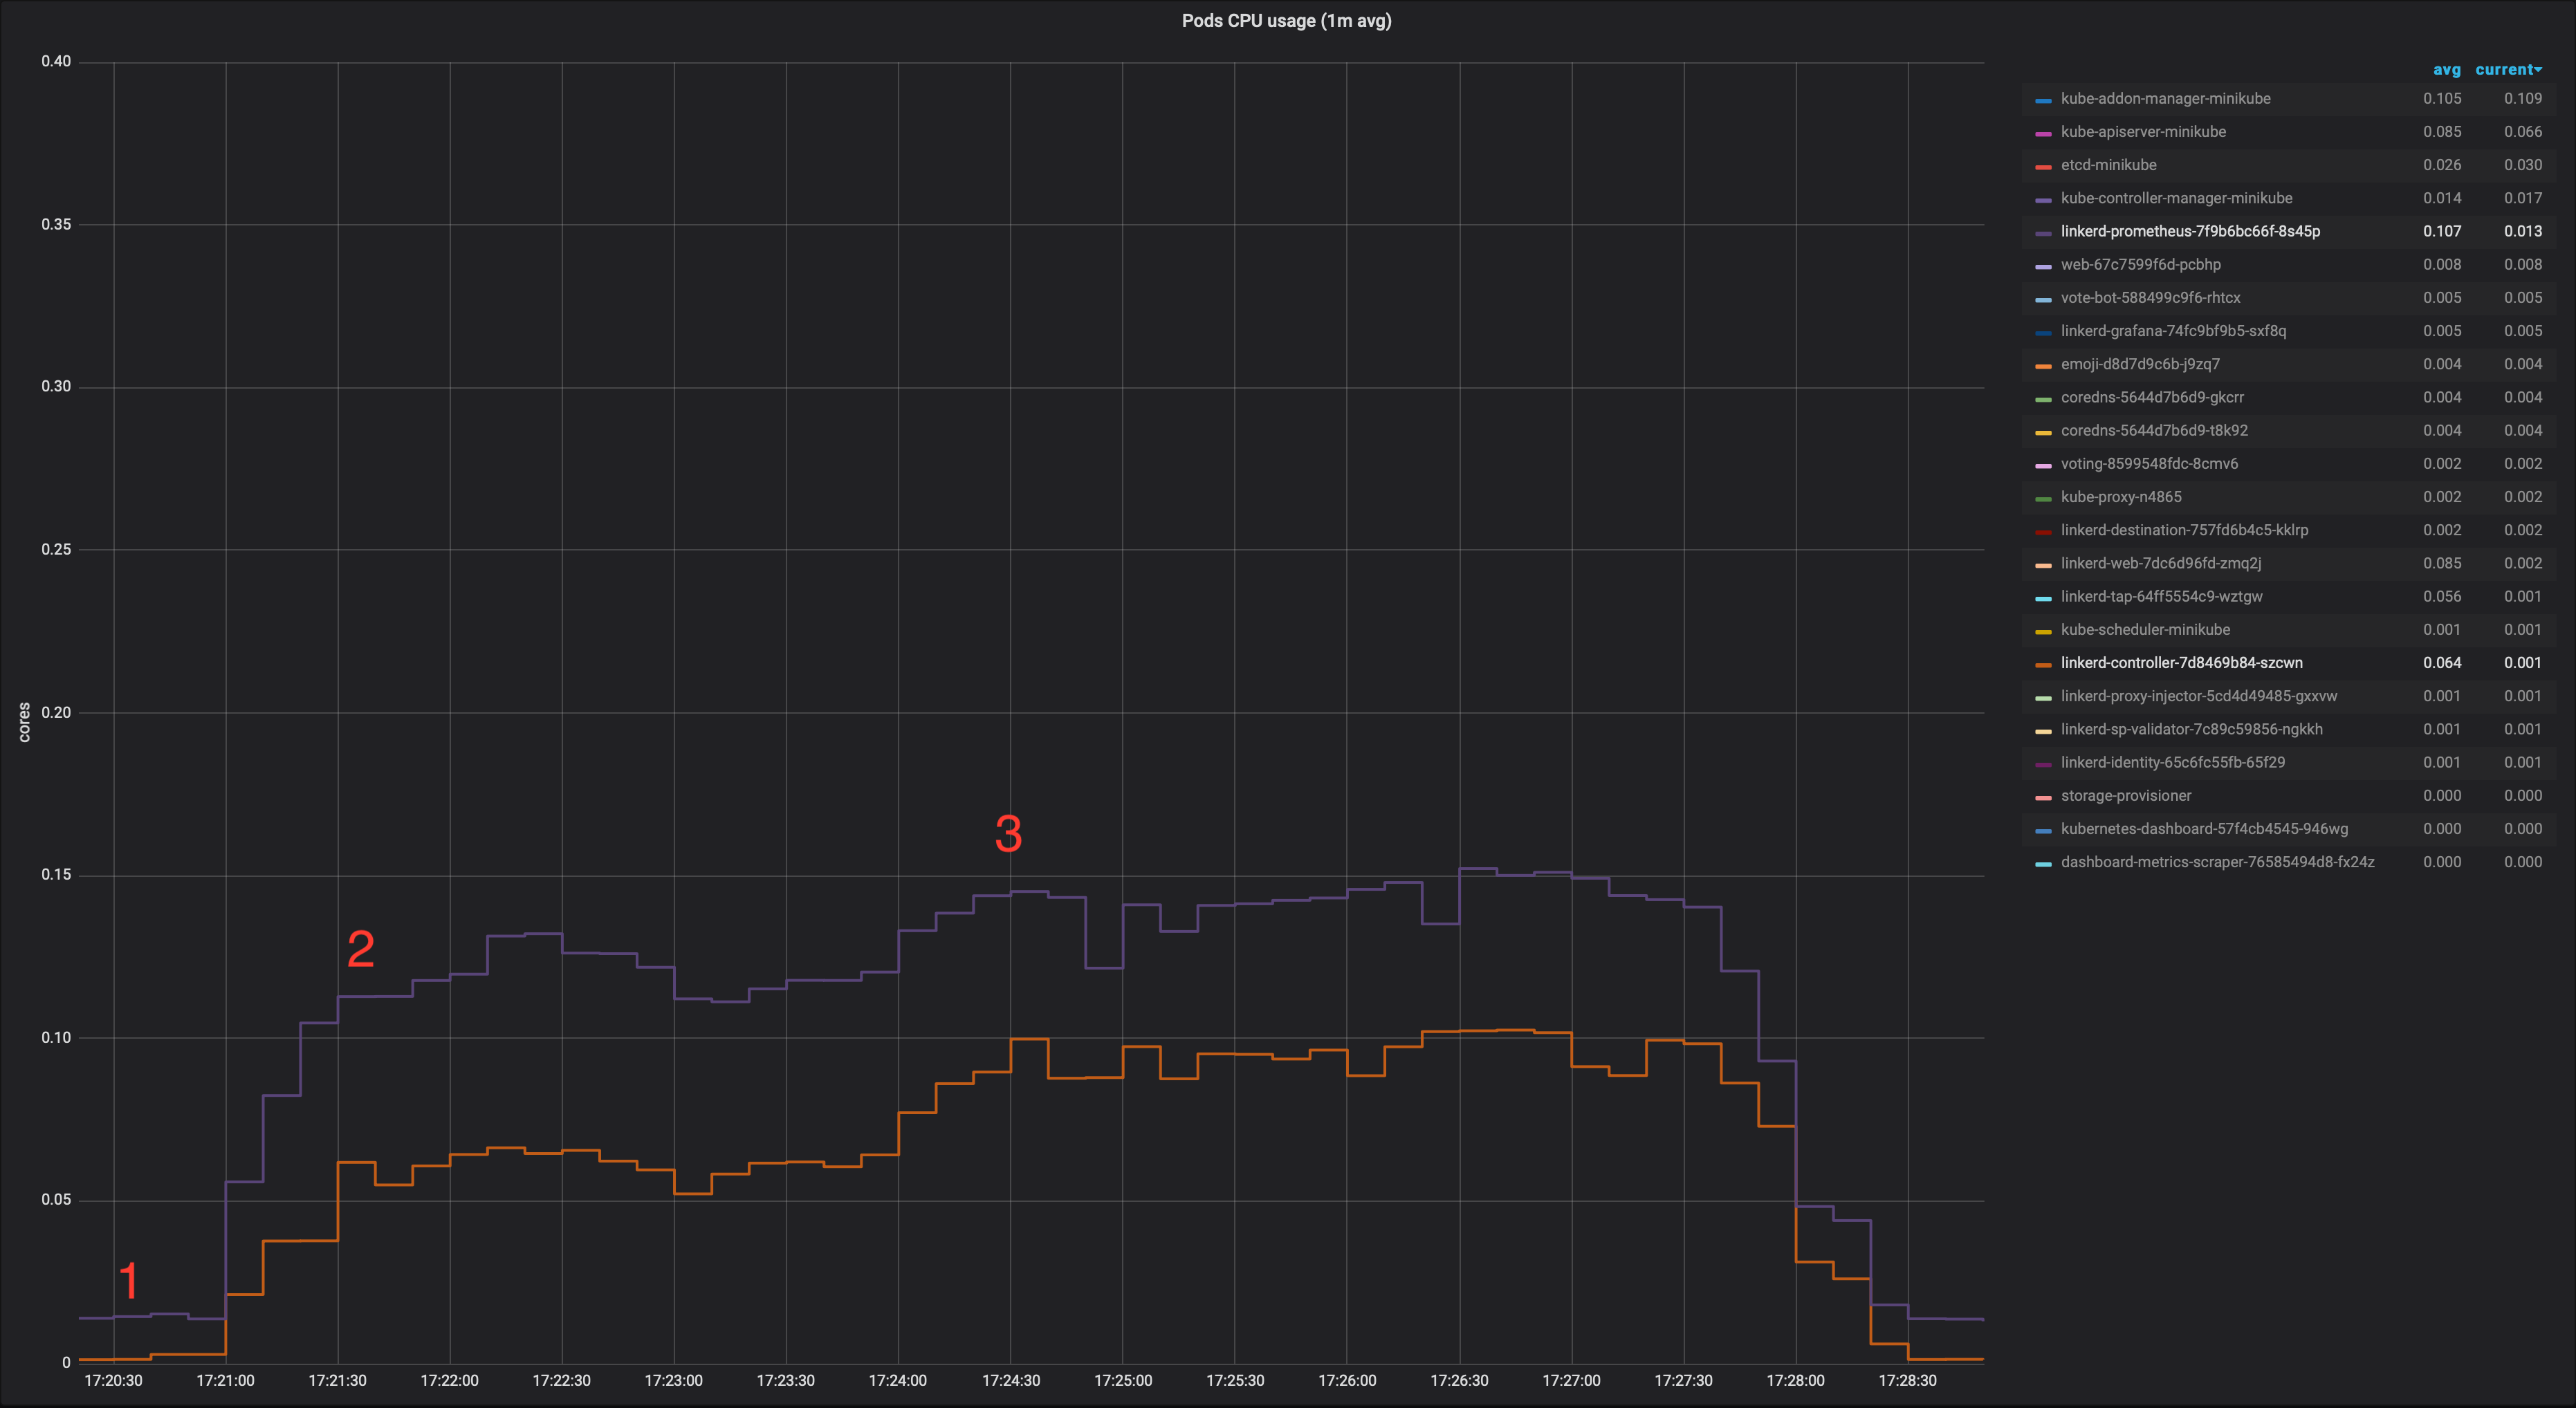
This is the impact of opening the controller pod view in the dashboard while having the window minimised or in a tab not visible:
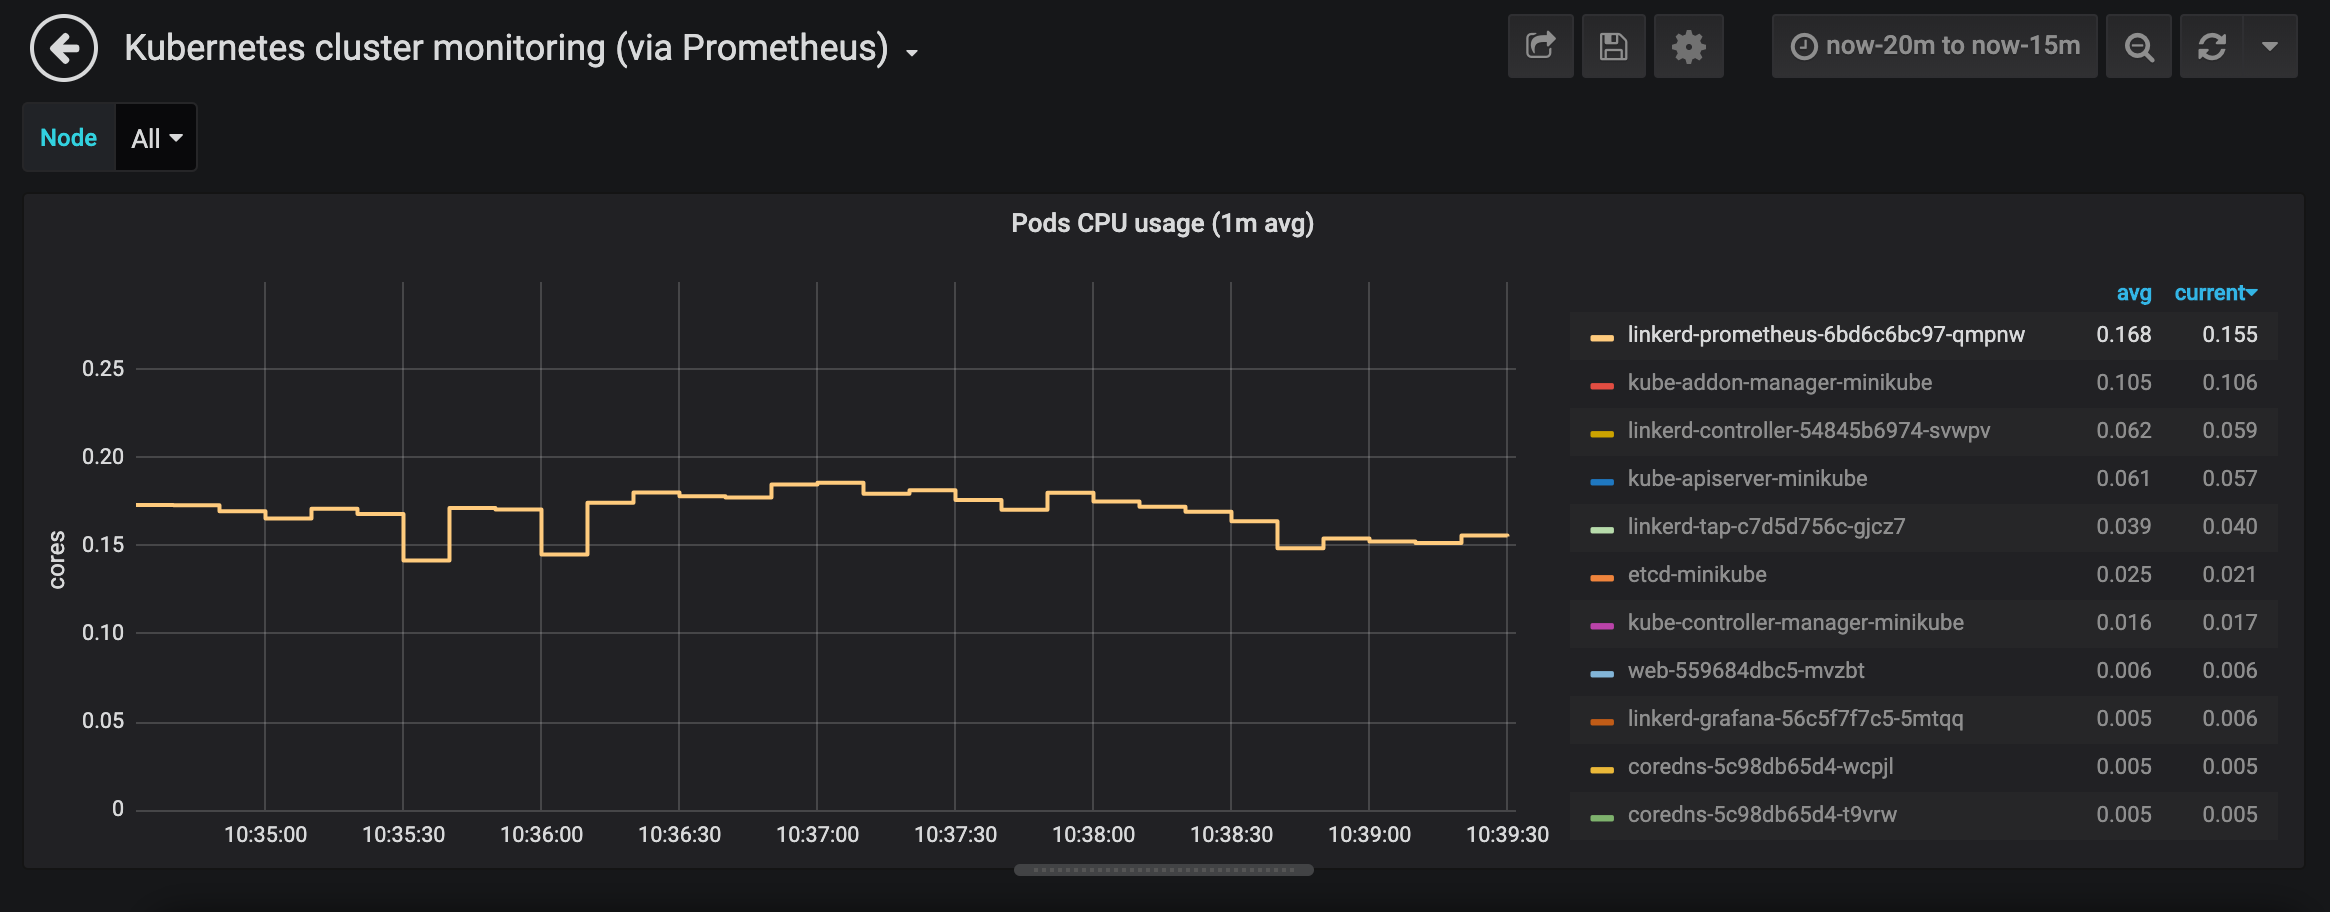
Some browsers (Safari mostly) try to slow down intervals when this happens, but it's not as good as it could be and not consistent across browsers. The proposal would be to pause the dashboard network activity when it is minimised or hidden in a tab not visible.
@cynthia-sg has put together a PoC based on this. As soon as the dashboard is not visible, network activity is paused. When the user goes back to it, it resumes immediately. Load on Prometheus goes down quickly in those cases as shown below:
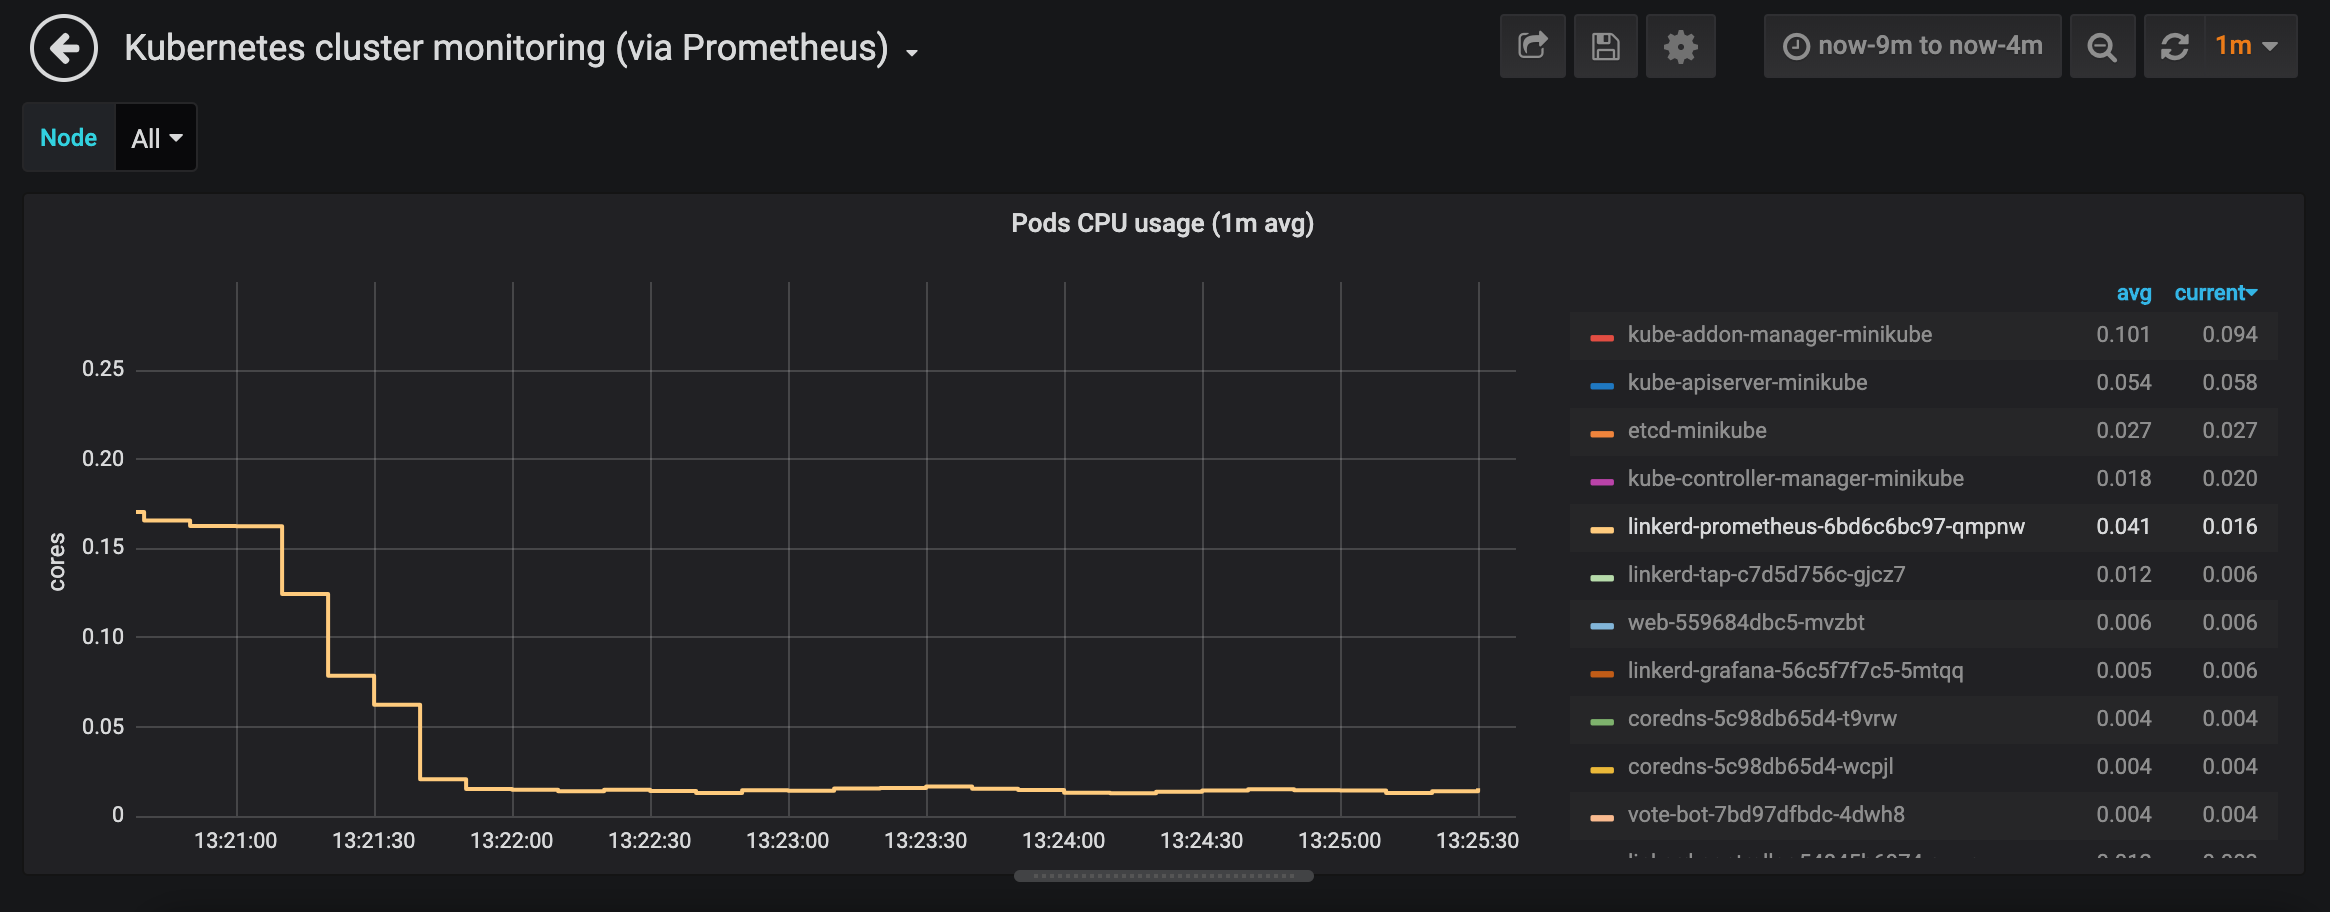
Happy to submit a PR for this too.
tegioz
on 20 Nov 2019
Improvement 3
Cache StatSummary responses in dashboard web server
This improvement would only help if the same view is opened multiple times (by the same or different users). It could be the main dashboard page or any specific resource view. It's probably something not very common, but it could happen that some members of a team are debugging an issue and looking at the same resources.
At the moment, without the cache, the pressure on Prometheus grows as more dashboards are opened.
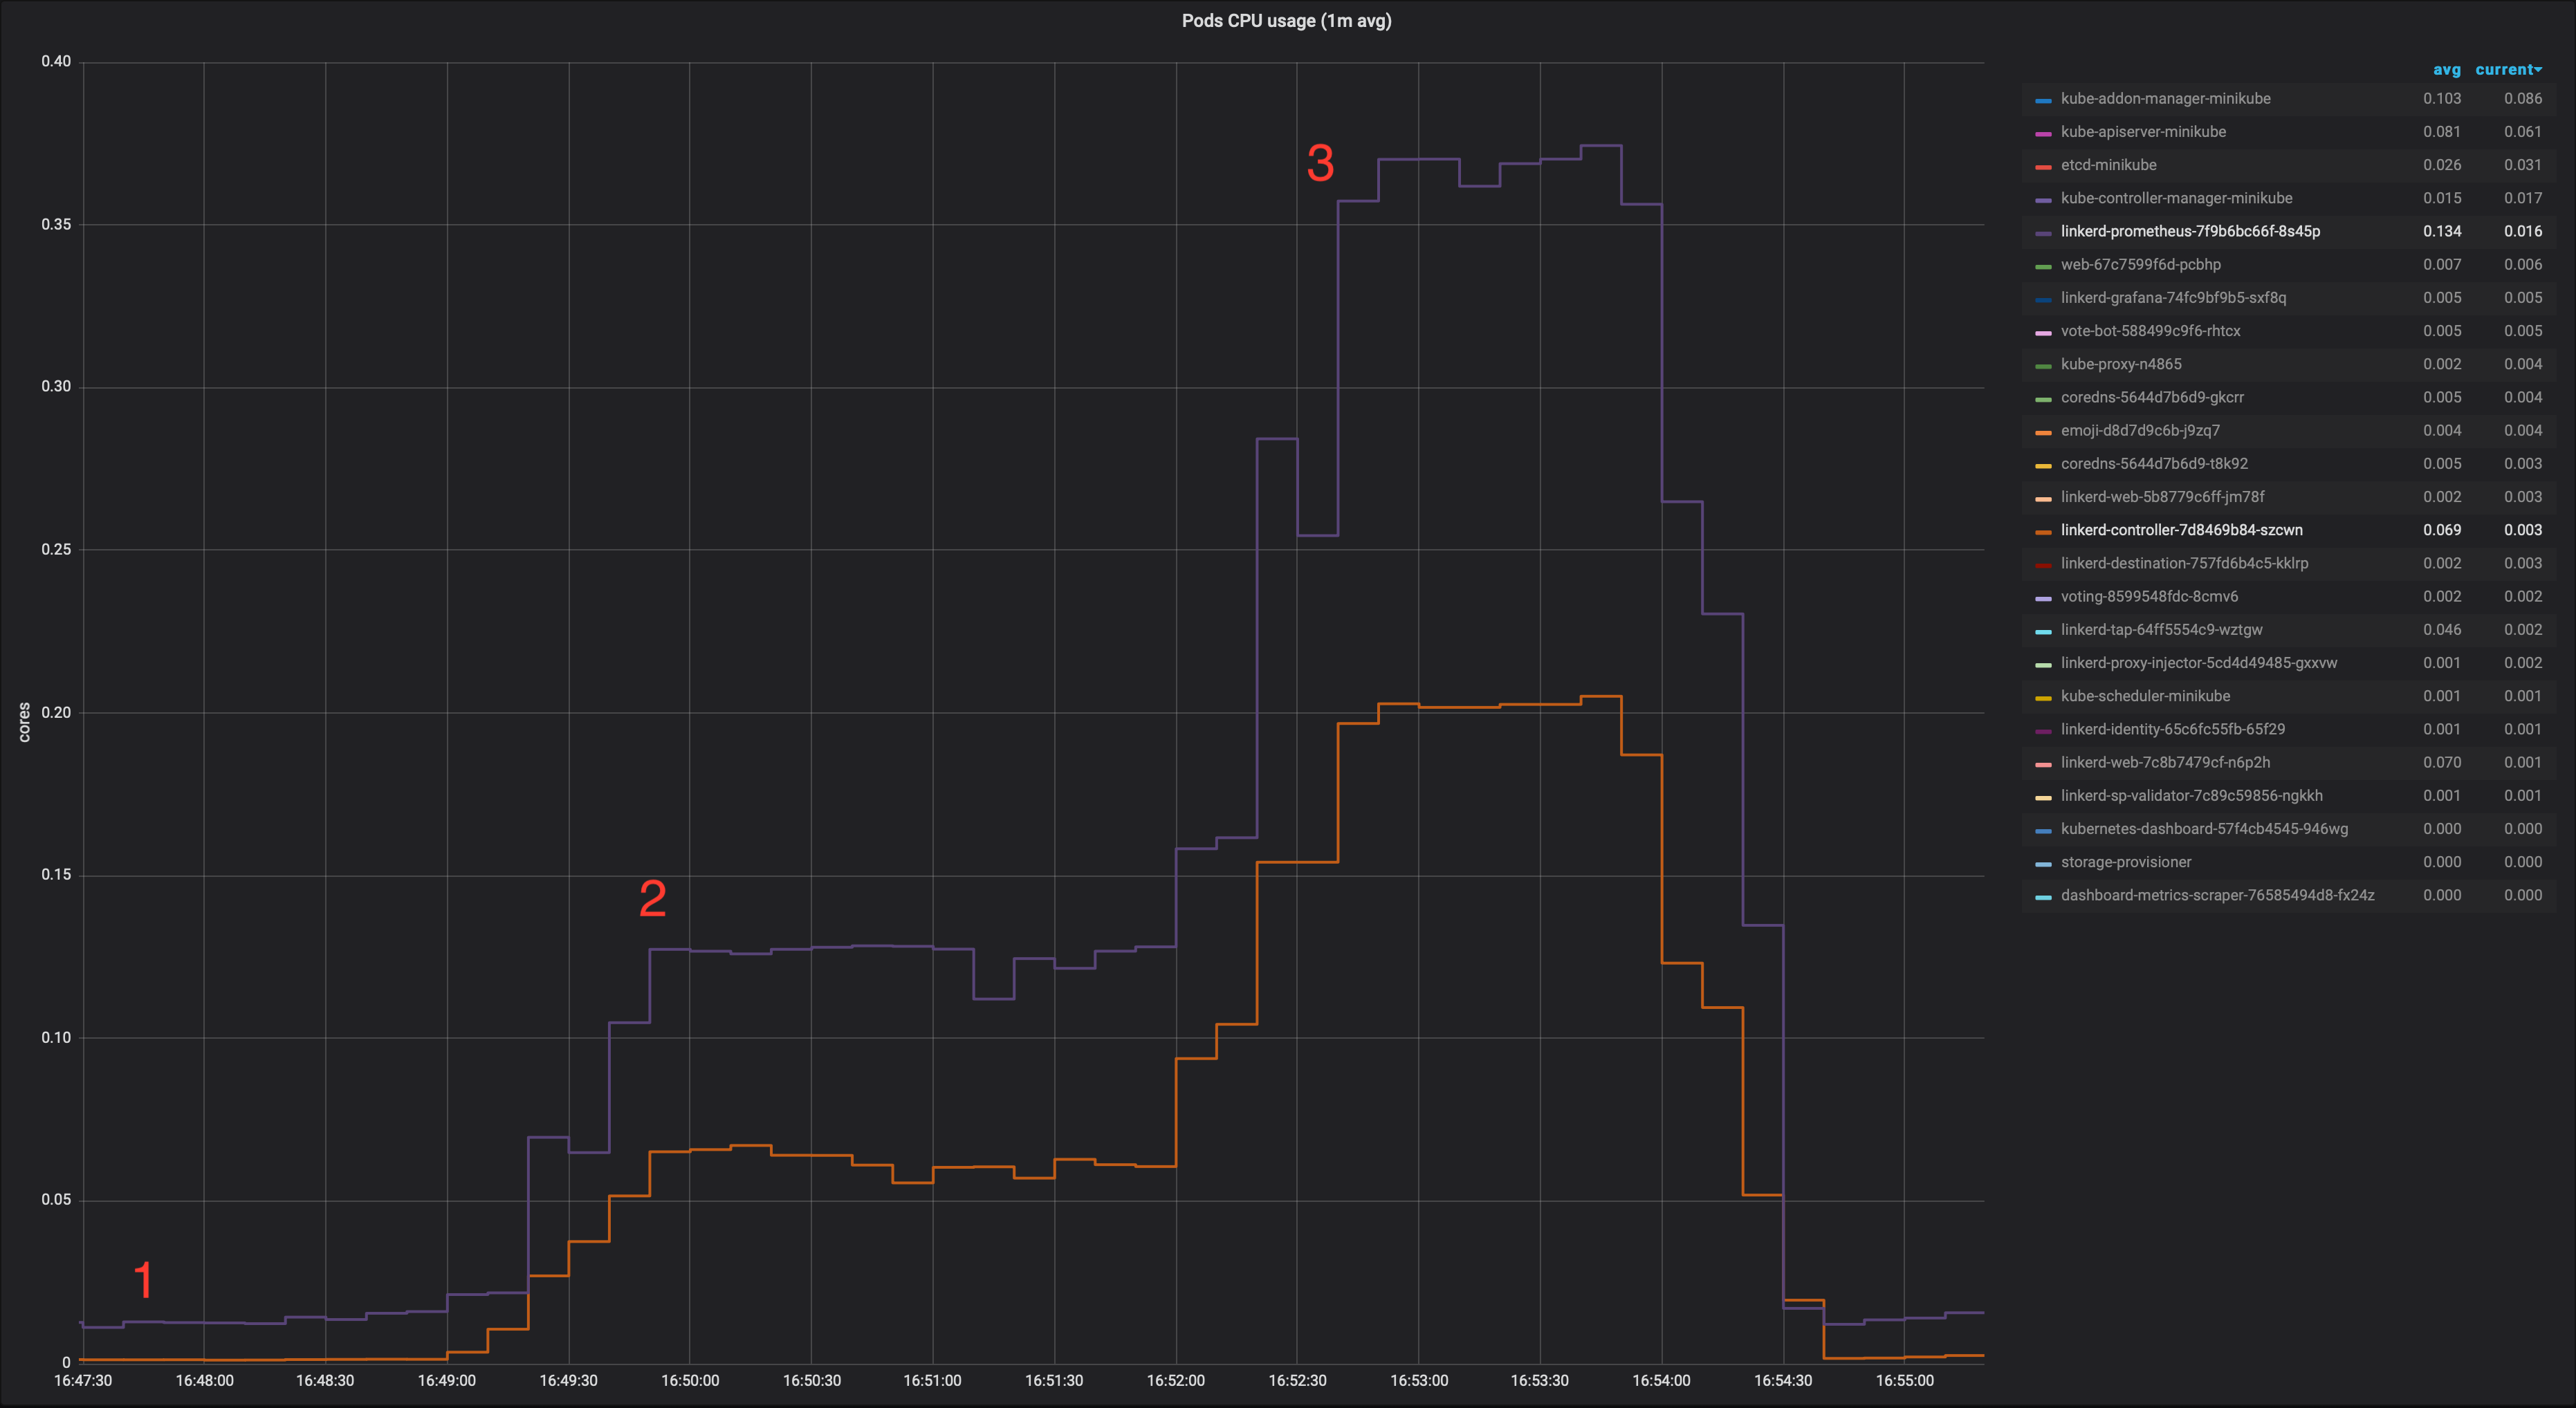
1. No dashboard open
2. One dashboard open: linkerd controller pod view
3. Three dashboards open: linkerd controller pod view
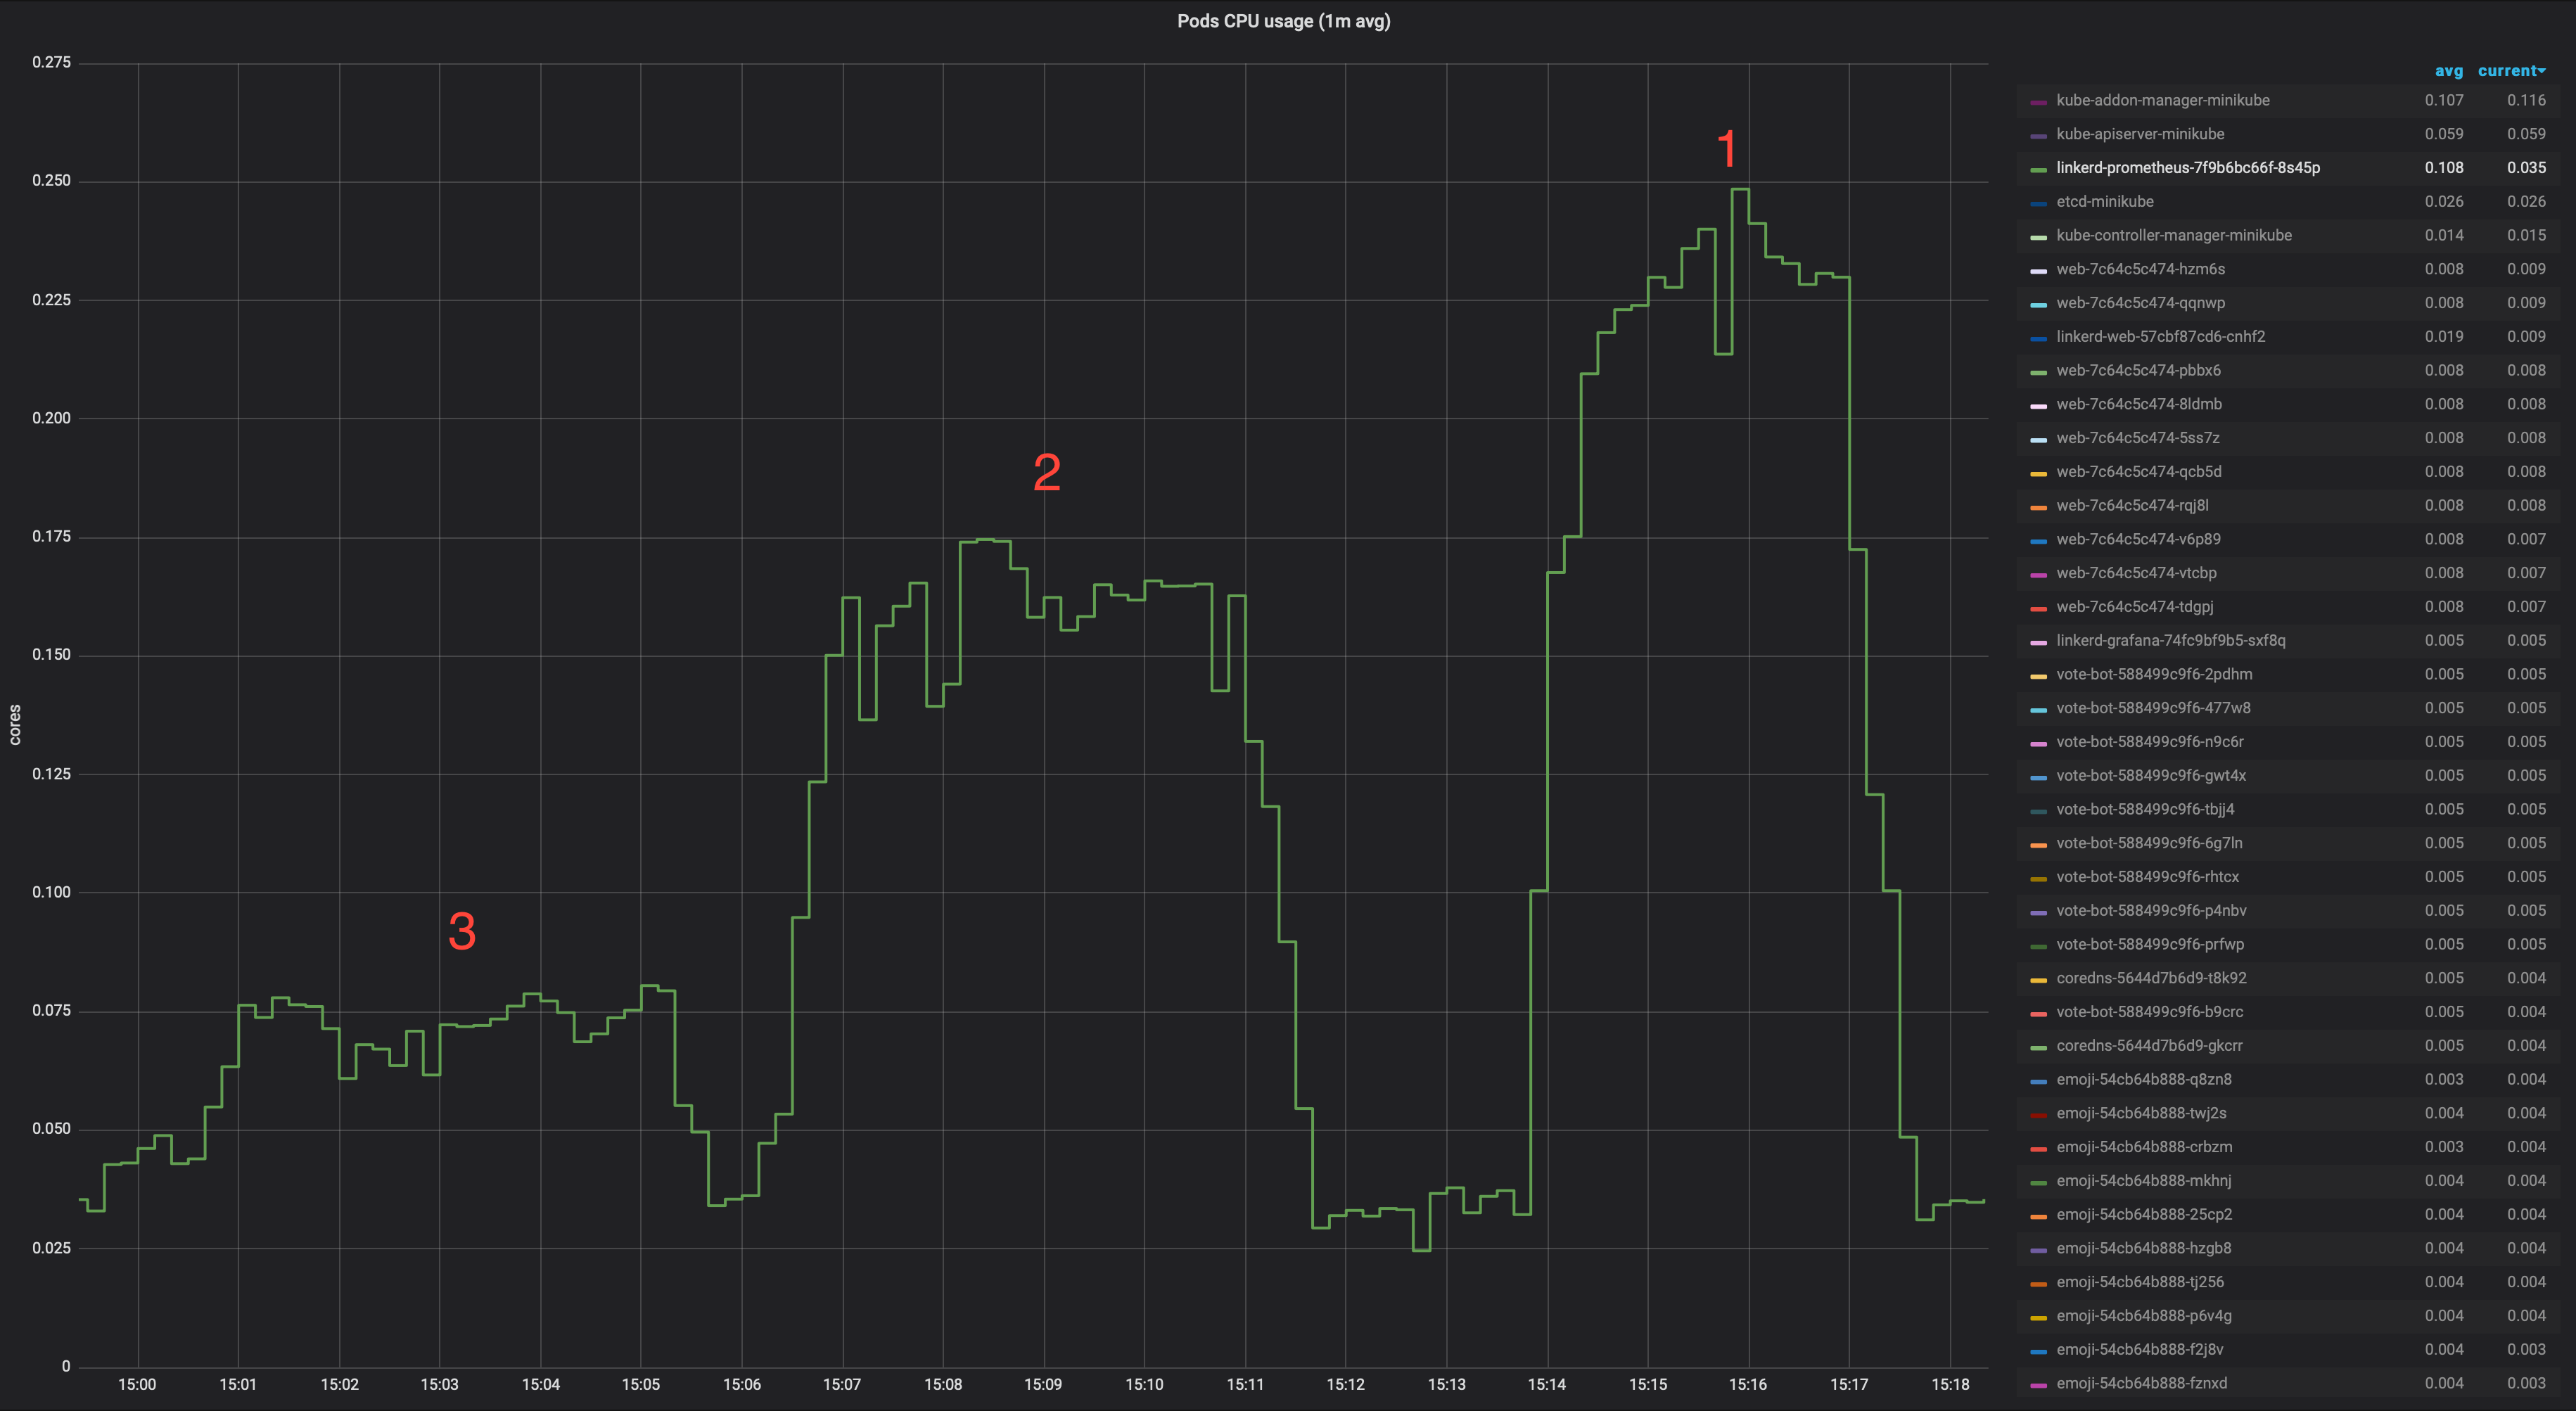
Same test run using a minimal PoC caching the already json marshalled* StatSummary responses for 1 second (* to save some cpu cycles in the dashboard web server as well).
1. No dashboard open
2. One dashboard open: linkerd controller pod view
3. Three dashboards open: linkerd controller pod view
IIRC the HA setup runs a single web instance, so a very simple cache would do the trick, the change would be minimal. For a distributed approach without using any centralised cache, we could use something like groupcache, which works great.
Happy to submit a PR if you think this could be interesting :)
tegioz
on 20 Nov 2019
Improvement 4
Avoid fetching data not needed from the dashboard (II)
Currently when viewing a pod details, we list all pods in the namespace and we fetch metrics for all of them every 2s. We do this to get all the pods belonging to the requested resource and display them. But in the case of a pod, that doesn't apply. So in that view, that data is not really needed. We need the requested pod metrics, but we fetch them in a separate query. So we could save those two http requests plus the associated prometheus queries. In a cluster with a large number of pods, the impact could be considerable.
I've run a test opening one emoji pod details in the dashboard in a cluster running 10 replicas of each of the deployments in the emojivoto namespace to measure the impact on Prometheus.
(emojivoto with 10 replicas for each deployment)

1. baseline (master)
2. IMPROVEMENT 4 PoC (not fetching all namespace pod metrics when not needed)
3. IMPROVEMENT 4 PoC + IMPROVEMENT 1 PoC
@tegioz this is amazing. I love all four improvements. Do you have any idea what kind of complexity and implementation tradeoffs there are with each? I'm interested in SWAG implementation estimates so that we can fit it all into the priority queue.
 grampelberg
on 22 Nov 2019
grampelberg
on 22 Nov 2019
Thanks @grampelberg!
I'd say all of them would be very easy to implement, no tradeoffs to worry about that I can think of right now. I have some proofs of concept around so we can start some discussions from them.
Working on a possible 5th :)
tegioz
on 22 Nov 2019
Aw yeah! I know a couple users who are going to be ecstatic to see this work.
grampelberg
on 22 Nov 2019
Improvement 5
Avoid fetching data not needed from the dashboard (III)
This one is actually a generalisation of Improvement 4. When viewing the detail page of any resource, we show the pods belonging to that resource. When the resource is a pod, none are needed as explained in 4. However, for any other resource, we need the pods that belong to it. At the moment, we fetch all the pods in the namespace metrics and filter them in the dashboard. The reason is that the stats api endpoint doesn't provide a way to get metrics for the pods that belong to a given resource as pointed out here and here.
Metrics in Prometheus seem to have labels for the parent of the pod (I've seen them at least in the case of deployments in response_latency_ms_bucket, response_total and tcp_*), so I propose we extend the api with an extra parameter like parent or owner to be able to get metrics only for the pods we really need.
I think the difference can be quite considerable (no graphs this time, sorry ;). Viewing the details of a deployment with 10 replicas may need to get metrics for 500 pods in a namespace instead of 10.
tegioz
on 22 Nov 2019
@tegioz @cynthia-sg Thank you! This is great. Proposing the fixes with the potential solutions are perfect 👍 It's also helpful to quantify the improvements in some way.
I'd like to move forward on 1, 2, 4 and 5 to start. 3 seems like an edge case and I'd like to hold that for after the other changes are merged.
For testing purposes, it's preferable to split them up into separate PRs. Do you anticipate a lot of rebasing/conflicts if they are in separate PRs, due to some of these suggestions touching the same logic?
scottcarol
on 25 Nov 2019
Thanks @scottcarol !
For testing purposes, it's preferable to split them up into separate PRs. Do you anticipate a lot of rebasing/conflicts if they are in separate PRs, due to some of these suggestions touching the same logic?
I've just created 2 PRs that should address improvement 1 and 4 separately. There will be some conflicts with these 2, but I'll take care of them when rebasing once one of them is merged. @cynthia-sg will create a different one to address improvement 2. I also have created a draft PR for improvement 3, to be kept on hold until you think we are ready for that one.
Maybe we can wait until we merge the first four to create one for improvement 5. This one will involve touching the same logic again, so we can avoid some more conflicts waiting a bit.
tegioz
on 28 Nov 2019
This issue is now being tracked in #3860
scottcarol
on 11 Jan 2020
Related issues
 manimaul
·
3Comments
manimaul
·
3Comments
 miklezzzz
·
3Comments
miklezzzz
·
3Comments
 steve-fraser
·
4Comments
steve-fraser
·
4Comments
 klingerf
·
3Comments
klingerf
·
3Comments
 zaharidichev
·
4Comments
zaharidichev
·
4Comments