Linkerd2: Possible Memory Leak in Proxy Sidecar
Bug Report
What is the issue?
Yesterday one of our meshed services started crashlooping, because the liveness probe failed. Interestingly, because it was not able to resolve the IP of another service (java.net.UnknownHostException: xxx.default.svc.cluster.local.). The restarts did not help to recover from the problem and evenually we had to recreate the whole Pod manually. As far as I see, the health checks of our service and the proxy failed, but the proxy was never restarted.
The proxy sidecar of that Pod started to hog memory 5h30m before it failed:
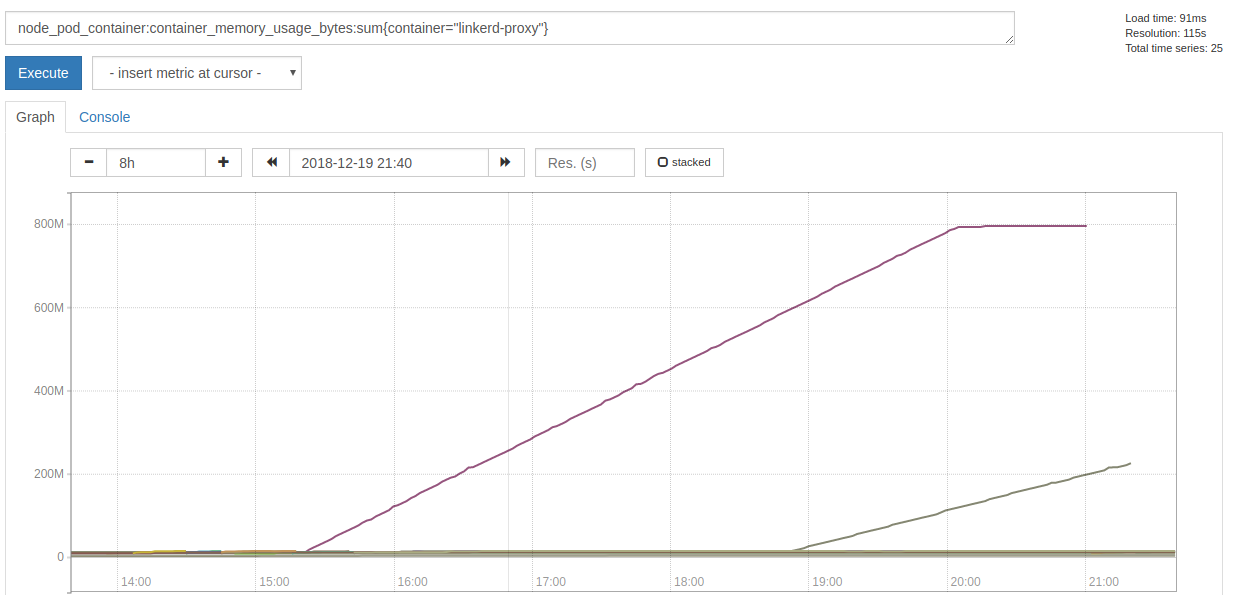
When the actual failures began, it stopped allocating memory, but spammed this error message with a rate of ~7k per second:
2018-12-19T21:01:33.000210171Z WARN trust_dns_proto::udp::udp_stream could not get next random port, delaying
Also it consumed a lot more of CPU time:
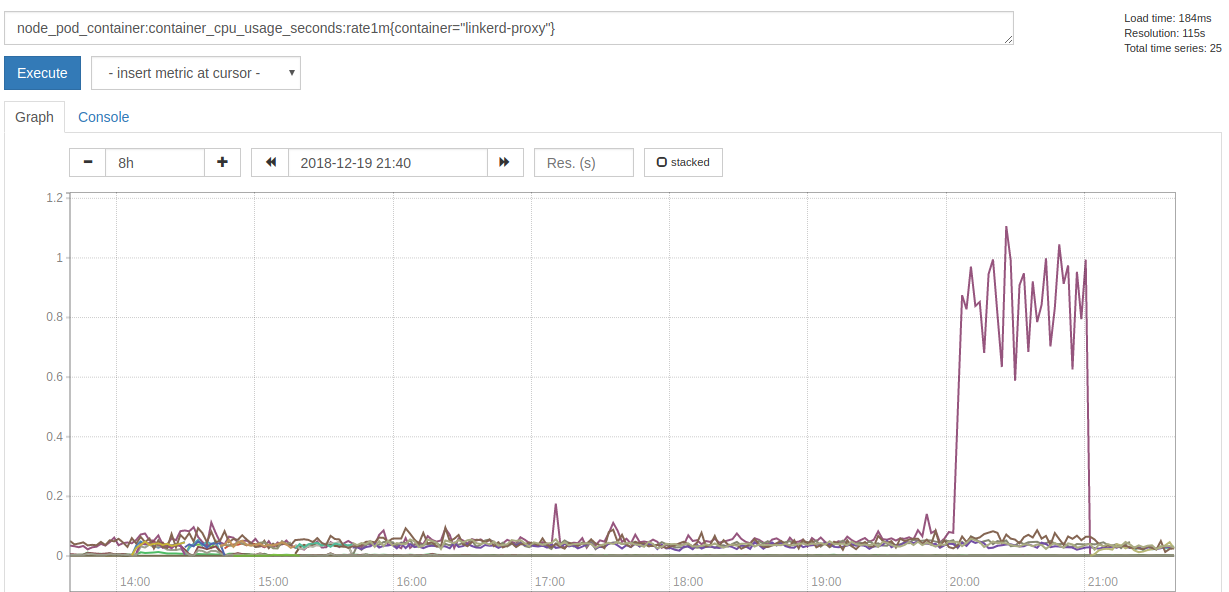
Since the failure happeneded yesterday night, we just restarted the Pods and did not have time to collect more data and investigate further. I will collect more data, if we see a growing memory consumption again, so hints where to look at would be appreciated.
How can it be reproduced?
Unfortunately I do not know.
linkerd check output
% linkerd check
kubernetes-api: can initialize the client..................................[ok]
kubernetes-api: can query the Kubernetes API...............................[ok]
kubernetes-api: is running the minimum Kubernetes API version..............[ok]
linkerd-api: control plane namespace exists................................[ok]
linkerd-api: control plane pods are ready..................................[ok]
linkerd-api: can initialize the client.....................................[ok]
linkerd-api: can query the control plane API...............................[ok]
linkerd-api[kubernetes]: control plane can talk to Kubernetes..............[ok]
linkerd-api[prometheus]: control plane can talk to Prometheus..............[ok]
linkerd-api: no invalid service profiles...................................[ok]
linkerd-version: can determine the latest version..........................[ok]
linkerd-version: cli is up-to-date.........................................[ok]
linkerd-version: control plane is up-to-date...............................[ok]

Status check results are [ok]
Environment
- Kubernetes Version:
v1.11.5 - Cluster Environment: Built from scratch on AWS.
- Host OS:
CoreOS - Linkerd version:
2.1.0-stable
Possible solution
- restart the Pod manually
Additional context
- We only injected Linkerd into two services, yet.
- We added Linkerd yesterday morning to our production system.
- There was another proxy that kept allocation memory
- We preemtively recreated the Pod, because it was late.
- It was a different deployment, written in a different language.
- Affecected services get around 10 requests per minute.
 svenwltr
All 19 comments
There just appeared another pod with this problem. The proxy logs a lot of these messages:
INFO proxy={server=out listen=127.0.0.1:4140 remote=10.10.17.193:56668} linkerd2_proxy::proxy::tcp forward duplex error: Transport endpoint is not connected (os error 107)
Also I noticed that the proxy hogs file descriptors (which explains the could not get next random port error message):
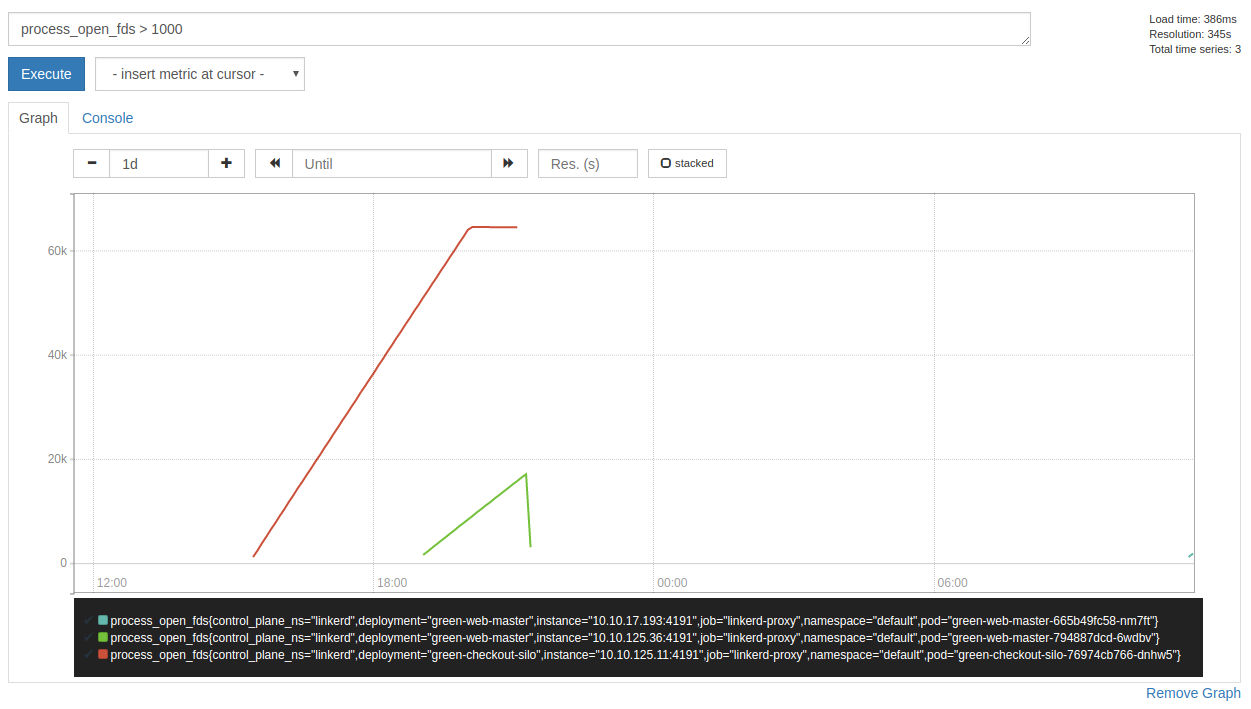
svenwltr
on 20 Dec 2018
Great find @svenwltr! Are you able to share the injected proxy manifest? E.g
get -o yaml deploy green-checkout-silo
Also, can you describe the traffic going through these pods? (http1? grpc? opaque tcp? short-lived connections? etc...)
 olix0r
on 20 Dec 2018
olix0r
on 20 Dec 2018
Hello @olix0r,
here is the applied manifest: https://gist.github.com/svenwltr/9c6a84af752d12a2482ccbc85820c732
About our traffic:
- We have inbound HTTP/1.1 requests, which are short-lived, because they come from PHP.
- We have outbound HTTP/1.1 requests and a few HTTPS requests.
- Opaque TCP traffic for logging.
- Database connections (MySQL).
svenwltr
on 20 Dec 2018
I have yet another update. Another pod failed and I had time to investigate a bit more.
It looks like UDP traffic is causing this problem. After thinking about it, we have two possible sources for this: DNS and Jaeger.
The output of lsof -p 3974 (3974 is the PID of linkerd-proxy) indicated that UDP is hogging sockets:
# tail lsof.stdout
linkerd2- 3974     2102 *422u     sock    0,9      0t0 98170052 protocol: UDP
linkerd2- 3974     2102 *423u     sock    0,9      0t0 98169320 protocol: UDP
linkerd2- 3974     2102 *424u     sock    0,9      0t0 98169321 protocol: UDP
linkerd2- 3974     2102 *425u     sock    0,9      0t0 98167590 protocol: UDP
linkerd2- 3974     2102 *426u     sock    0,9      0t0 98180098 protocol: UDP
linkerd2- 3974     2102 *427u     sock    0,9      0t0 98179148 protocol: UDP
linkerd2- 3974     2102 *428u     sock    0,9      0t0 98179149 protocol: UDP
linkerd2- 3974     2102 *429u     sock    0,9      0t0 98176585 protocol: TCP
linkerd2- 3974     2102 *430u     sock    0,9      0t0 98169461 protocol: TCP
linkerd2- 3974     2102 *432u     sock    0,9      0t0 98178158 protocol: TCP

# cat lsof.stdout | ack 'protocol: UDP' | wc -l
22266

# cat lsof.stdout | ack -v 'protocol: UDP' | wc -l
177
Also /proc indicates the same:
# wc -l /proc/3974/net/udp
29278 /proc/3974/net/udp
Unfortunately my Linux-fu left me and I could not figure out where these sockets are pointing to.
I still tried to get an idea what is causing these sockets, so I did a 10s sample of strace:
# (timeout 10 strace -p 3974 -e trace=network -f 2>&1 || true) | grep 'htons([[:digit:]]*)' -o | sort | uniq -c | grep -v '1 htons'
      2 htons(4140)
     14 htons(4143)
      2 htons(443)
     59 htons(53)
But I am not sure if this helps, since `htons' could be used at many places. For comparison: the proxy created around 200 new socket per minute:
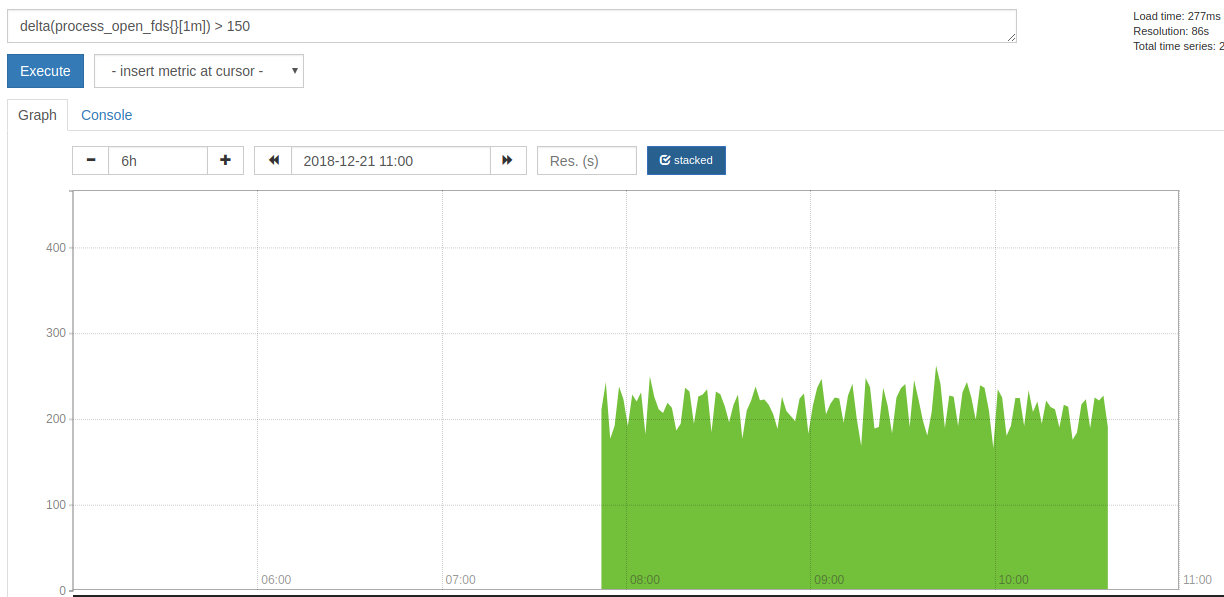
After that I had to recreate the Pod, since it started to make problems.
svenwltr
on 21 Dec 2018
Hmm, it's interesting to see that this is being observed with Linkerd 2.1, since a very similar issue (#1950) where a failure to complete DNS resolutions caused a leak in open UDP sockets was fixed in that release (by linkerd/linkerd2-proxy#146). I wonder if there's some case that fix failed to cover?
 hawkw
on 21 Dec 2018
hawkw
on 21 Dec 2018
They indeed look very similar. The only differences I see so far are:
- the file descriptors grow constantly
- although the graph I posted has a plateau at the end, which is caused by the Pod getting unready and as a result did not receive any traffic anymore
- that we have a lot more open file descriptors
Both differences are easily explainable due to different behaviours of the actual application. It looks like our Java application currently does not cache any DNS resolves.
Also it is not clear to me, when the grow of file descriptors started in #1950. In our system in took several hours until it started.
svenwltr
on 21 Dec 2018
Thanks @svenwltr for the additional information! I've been trying to reproduce this with the same test configuration I originally used for #1950. It's been running for a little over an hour and still seems pretty steady, but I'll keep an eye on it in case it starts trending upward eventually.
hawkw
on 21 Dec 2018
Hi
I seem to also be coming across this issue.
linkerd version: edge-18.12.3
kubernetes: 1.13.1
platform: AKS-Engine running on azure
these times are local time (utc+8) and we can see the memory usage starting to increase at 2:46am. It gets to the point where prometheus has trouble scraping the pod (healthchecks also start failing). This cluster is not live yet and no incoming requests being made.
I've run load tests against the pods and this does not seem to increase the memory usage.
I've also noticed the following in the logs around the time of the memory increase
2018-12-30T02:44:29.437 ERR! linkerd2_proxy::proxy::canonicalize failed to refine ocsp.int-x3.letsencrypt.org: deadline has elapsed
2018-12-30T02:44:32.438 WARN trust_dns_proto::xfer error notifying wait, possible future leak: Err(ProtoError { inner: requestor canceled })
2018-12-30T03:56:23.293 WARN trust_dns_proto::udp::udp_stream could not get next random port, delaying
looking at the node charts, the cpu usage was also pegged to 100% (all of the cpu load coming from this pod's namespace). It effectively crippled 3 out of 5 nodes in the cluster.
 jon-walton
on 31 Dec 2018
jon-walton
on 31 Dec 2018
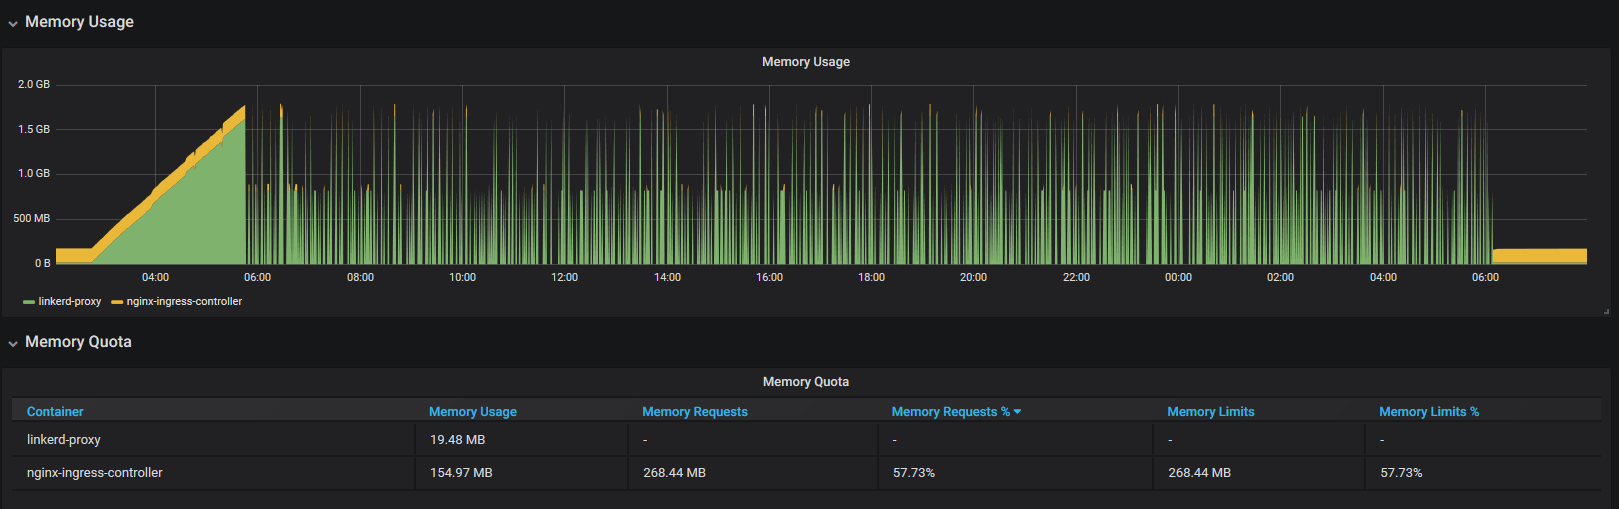
A quick update.
Setting the memory limits of the linkerd-proxy container allows kubernetes to kill the container before things get out of hand and the nginx-ingress-controller usually recovers.
it seems that the following log entries correlate with a 1-3mb increase in memory usage (monitored with kubectl top pods --containers however off the top of my head, i'm not sure how delayed those stats are)
WARN trust_dns_proto::xfer error notifying wait, possible future leak: Err(ProtoError { inner: requestor canceled })
ERR! linkerd2_proxy::proxy::canonicalize failed to refine cert.int-x3.letsencrypt.org: deadline has elapsed
ERR! linkerd2_proxy::proxy::canonicalize failed to refine cert.int-x3.letsencrypt.org: deadline has elapsed
ERR! linkerd2_proxy::proxy::canonicalize failed to refine cert.int-x3.letsencrypt.org: deadline has elapsed
WARN trust_dns_proto::xfer error notifying wait, possible future leak: Err(ProtoError { inner: requestor canceled })
ERR! linkerd2_proxy::proxy::canonicalize failed to refine cert.int-x3.letsencrypt.org: deadline has elapsed
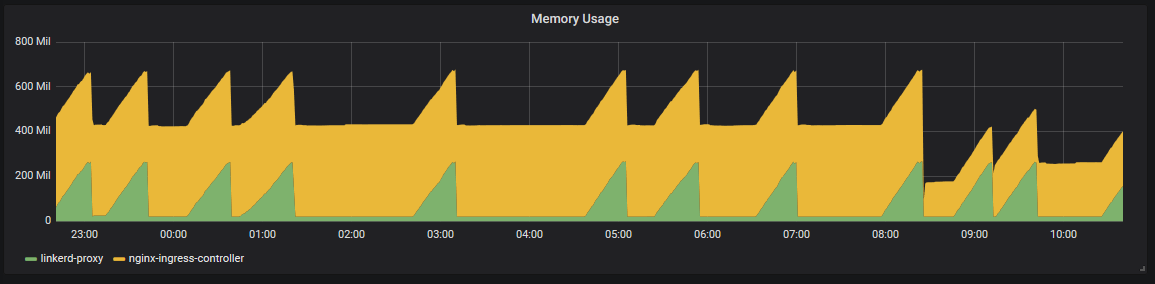
this graph is from an internal ingress (private subnet) and the only traffic is a probe to /live
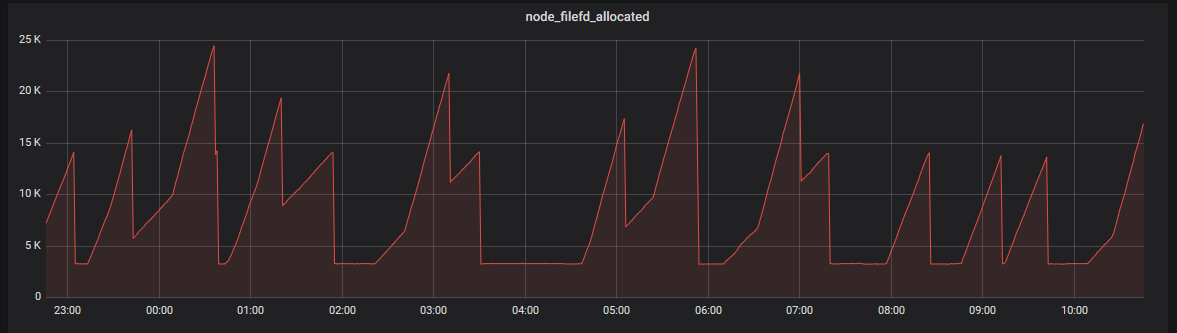
and the file descriptors for that node
jon-walton
on 2 Jan 2019
@jonwalton thanks for all the information, that's very helpful.
hawkw
on 2 Jan 2019
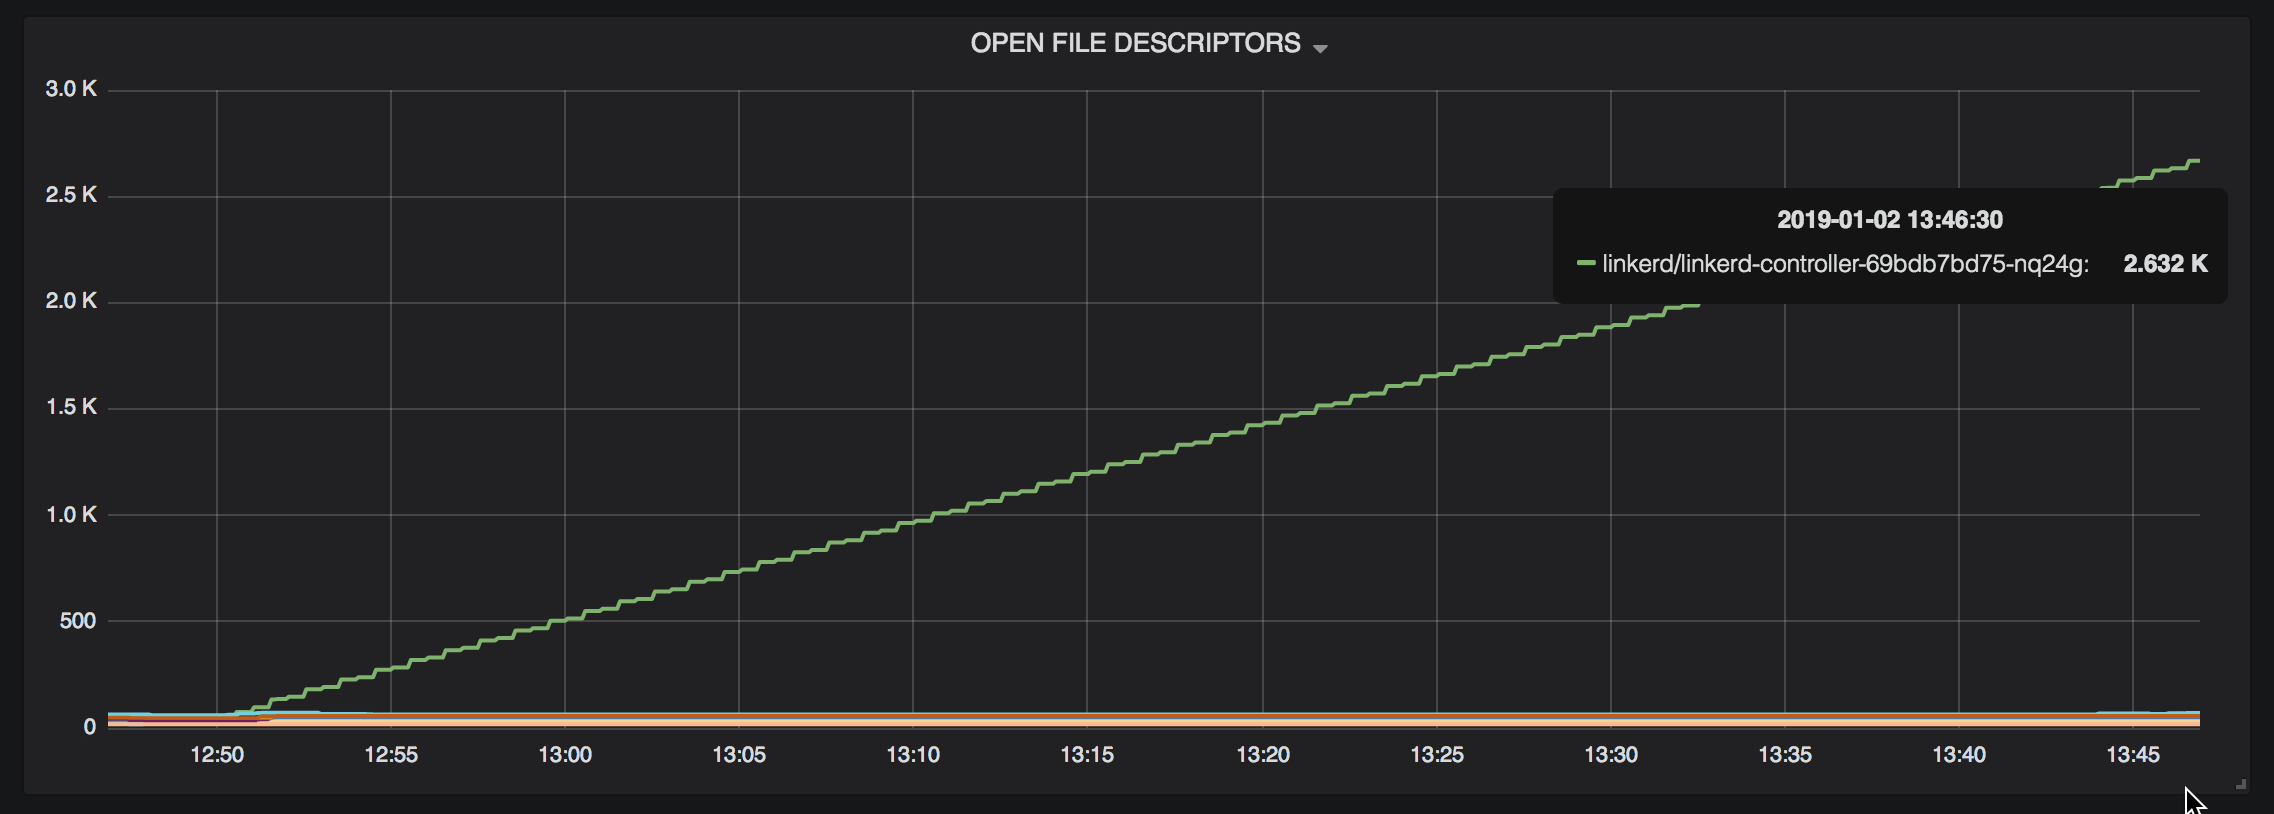
I'm able to reproduce this isse (or something very similar) by installing linkerd, kubectl execing into the linkerd-controller pod's proxy container, and using curl --resolve to cause a DNS query for a hostname that doesn't exist.
After an hour or so, fds and memory usage for that pod start increasing out of control:
hawkw
on 2 Jan 2019
Good news, everyone! It appears that this issue was likely caused by a bug in the library we use for resolving DNS names, and it's already been fixed upstream. I'm running some tests to determine whether updating to a patched version of that library fixes this issue.
@jon-walton and @svenwltr, if either of you (or anyone else) are interested in helping confirm the fix, I've published a shapshot Docker image SNAPSHOT-fix-dns-leak. You can use that tag by passing the flag -v SNAPSHOT-fix-dns-leak to the linkerd install and linkerd inject commands. Let me know what happens if you try the snapshot!
hawkw
on 5 Jan 2019
🎉
for a deployment with 2 pods. 1 proxy settled at 9Mi usage, the other at 11Mi usage. I'll let it run over night and report back (but after an hour, no increase in memory usage. Previously the pods would have gone into crashloop backoff by now)
good work 👍
jon-walton
on 5 Jan 2019
That's great to hear! Thanks for the update.
hawkw
on 5 Jan 2019
We deployed SNAPSHOT-fix-dns-leak 24h ago and so far there is no issue.
svenwltr
on 8 Jan 2019
@svenwltr That's great! The fix should make it into the next edge release, unless anything unexpected comes up.
hawkw
on 8 Jan 2019
Just wanted to let you all know that we've merged linkerd/linkerd2-proxy#169, and I'll make sure this change is in tomorrow's edge release!
hawkw
on 10 Jan 2019
Any ideas on when this might make it into stable?
 zknill
on 21 Jan 2019
zknill
on 21 Jan 2019
@zknill We're targeting the next stable release for early February.
 klingerf
on 22 Jan 2019
klingerf
on 22 Jan 2019
Related issues
 skalinets
·
3Comments
skalinets
·
3Comments
 vikas027
·
4Comments
vikas027
·
4Comments
 zaharidichev
·
4Comments
zaharidichev
·
4Comments
 miklezzzz
·
3Comments
miklezzzz
·
3Comments
 briansmith
·
4Comments
briansmith
·
4Comments
Most helpful comment
Just wanted to let you all know that we've merged linkerd/linkerd2-proxy#169, and I'll make sure this change is in tomorrow's edge release!