Lighthouse: LCP differs wildly between Lighthouse report and its own performance trace / user reality
Provide the steps to reproduce
- Run LH on https://staging.flowkey.com/en
What is the current behavior?
Lighthouse reports LCP of SSR'd Gatsby site at ~4.0-6.0s
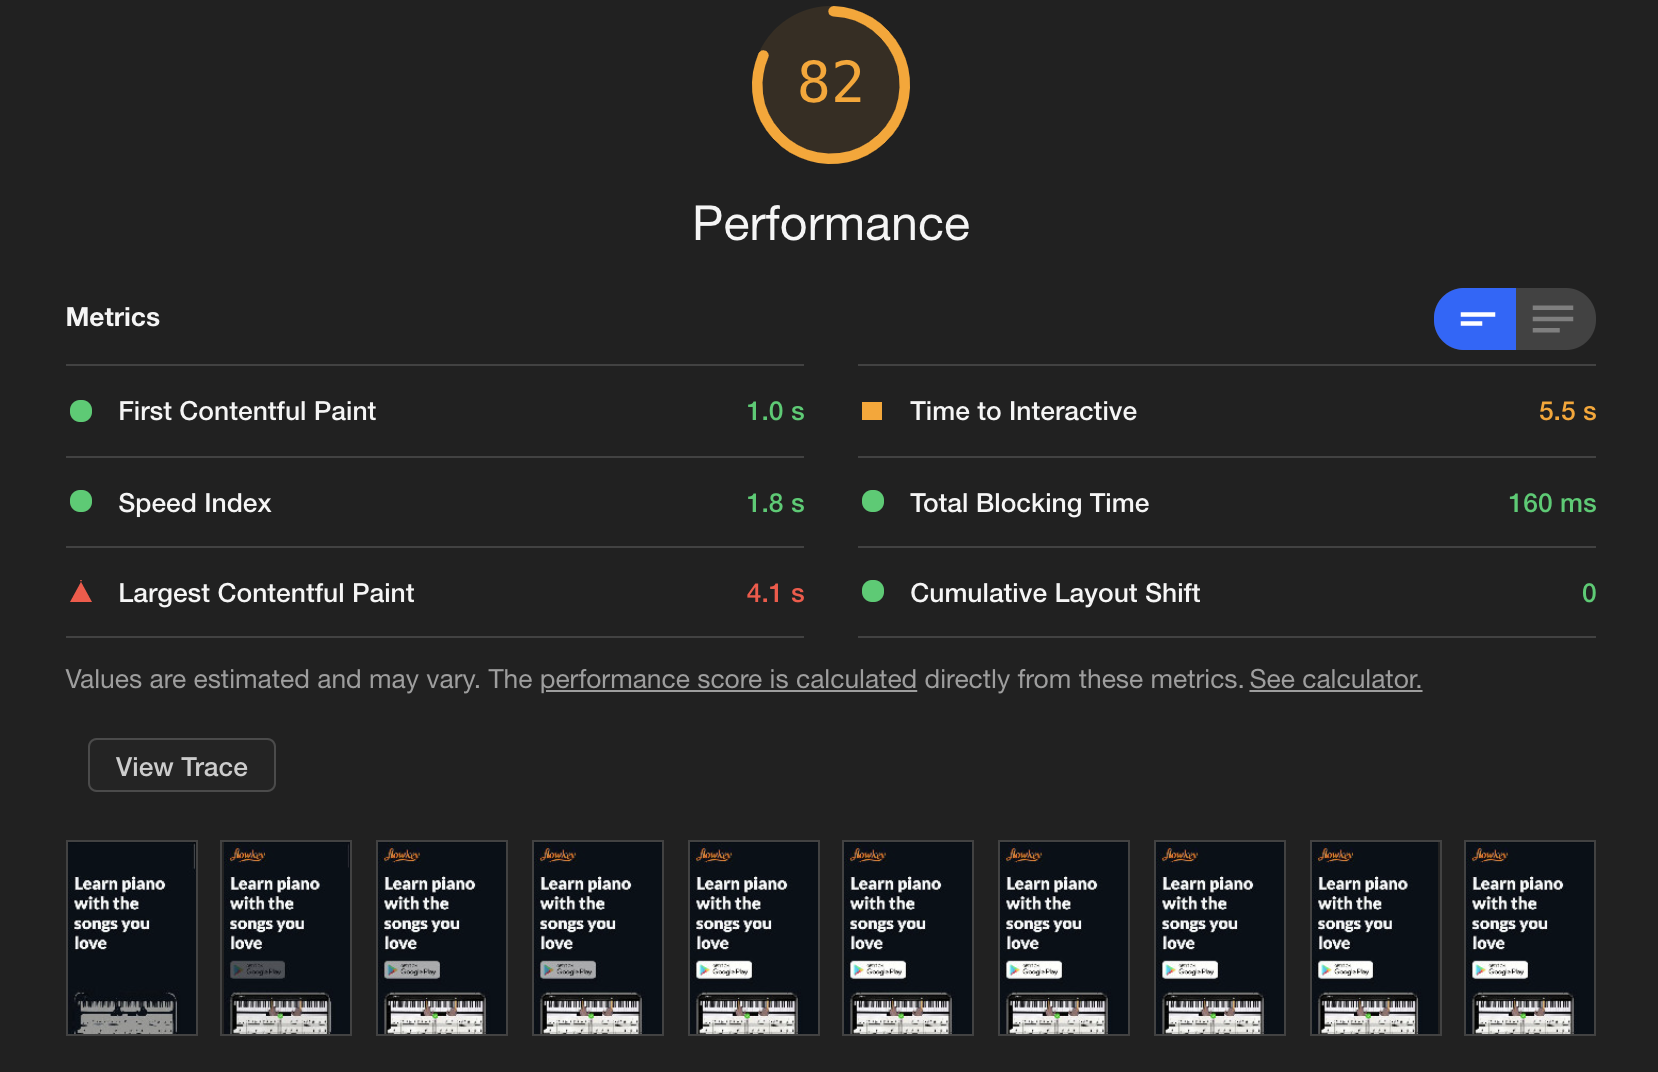
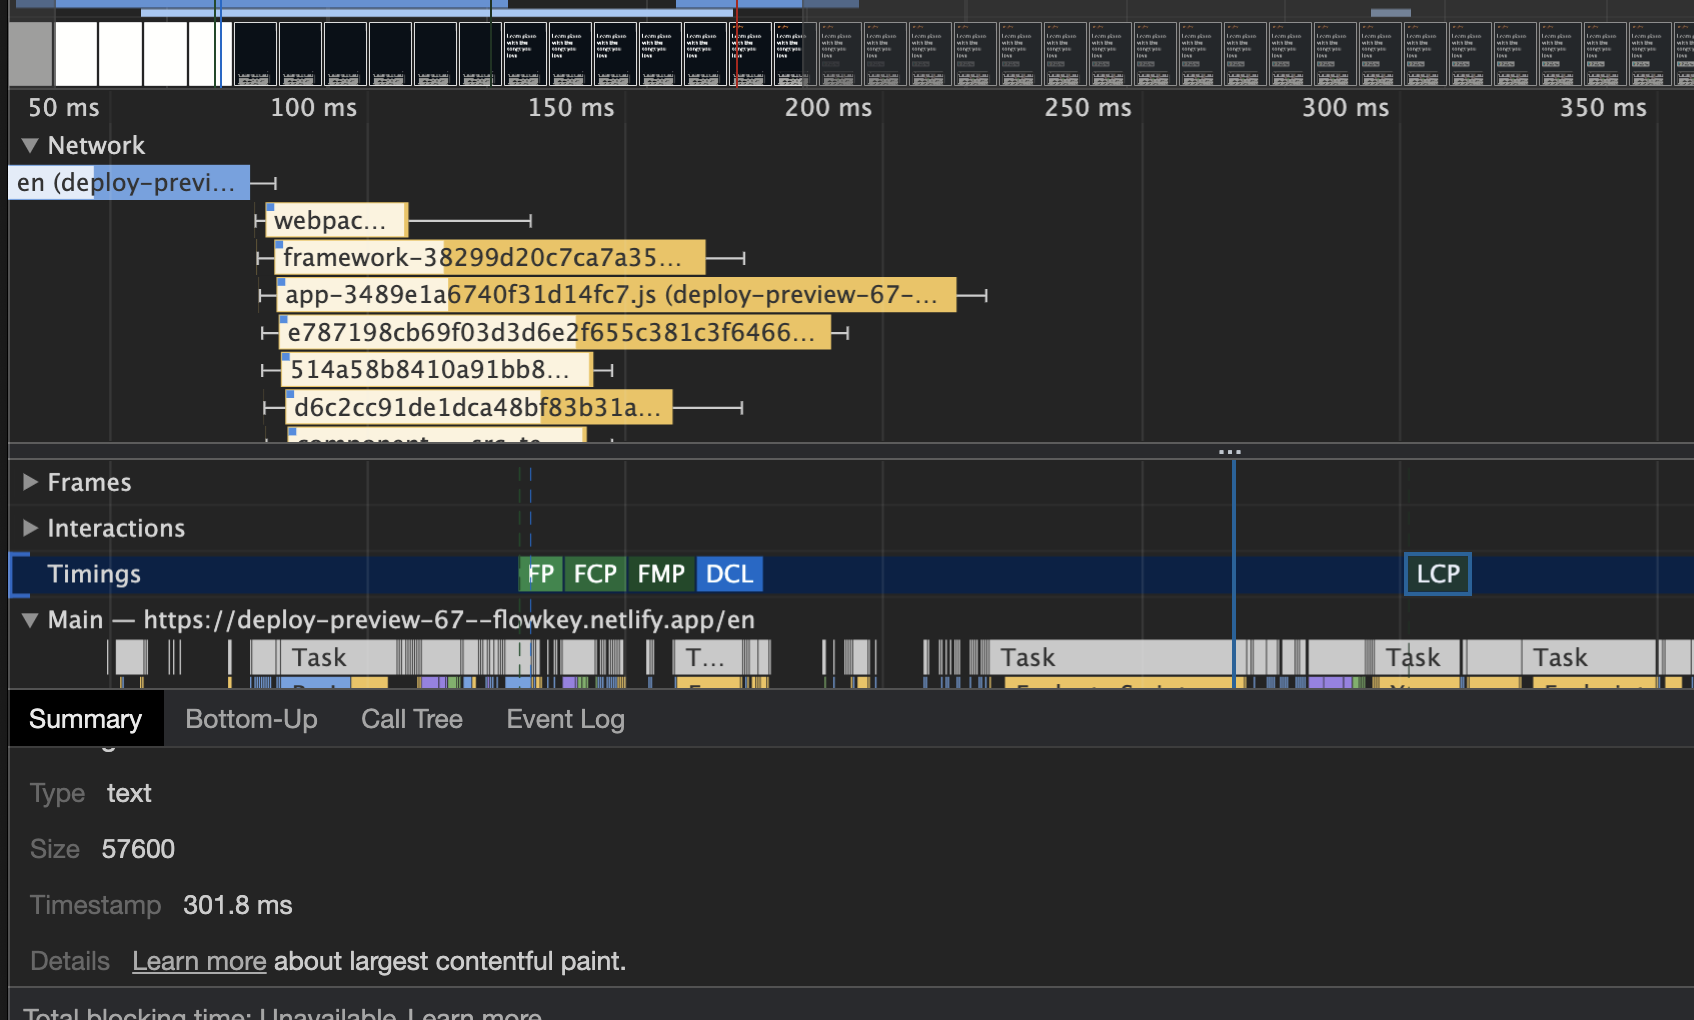
whereas its own Performance trace (viewed by clicking "View trace") shows LCP at ~300ms (which matches the actual user experience)
What is the expected behavior?
Lighthouse should report the real LCP as experienced by the user. It is possible that Lighthouse is picking up on Gatsby's post-hoc rehydration of the page in React, but this is totally transparent to the user and not noticeable on the device (the user experiences the 300ms LCP and nothing else)
Environment Information
- Affected Channels: DevTools in Chrome 84, PageSpeed insights at https://developers.google.com/speed/pagespeed/insights/?url=https%3A%2F%2Fdeploy-preview-67--flowkey.netlify.app%2Fen, CLI
- Lighthouse version: 6.0.0: Chrome, 6.1.0: PageSpeed Insights, 6.2.0: CLI
- Chrome version: 84.0.4147.125 (Official Build) (64-bit)
- Node.js version: v12.18.0
- Operating System: Mac OS 11.0 Beta (but probably not relevant, because the PageSpeed Insights gives the same results)
Related issues
Time To Interactive reading also seems bogus
 ephemer
All 8 comments
Are you running with simulated throttling on?
This is expected when you run Lighthouse with simulated throttling. Lighthouse takes the trace from a normal page load and uses it to simulate the performance metrics with throttling.
Related: https://github.com/GoogleChrome/lighthouse/issues/9971
 adamraine
on 17 Aug 2020
adamraine
on 17 Aug 2020
@ephemer Apart from the timeline display, your LCP element is a text node and i think you have a syntax error in your font-display value. font-display: 'swap'; should actually be font-display: swap; in my opinion. Right now your text is displayed after the fonts got loaded and the fallback font does not seem to work properly
 LukasAuerMstage
on 17 Aug 2020
LukasAuerMstage
on 17 Aug 2020
@adamraine I'm running the mobile Lighthouse, which does simulated throttling. I figured it must be something along these lines, but I was surprised that 4x throttling causes 10x slower LCP. I guess that's how it is.
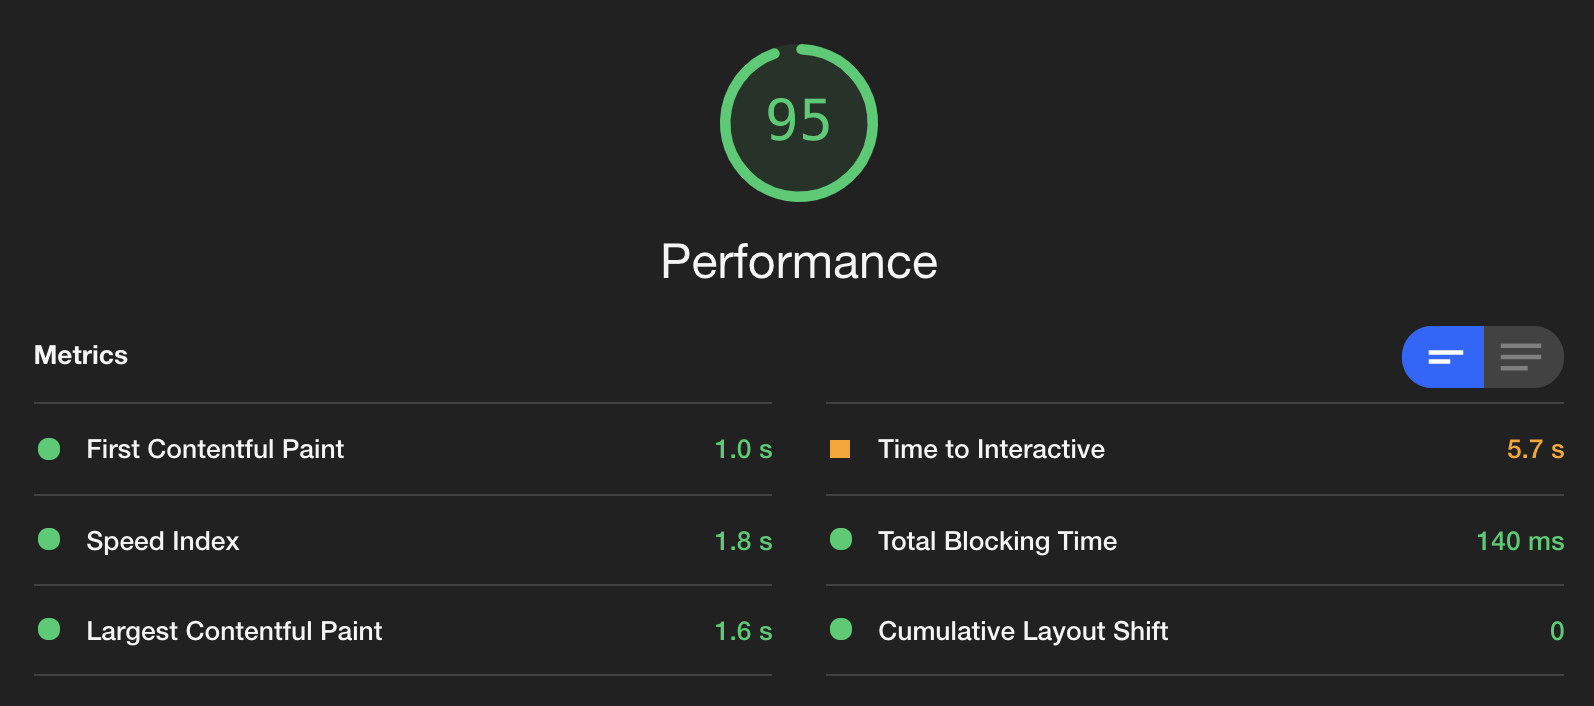
@LukasAuerMstage thanks for the tip here, I added font-display: fallback; and it's looking much better now:
Does anyone have tips on reducing TTI? I tried all sorts of things yesterday and don't see why the value is so high (again, only on mobile)
ephemer
on 18 Aug 2020
@ephemer regarding TTI, your javascript produces long tasks which i would assume boil down to some kind of gatsby specific hydration process. these tasks hurt your TTI score so if you want to improve your score you have to address them in some way. (see https://web.dev/tti/) unfortunately this is kind of gatsby specific and i dont have enough insights on the possibilities in this environment but i would generally assume that this requires more decisive changes to your site. still if you are comfortable with refactoring large parts of your javascript you could take a look at the "idle until urgent" pattern, which, in a nutshell, will break up these tasks into smaller chunks of execution if applied correctly (https://philipwalton.com/articles/idle-until-urgent/). Other than that, if reducing your js entirely is possible then thats the first starting point.
LukasAuerMstage
on 18 Aug 2020
@LukasAuerMstage https://web.dev/tti/ is extremely helpful, thank you (FYI: Lighthouse itself links me to https://web.dev/interactive, which is _much_ less helpful).
I think the missing piece for me is the lack of insight into where Lighthouse is getting these metrics from. If I use the Performance tab in the Chrome Dev Tools, I can choose 4x CPU slowdown, and I have set up a custom Network slowdown setting 1638.4kb Download/Upload with 150ms latency (Lighthouse just reports 150 ms TCP RTT, 1,638.4 Kbps throughput (Simulated) and I'm not sure this is the same, especially the "throughput". Is that an accurate picture? If so, I can optimise from here, thanks again!
ephemer
on 18 Aug 2020
A Lighthouse run with simulated throttling will estimate performance metrics as if there was 150 ms RTT and 1,638.4 Kbps throughput but this is not exactly the same as computing a throttled Performance trace with 150 ms latency and 1638.4 Kbps Upload/Download. If you want your Lighthouse metrics to match the performance trace under "View Trace", you can disable simulated throttling in Lighthouse settings. This will actively throttle the page load when you run Lighthouse.
Your note about https://web.dev/tti/ being more helpful than https://web.dev/interactive might be a good issue to look into here.
adamraine
on 18 Aug 2020
@adamraine thanks, I didn't see the Lighthouse settings in there! Will also experiment with that.
ephemer
on 18 Aug 2020
@ephemer good news that we just landed a change to help explain what the perf trace is. https://github.com/GoogleChrome/lighthouse/issues/9971
@paulirish to propose a merge of the metrics docs.
 paulirish
on 18 Aug 2020
paulirish
on 18 Aug 2020
Related issues
 shellscape
·
3Comments
shellscape
·
3Comments
 codepodu
·
3Comments
codepodu
·
3Comments
 workjalexanderfox
·
3Comments
workjalexanderfox
·
3Comments
 muuvmuuv
·
3Comments
muuvmuuv
·
3Comments
 wizardnet972
·
3Comments
wizardnet972
·
3Comments
Most helpful comment
Are you running with simulated throttling on?
This is expected when you run Lighthouse with simulated throttling. Lighthouse takes the trace from a normal page load and uses it to simulate the performance metrics with throttling.
Related: https://github.com/GoogleChrome/lighthouse/issues/9971