Lighthouse: Quantify the score changes expected for v5 to v6.
Hard to do for everyone, but I think it'll be useful to look into some examples that are doing well, some doing ok, some doing bad and evaluate where they'll be with the v6 calculation.
ref #9949
 paulirish
All 6 comments
Quick analysis on the February 2020 HTTP Archive run.
There's no CLS data in those LHRs (and I couldn't figure out how _chromeUserTiming.layoutShift translates), so I assigned every site a 50 CLS score. Since v6 only gives CLS a max 5 point contribution to the final point score, that means all the v6 numbers have an additional ±2.5 uncertainty not accounted for in the following analysis
| | v5 | v6 | Change |
| --- | --- | --- | --- |
| p10 | 6.4 | 13.2 | +6.8 (95% CI [6.8, 6.8]) |
| p20 | 14.5 | 21.8 | +7.3 (95% CI [7.3, 7.3]) |
| p30 | 21.9 | 28.9 | +6.9 (95% CI [6.9, 7]) |
| p40 | 29.4 | 34.6 | +5.2 (95% CI [5.2, 5.3]) |
| p50 | 37.5 | 41.6 | +4.1 (95% CI [4.1, 4.1]) |
| p60 | 46.7 | 49.6 | +2.9 (95% CI [2.9, 3]) |
| p70 | 57.1 | 58.6 | +1.5 (95% CI [1.5, 1.5]) |
| p80 | 71.3 | 70.2 | -1.1 (95% CI [-1.2, -1.1]) |
| p90 | 89.5 | 85.8 | -3.8 (95% CI [-3.8, -3.7]) |
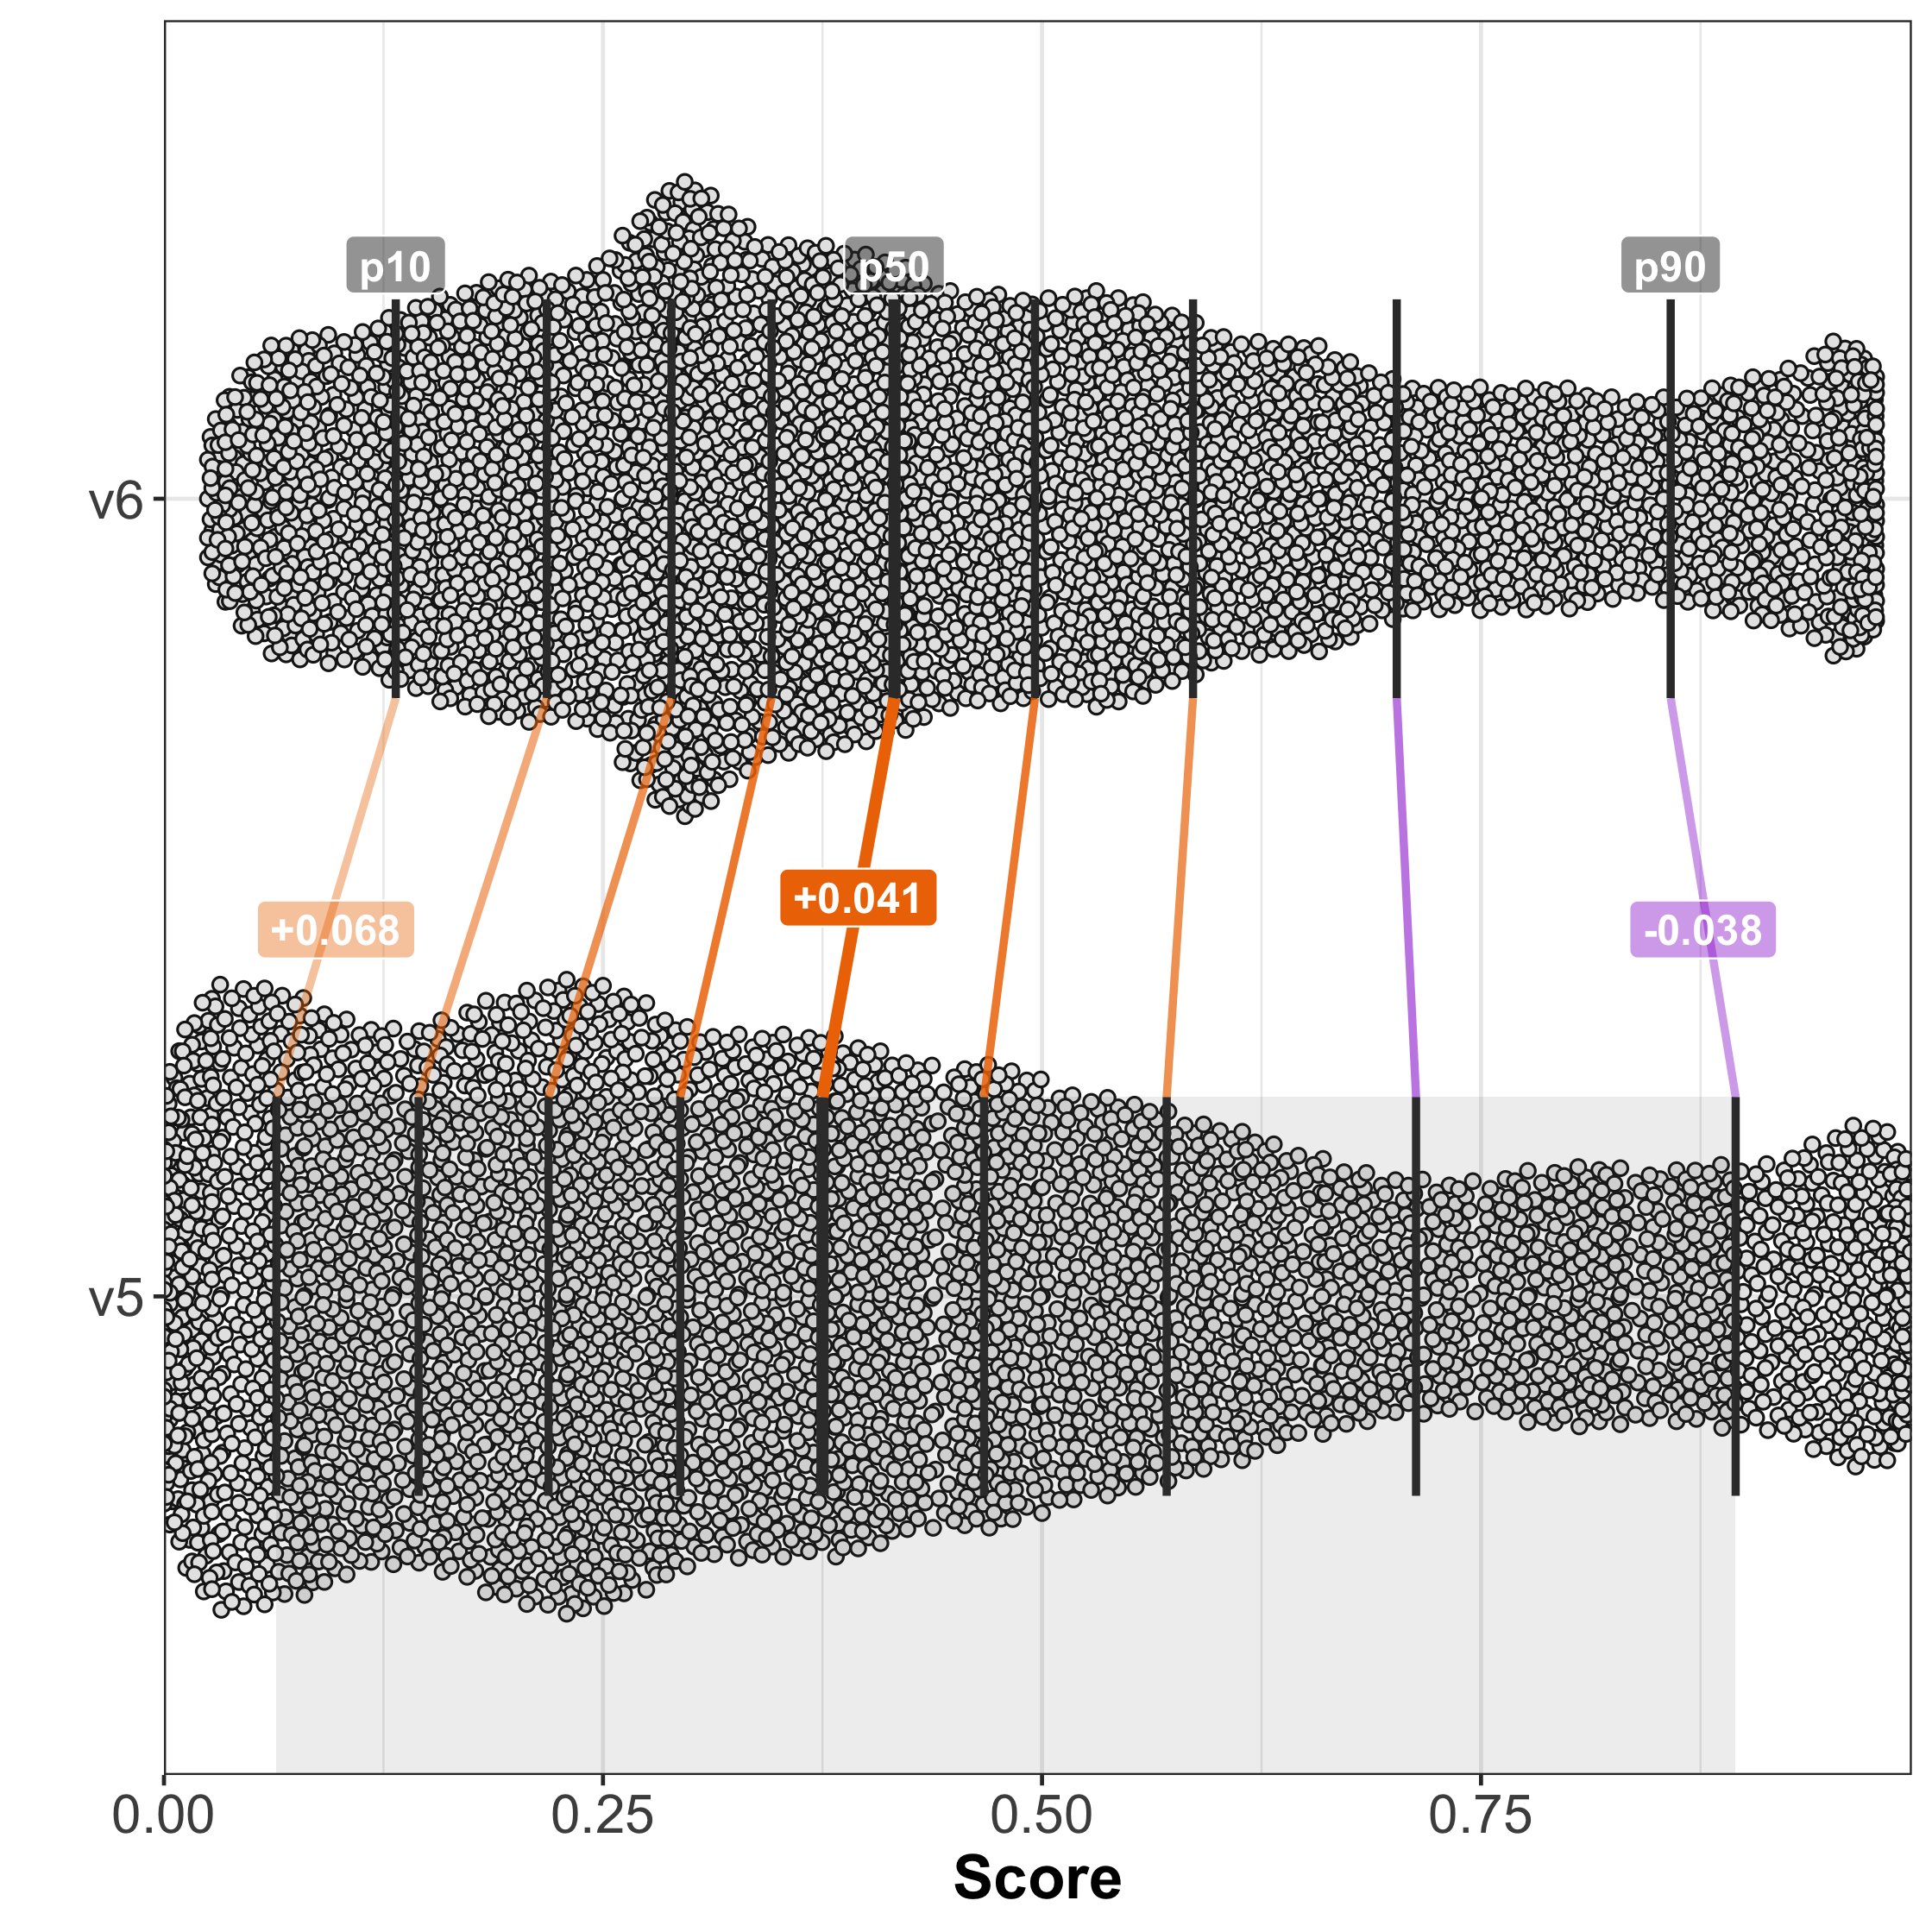
This is changes for percentiles of the entire population, not individual sites. Some sites could have significant changes in scores that wouldn't be clear in this view, but it's clear that overall things stay pretty stable and reasonable (the p80 and p90 drop in score is more concerning, but sites on that end are more likely to have a good CLS score, so p90 may be closer to -1.3).
 brendankenny
on 11 Mar 2020
brendankenny
on 11 Mar 2020
(those distributions look reversed, though the numbers are right. Corrected. The missing top and bottom 2.5 points (due to assuming CLS) is clear now)
brendankenny
on 11 Mar 2020
Hey! I've been trying around the V6 beta (6.0.0-beta.0) and there's one example of quite a strong reversion (where a p95 top performing site, with solid almost-perfect scores of 99-100 on Mobile on PSI, starts ranking on mid 50s consistently) .
You can test https://store.gatsbyjs.org/ using PSI or using the CLI lighthouse@latest and you'd get (with the usual variance) a Mobile Score of 90-100 very likely. Running through the CLI using lighthouse@next I'm locally getting 56-58 consistently.
(Please let me know if I shouldn't send explicit URLs here and I'll edit the message)
 juanferreras
on 7 Apr 2020
juanferreras
on 7 Apr 2020
I'm seeing ~83-88 for https://store.gatsbyjs.org in v6 @juanferreras . What metric values are you seeing? Do you have any sample traces from the CLI (files generated by --save-assets)?
Also note that just because there are global trends that say p95 moves by -4pts doesn't mean there won't be examples that move much more drastically. Sites that perform poorly on LCP and CLS but do well on the other metrics should see expected and intentional declines in the performance score.
FWIW there's also been more analysis on specific smaller set of URLs to get a sense for the range of expected outcomes for previously high performing sites.
 patrickhulce
on 8 Apr 2020
patrickhulce
on 8 Apr 2020
@patrickhulce Thanks for your response!
Of course, my comment was mainly to add what-seemed-to-be the most extreme edge case I could find – just to see if that helped @paulirish – by no means it should be read as _this is a bug or incorrect behaviour_ at all! Sorry if that's not how it came up.
I think judging from the value you're getting this could be safely ignored and it's possibly related to variance (on any of the well-documented factors).
That being said, I'm attaching report + trace + devtools in case it helps. I'm getting the final performance score in the range of ~60-65, running lighthouse https://store.gatsbyjs.org --output=json --output-path=./report.json --save-assets, with [email protected].
juanferreras
on 8 Apr 2020
Ah gotcha thanks very much for the extra data @juanferreras! We'll dig in :)
patrickhulce
on 8 Apr 2020
Related issues
 mjara74
·
3Comments
mjara74
·
3Comments
 asistapl
·
3Comments
asistapl
·
3Comments
 shellscape
·
3Comments
shellscape
·
3Comments
 bitttttten
·
3Comments
bitttttten
·
3Comments
 muuvmuuv
·
3Comments
muuvmuuv
·
3Comments
Most helpful comment
Quick analysis on the February 2020 HTTP Archive run.
There's no CLS data in those LHRs (and I couldn't figure out how
_chromeUserTiming.layoutShifttranslates), so I assigned every site a 50 CLS score. Since v6 only gives CLS a max 5 point contribution to the final point score, that means all the v6 numbers have an additional ±2.5 uncertainty not accounted for in the following analysis| | v5 | v6 | Change |
| --- | --- | --- | --- |
| p10 | 6.4 | 13.2 | +6.8 (95% CI [6.8, 6.8]) |
| p20 | 14.5 | 21.8 | +7.3 (95% CI [7.3, 7.3]) |
| p30 | 21.9 | 28.9 | +6.9 (95% CI [6.9, 7]) |
| p40 | 29.4 | 34.6 | +5.2 (95% CI [5.2, 5.3]) |
| p50 | 37.5 | 41.6 | +4.1 (95% CI [4.1, 4.1]) |
| p60 | 46.7 | 49.6 | +2.9 (95% CI [2.9, 3]) |
| p70 | 57.1 | 58.6 | +1.5 (95% CI [1.5, 1.5]) |
| p80 | 71.3 | 70.2 | -1.1 (95% CI [-1.2, -1.1]) |
| p90 | 89.5 | 85.8 | -3.8 (95% CI [-3.8, -3.7]) |
This is changes for percentiles of the entire population, not individual sites. Some sites could have significant changes in scores that wouldn't be clear in this view, but it's clear that overall things stay pretty stable and reasonable (the p80 and p90 drop in score is more concerning, but sites on that end are more likely to have a good CLS score, so p90 may be closer to
-1.3).