Lighthouse: Warn that devtools performance trace will not match metrics
I'm getting very strange results when doing a mobile audit Simulated Slow 4G.
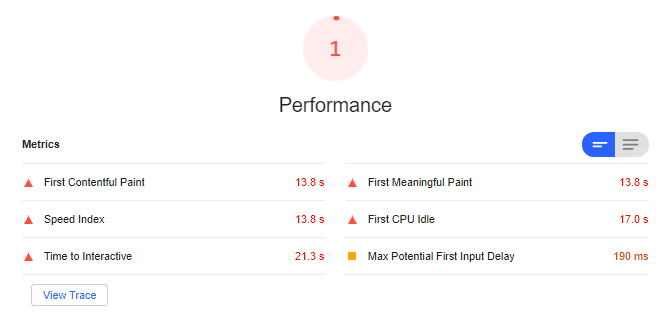
The report states the FCP is 13.8 seconds.
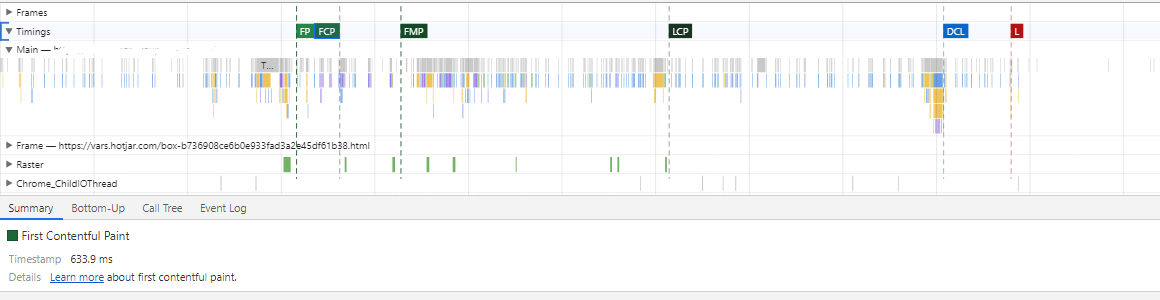
When I click the view trace to check the performance trace, the FCP is 633.9ms
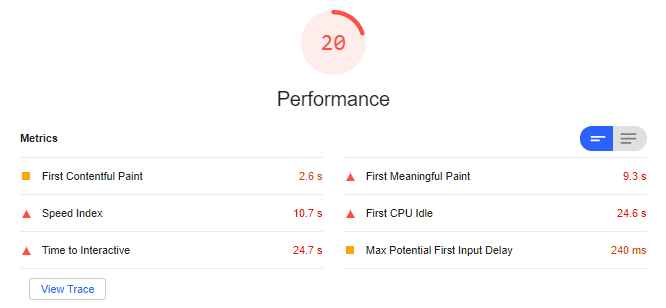
When running the Applied Slow 4G audit, the results are actually faster than the Simulated Slow 4G, but they perfectly match the Performance trace:
When running the audit without throttling, I get a performance score of 100 and the Performance trace values match the audit report.
I am getting the same result on Pagespeed Insights.
Could this be related to cache?
 delanotedries
All 11 comments
Do you have a public URL for us to reproduce?
I'm guessing that this page has a particularly large root document (MBs not KBs) which is #6867.
 patrickhulce
on 14 Nov 2019
patrickhulce
on 14 Nov 2019
Hi @patrickhulce
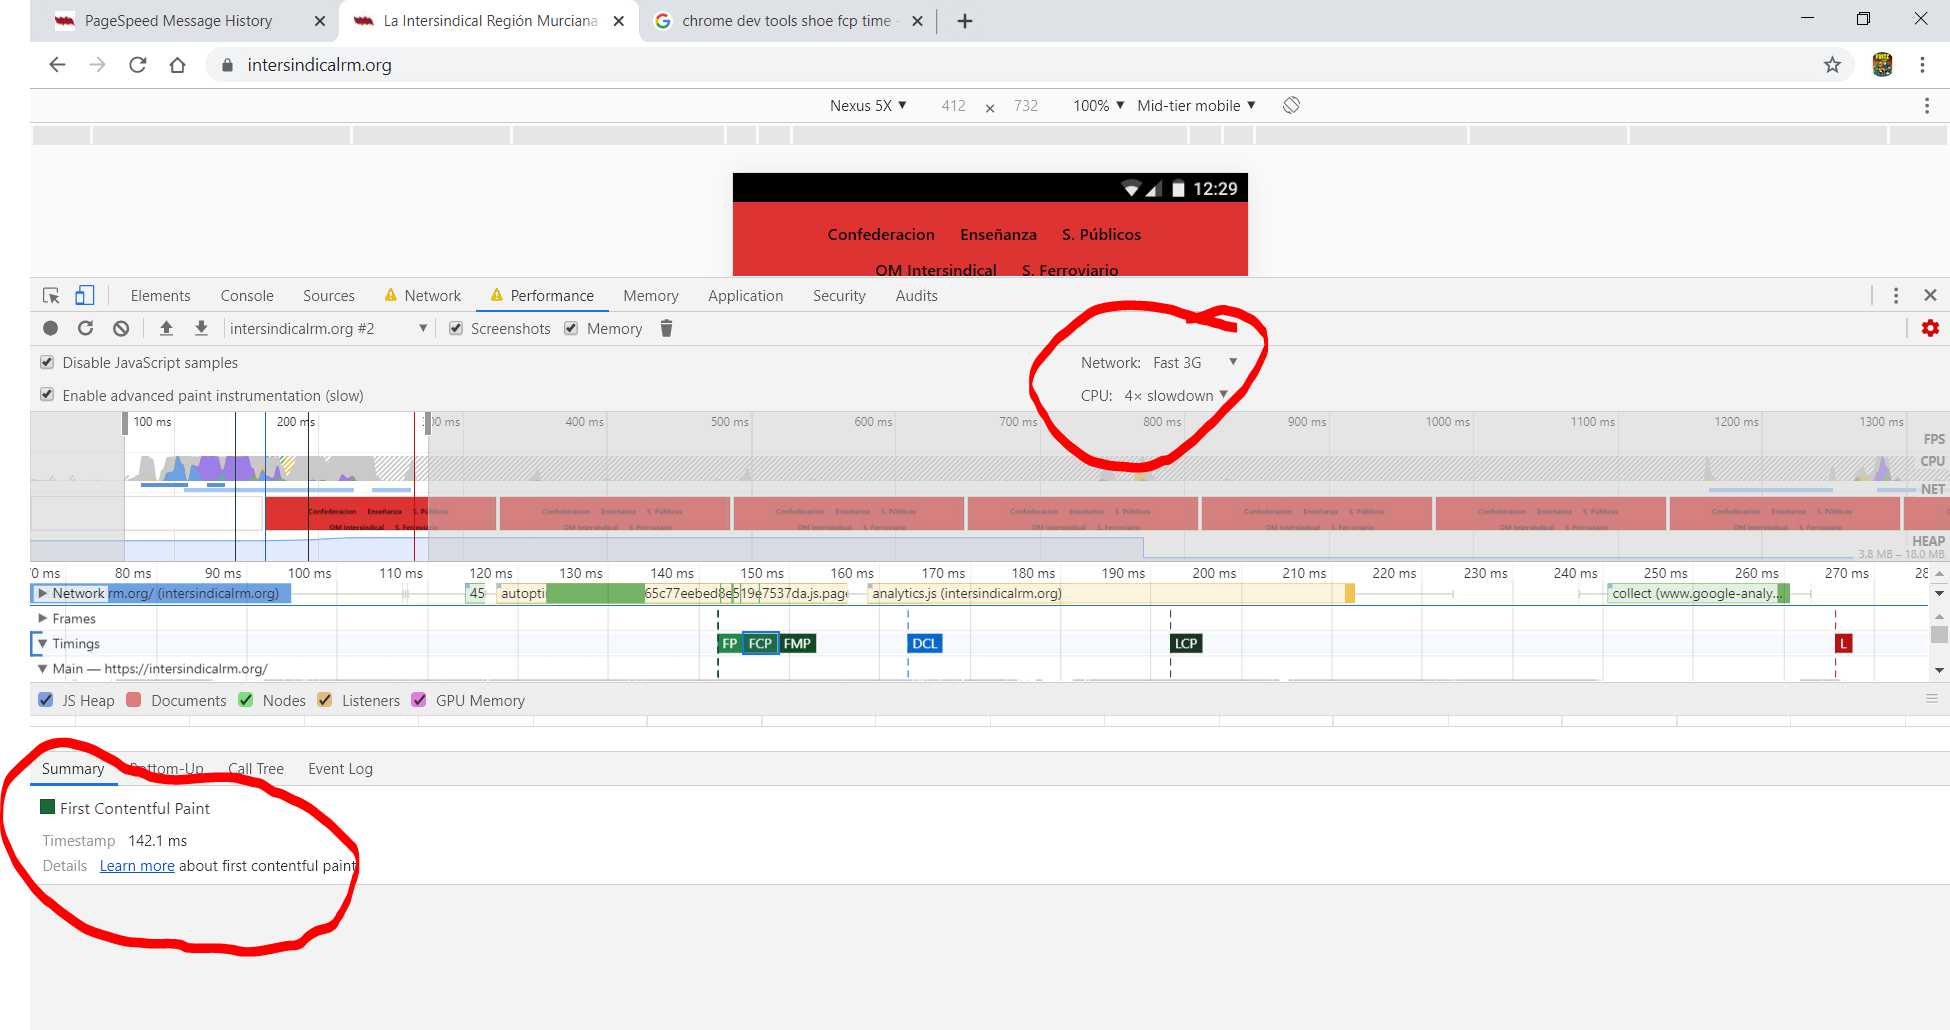
I can reproduce this. Chrome 78 LH 5.2 Simulated Slow 4G Performance set at the same options.
In LH I get FCP 1,7s , in Performance 142,1ms. I go to Performance clicking the "View Trace" button.
Seems that both are measuring differents things.
https://intersindicalrm.org/

 Lofesa
on 15 Nov 2019
Lofesa
on 15 Nov 2019
That FCP timestamp is physically impossible with those throttling settings and the trace looks unthrottled, Fast 3G applies a 500ms minimum HTTP RTT. Are you sure you loaded the page after changing the settings? This is what I see with those throttling settings on that URL. Subtract the unload handler time and the simulated Lighthouse result is nearly identical.
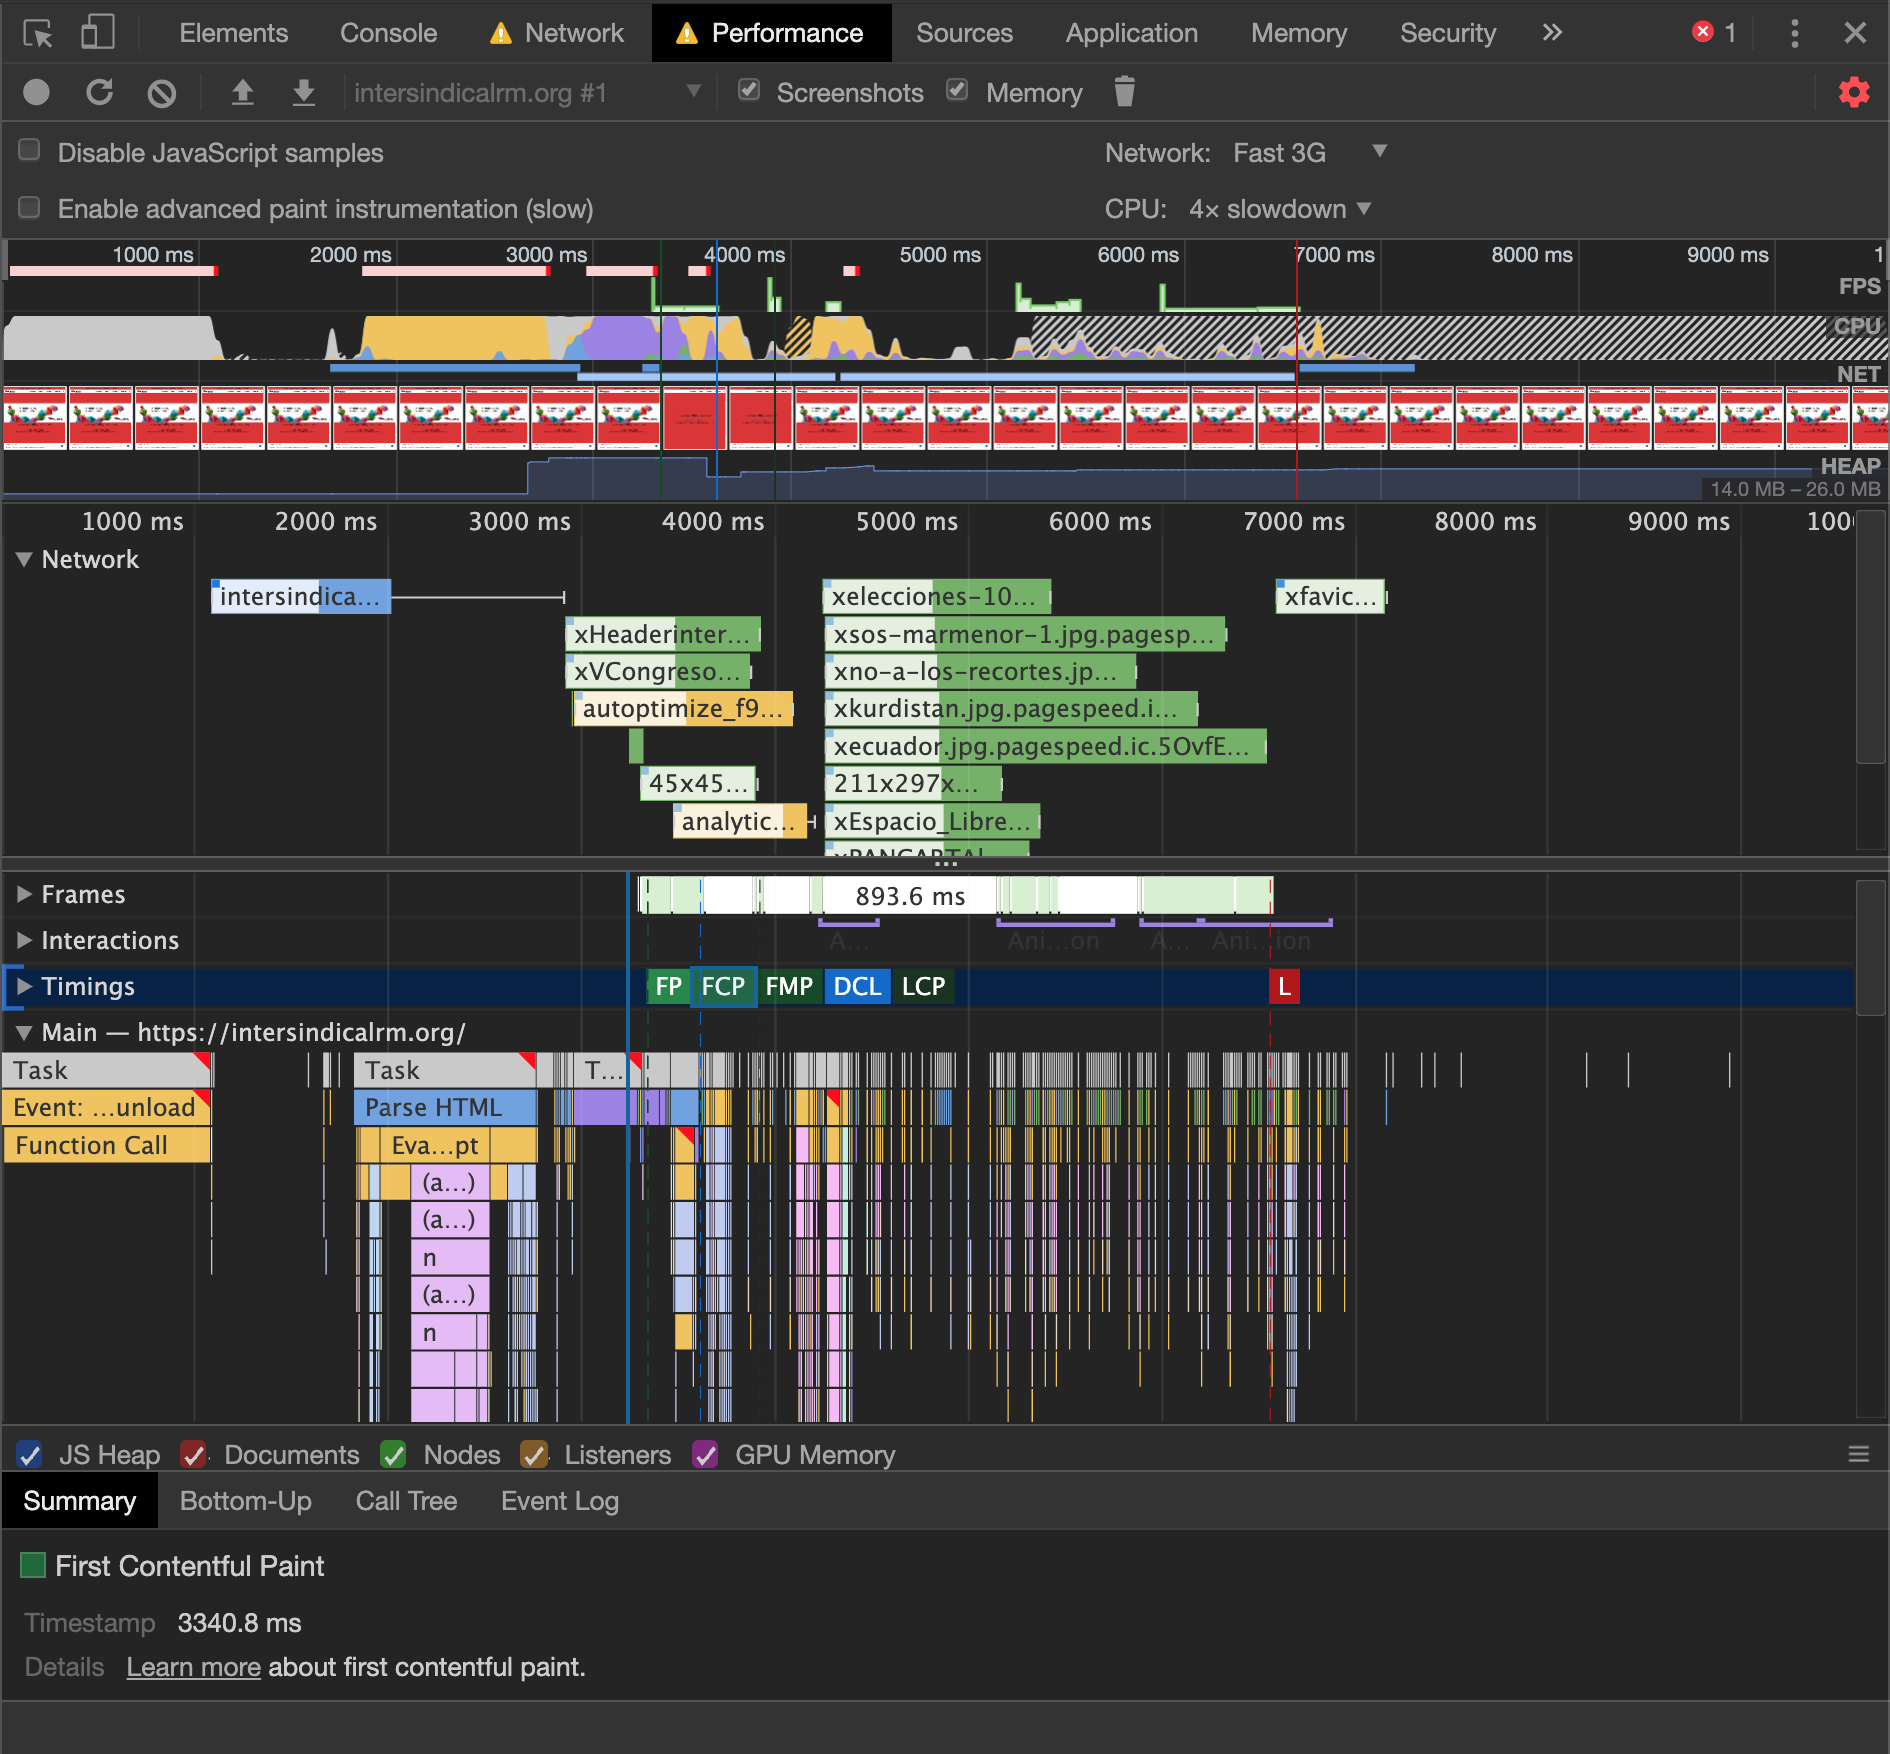
patrickhulce
on 15 Nov 2019
Hi @patrickhulce
The step I have done:
1.- Go to Dev Tool performance
2.- Set network and cpu throttling Fast 3G and 4x slowdown
3.- Go to Audits
4.- Set Simulated Slow 4G 4x Slowdown
5.- Run audits for mobile
6.- In Audit Performance, clik on View Trace button, this make go to Dev tools performance
7.- click on FCP label and show time on Summary.
If I clear the Dev Tools Performance w/o touch throttling and make a new record, with a lapse of 8s. the FCP is 2723.6 ms.
So seems that when you click on the View Trace in LH, Dev Tools Performance numbers are similar to when is not throttling.
EDIT: Some diff between your and me maybe the gdpr banner at bottom.
Lofesa
on 15 Nov 2019
So seems that when you click on the View Trace in LH, Dev Tools Performance numbers are similar to when is not throttling.
Correct when you run with simulated throttling we load the page without throttling and simulate what it would have been with throttling. This means that the "View Trace" button will show the unthrottled run.
EDIT: It's something we're aware isn't ideal and working on making it better :)
patrickhulce
on 15 Nov 2019
Hi @patrickhulce @delanotedries
Well... then the issue is clarified. Maybe a transient solution maybe a note near to the "view trace" button clarifying that the performance result are for unthrottled fecht.
Lofesa
on 17 Nov 2019
I'm guessing that this page has a particularly large root document (MBs not KBs) which is #6867.
@patrickhulce this was indeed the case, thx for clarifying.
I agree with @Lofesa that notifying the performance view trace is for an unthrottled fetch would be a good UI improvement for now.
delanotedries
on 22 Nov 2019
Plan: View Trace -> View Original Trace + a tooltip that says it's simulated and won't match, uncheck "Simulated throttling" if ya want em to match
patrickhulce
on 4 Aug 2020
Working on this over in https://chromium-review.googlesource.com/c/devtools/devtools-frontend/+/2339861
 adamraine
on 7 Aug 2020
adamraine
on 7 Aug 2020
 paulirish
on 18 Aug 2020
paulirish
on 18 Aug 2020
Should be in Chrome 86. Hits stable ~ Oct 6th.
paulirish
on 18 Aug 2020
Related issues
 devrsi0n
·
3Comments
devrsi0n
·
3Comments
 motiejuss
·
3Comments
motiejuss
·
3Comments
 etelai
·
3Comments
etelai
·
3Comments
 sanprieto
·
3Comments
sanprieto
·
3Comments
 Simply007
·
3Comments
Simply007
·
3Comments
Most helpful comment
Correct when you run with simulated throttling we load the page without throttling and simulate what it would have been with throttling. This means that the "View Trace" button will show the unthrottled run.
EDIT: It's something we're aware isn't ideal and working on making it better :)