Lighthouse: How to run performance audit
I'm trying to run performance audits using LH from js, in particularly 'network-requests'/'network-rtt'/'network-server-latency'.
I tried the following LH config:
var config = {
  settings: {
    output: 'json',
    maxWaitForFcp: 15 * 1000,
    maxWaitForLoad: 45 * 1000,
    throttlingMethod: 'provided',
    throttling: {},
    auditMode: false,
    gatherMode: false,
    disableStorageReset: false,
    emulatedFormFactor: 'none',
    channel: 'node',
  },
  passes: [{
    recordTrace: true,
    useThrottling: false,
    pauseAfterLoadMs: 1000,
    networkQuietThresholdMs: 1000,
    cpuQuietThresholdMs: 1000,
    gatherers: [
      'accessibility',
      'css-usage',
      'viewport-dimensions',
      'runtime-exceptions',
      'console-messages',
      'anchor-elements',
      'image-elements',
      'link-elements',
      'meta-elements',
      'script-elements',
      'js-usage',
      'cache-contents',
      'anchor-elements',
      'dobetterweb/appcache',
      'dobetterweb/doctype',
      'dobetterweb/domstats',
      'dobetterweb/optimized-images',
      'dobetterweb/password-inputs-with-prevented-paste',
      'dobetterweb/response-compression',
      'dobetterweb/tags-blocking-first-paint',
    ],
  }],
  audits: [
    'metrics/first-contentful-paint',
    'metrics/first-meaningful-paint',
    'metrics/speed-index',
    'metrics/interactive',
    'metrics/first-cpu-idle',
    'metrics/max-potential-fid',
    'metrics/estimated-input-latency',
    'byte-efficiency/render-blocking-resources',
    'byte-efficiency/uses-responsive-images',
    'byte-efficiency/offscreen-images',
    'byte-efficiency/unminified-css',
    'byte-efficiency/unminified-javascript',
    'byte-efficiency/unused-css-rules',
    'byte-efficiency/uses-optimized-images',
    'byte-efficiency/uses-webp-images',
    'byte-efficiency/uses-text-compression',
  'uses-rel-preconnect',
  'time-to-first-byte',
  'redirects',
  'uses-rel-preload',
    'byte-efficiency/efficient-animated-content',
    'byte-efficiency/total-byte-weight',
    'byte-efficiency/uses-long-cache-ttl',
    'dobetterweb/dom-size',
  'critical-request-chains',
  'user-timings',
  'bootup-time',
  'mainthread-work-breakdown',
  'font-display',
  'performance-budget',
  'resource-summary',
  'network-requests',
  'network-rtt',
  'network-server-latency',
  'main-thread-tasks',
  'diagnostics',
  'metrics',
  'screenshot-thumbnails',
  'final-screenshot',
  ],
  groups: {
    'metrics': {
      title: 'Metrics',
    },
    'load-opportunities': {
      title: 'Opportunities',
      description: 'These optimizations can speed up your page load.',
    },
    'budgets': {
      title: 'Budgets',
      description: 'Performance budgets set standards for the performance of your site.',
    },
    'diagnostics': {
      title: 'Diagnostics',
      description: 'More information about the performance of your application.',
    },
    'additional': {
      title: 'Additional',
      description: 'Additional audits',
    }
  },
  categories: {
    'performance': {
      title: 'Performance',
      auditRefs: [
        // Audits past this point don't belong to a group and will not be shown automatically
        {id: 'network-requests', weight: 1, group: 'additional'},
        {id: 'network-rtt', weight: 1, group: 'additional'},
        {id: 'network-server-latency', weight: 1, group: 'additional'},
        {id: 'main-thread-tasks', weight: 1, group: 'additional'},
        {id: 'diagnostics', weight: 1, group: 'additional'},
        {id: 'metrics', weight: 1, group: 'additional'},
        {id: 'screenshot-thumbnails', weight: 1, group: 'additional'},
        {id: 'final-screenshot', weight: 1, group: 'additional'},
      ],
    }
  }
}
But this gives an empty report like the following:
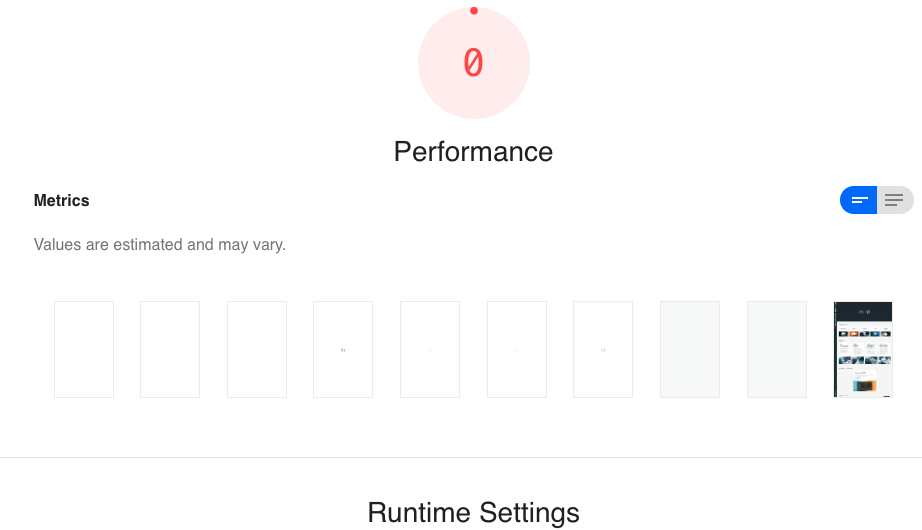
What am I missing here?
 dzlab
dzlab
All 4 comments
The performance section is special in that the groups are hard-coded to provide unique renderings for opportunities, diagnostics, metrics, etc. By putting the audits into your additional category, nothing is rendered. If you want to add a few more standard-looking audits to performance, your best bet would be to add them to the diagnostics group.
That being said, the audits you are talking about are really more for custom data gatherering, debugging, and fancy extra-report visualizations than offering any particular advice about the page, so don't get your hopes up too high :)
 patrickhulce
on 14 Jun 2019
patrickhulce
on 14 Jun 2019
Using the diagnostics group I got the report populating the network stuff. This is enough for me. Thanks.
dzlab
on 14 Jun 2019
@patrickhulce are the results given by the Network Requests reliable? comparing the start/end time of requests to the ones found in network tab of devtools I see big differences. For instance I have an XHR reuqest that took 10s on netwrork tab but on the LH generated report I see it took few milliseconds!
dzlab
on 14 Jun 2019
@dzlab the numbers there are whatever Lighthouse observed during its load of the page. If you have a reproducible case of those numbers being wildly off, then a separate issue with the URL would be much appreciated :)
patrickhulce
on 15 Jun 2019
Related issues
 shellscape
·
3Comments
shellscape
·
3Comments
 workjalexanderfox
·
3Comments
workjalexanderfox
·
3Comments
 mjara74
·
3Comments
mjara74
·
3Comments
 codepodu
·
3Comments
codepodu
·
3Comments
 asistapl
·
3Comments
asistapl
·
3Comments