Lighthouse: Lighthouse report for AMP pages shows low score and higher load times.
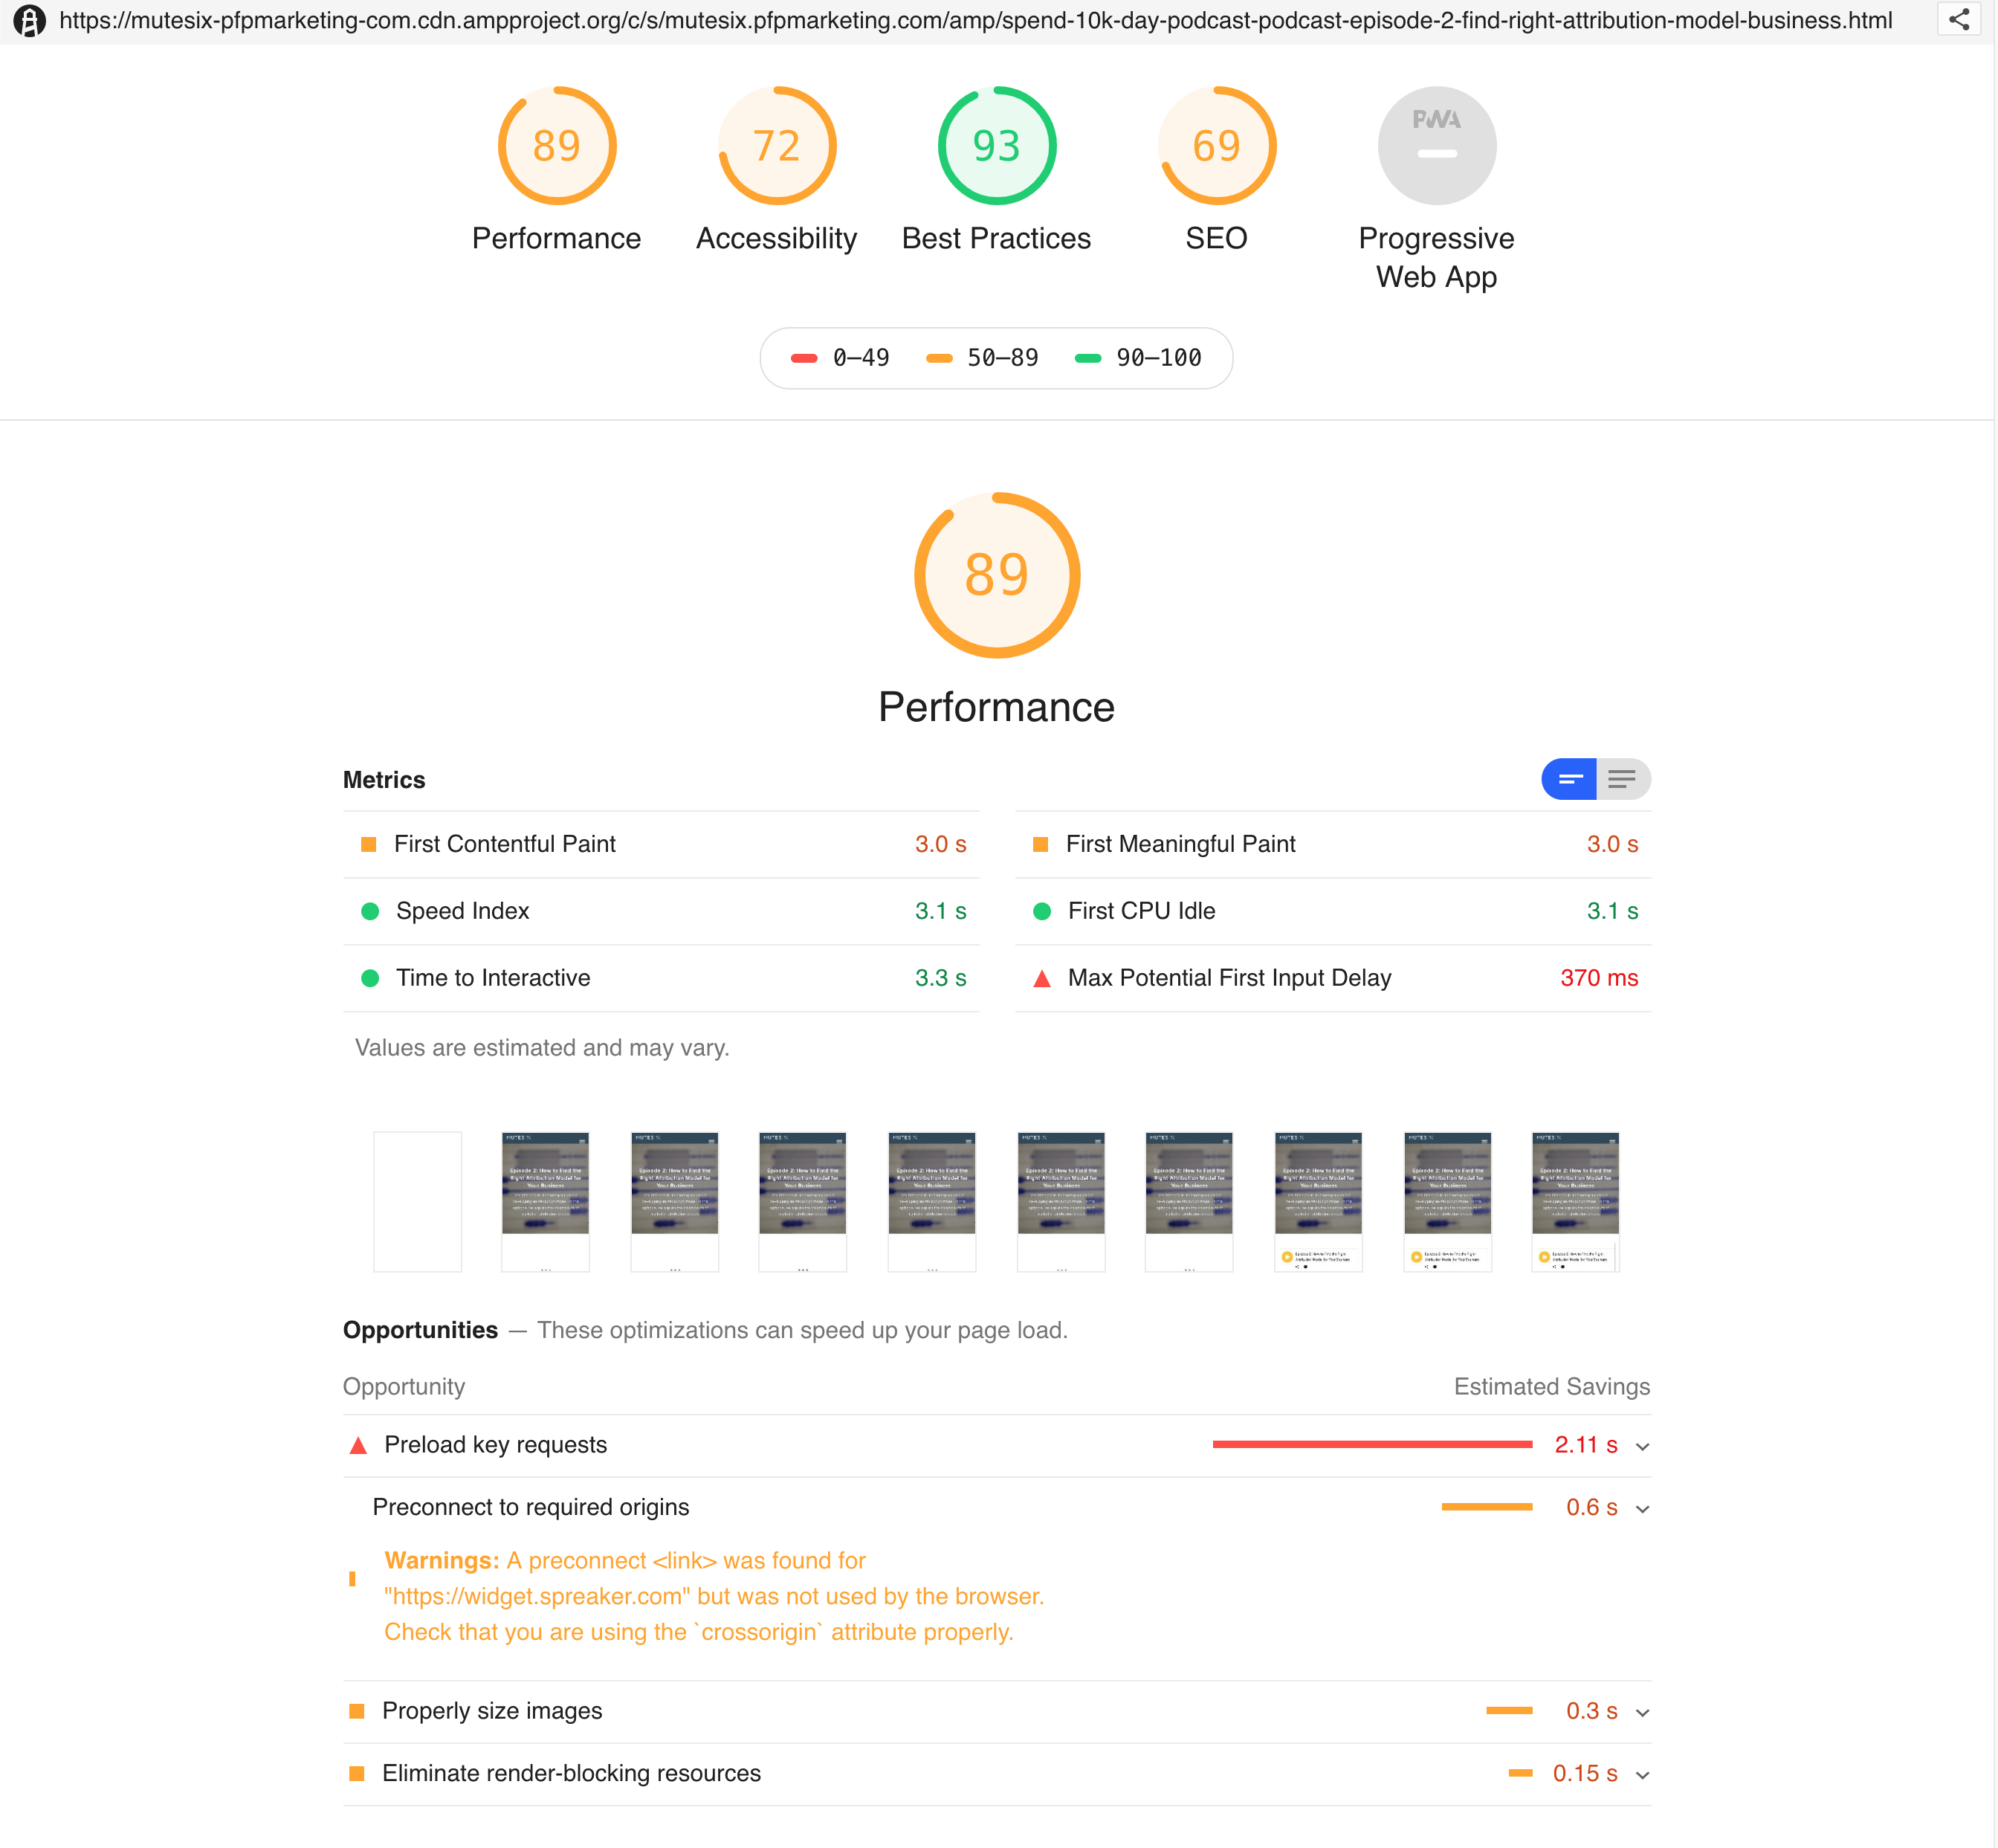
We have a fully valid AMP page, however, while running a lighthouse report, the score ranks in 60's. I tried testing with AMP CDN cache, same issue.
Is there any way to get actual score when the page goes live? https://github.com/GoogleChrome/lighthouse/issues/4490#issuecomment-364437127 says that this is an inherent limitation on how score is calculated for AMP pages, wanted to see if there's any update given all the changes in LHR.
Provide the steps to reproduce
- Run LH on https://mutesix-pfpmarketing-com.cdn.ampproject.org/c/s/mutesix.pfpmarketing.com/amp/spend-10k-day-podcast-podcast-episode-2-find-right-attribution-model-business.html
OR
https://mutesix.pfpmarketing.com/amp/spend-10k-day-podcast-podcast-episode-2-find-right-attribution-model-business.html
What is the current behavior?
Score ~60
What is the expected behavior?
Score > 90
Environment Information
Related issues
https://github.com/GoogleChrome/lighthouse/issues/4490
 anuragphadke
All 10 comments
Thanks @anuragphadke!
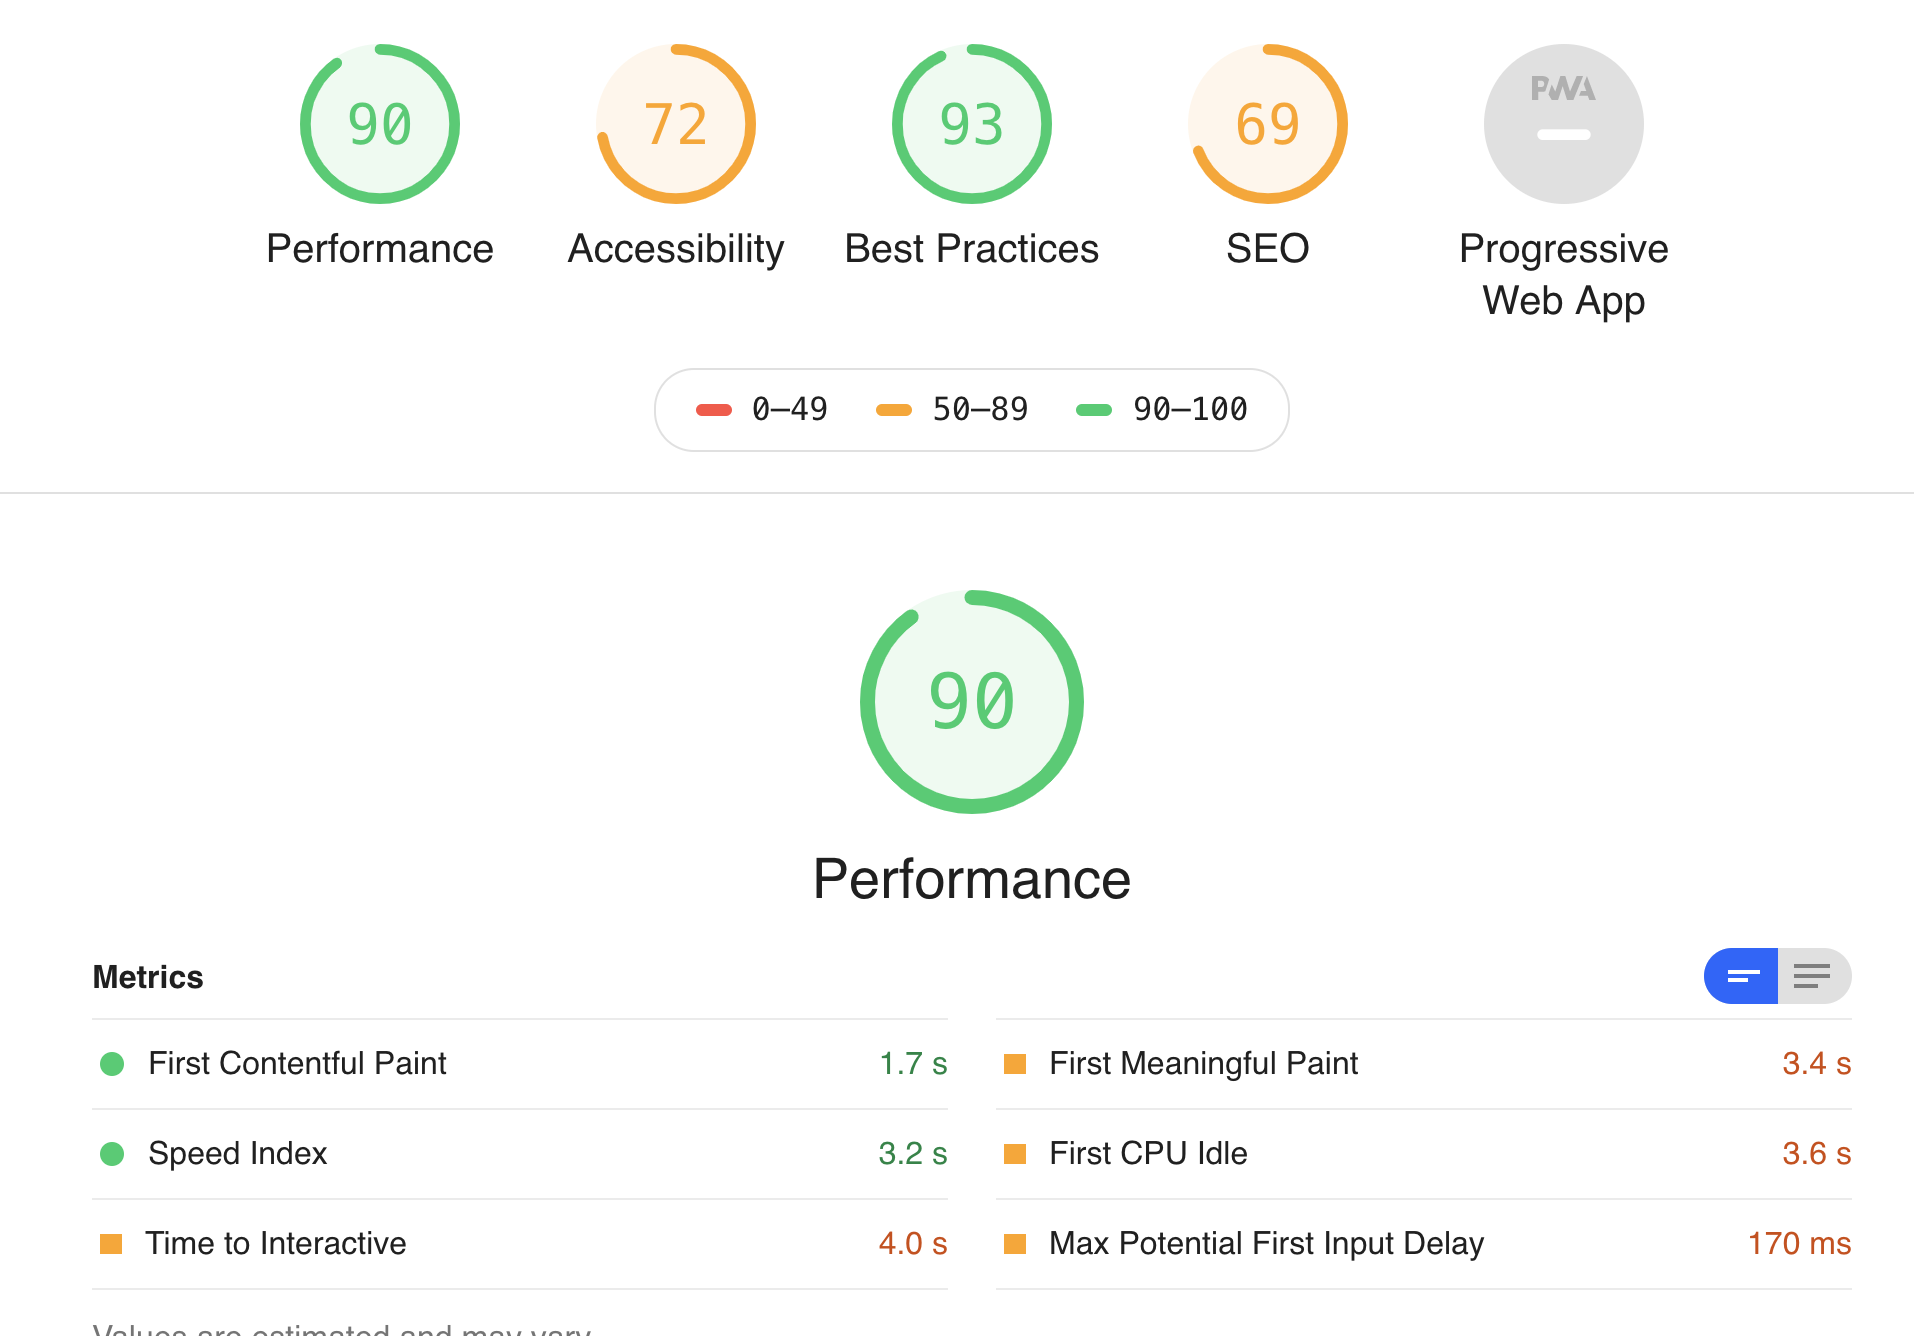
This is what I'm seeing in latest lighthouse.
Would you be able to share the artifacts of the run where you're seeing a score of 60? (run lighthouse --save-assets <url> and upload the trace.json and devtoolslog.json files that get create)
 patrickhulce
on 11 May 2019
patrickhulce
on 11 May 2019
@patrickhulce I am running the report via https://web.dev, report URL: https://lighthouse-dot-webdotdevsite.appspot.com/lh/html?url=https://mutesix-pfpmarketing-com.cdn.ampproject.org/c/s/mutesix.pfpmarketing.com/amp/spend-10k-day-podcast-podcast-episode-2-find-right-attribution-model-business.html
requested dumps lighthouse --save-assets https://mutesix-pfpmarketing-com.cdn.ampproject.org/c/s/mutesix.pfpmarketing.com/amp/spend-10k-day-podcast-podcast-episode-2-find-right-attribution-model-business.html
trace.json: https://gist.github.com/anuragphadke/f0ca418b0aff97b537815a9cc8a1997d
devtoolslog.json: https://gist.github.com/anuragphadke/5f5690f69a2b3f6568ed2b53a52095ec
Looks like there is inconsistency when running locally vs web.dev?
The FCP and FMP numbers even after running locally are still high at 3-secs and the recommendation in Preload key requests should probably be different for valid AMP pages.
I got a 90 score when running it locally.
anuragphadke
on 11 May 2019
Ah thanks for the additional info @anuragphadke!
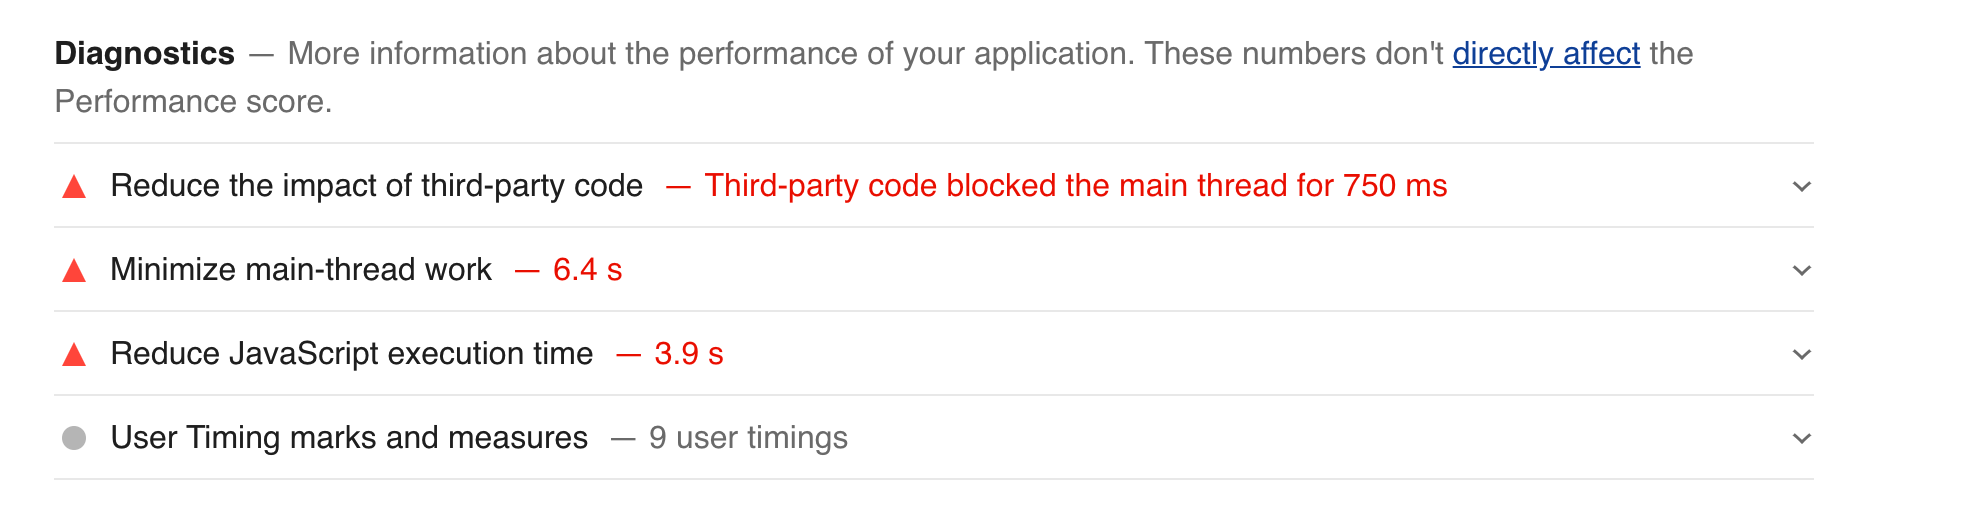
cc @exterkamp FCP looks similar but JS execution time is much higher in LR perhaps this cpuSlowdownMultiplier rearing its head?
patrickhulce
on 12 May 2019
@patrickhulce good observation on FCP. Related question: Shouldn't FCP for AMP pages be lot smaller though? When I click on AMP link from Google search result, the page definitely seems to be loading in well under a second.
anuragphadke
on 12 May 2019
@anuragphadke when the user is coming from the search results page FCP will absolutely be lower with an AMP page, but Lighthouse is measuring the page as visited by a user navigating directly to the page.
Other circumstances like the previous page precaching/prerendering aren't reflected anywhere in the core report. (great potential plugin idea though? 😃)
patrickhulce
on 12 May 2019
@patrickhulce I'll take a look at that JS exec time, see if I can't attribute it to the slowdown multiplier, or something within LR.
 exterkamp
on 12 May 2019
exterkamp
on 12 May 2019
Re-upping this thread as we're experiencing the same issues.
Fully AMP compliant pages give a 48 Performance score

The diagnostic critical points seem to be all related to AMP and the JS.
Is there anything anyone sees here we can on our end do to fix those issues?
The report can be seen here
 erakor
on 23 Jul 2020
erakor
on 23 Jul 2020
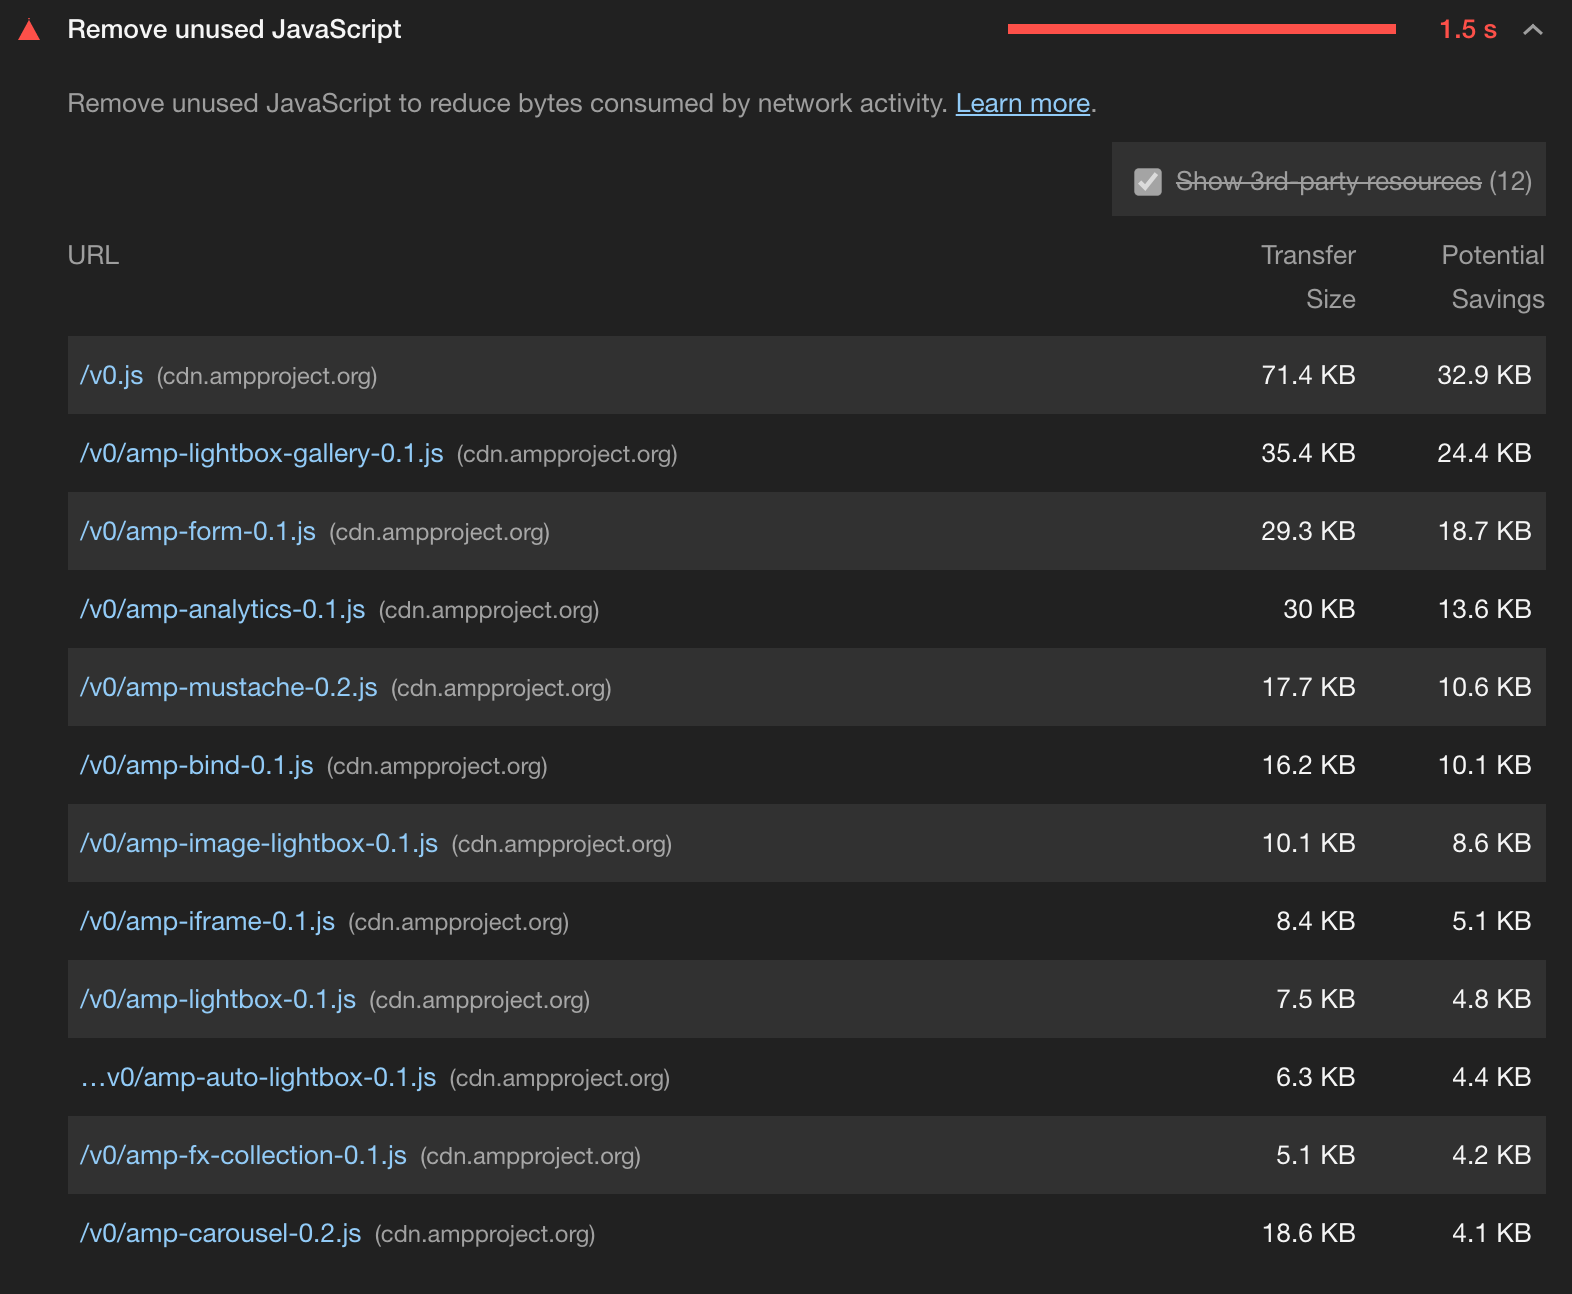
Same issues on our sites. We were getting >95 for performance and now getting ~65. According to the performance opportunities, it is indicating _"Remove unused JavaScript"_ from numerous javascript files served from amp cdn.
EDIT: Stumbled on this issue indicating what I expected with unused javascript;
https://github.com/ampproject/amphtml/issues/28638
 geogramdotcom
on 6 Aug 2020
geogramdotcom
on 6 Aug 2020
@geogramdotcom just to be clear that audit does not affect the score. It helps suggest what is dragging down the score (namely that the page is using too many AMP modules), but the audit itself appearing does not affect the score in any way.
EDIT: Also to anyone else coming here, use of AMP does not magically guarantee that the page will always be fast. Just like any technology it can be too heavily used or poorly configured in a way that still delivers a slow experience. AMP helps prevent the worst case scenarios, but it doesn't guarantee speed.
patrickhulce
on 6 Aug 2020
+1
Experiencing drastically dropping scores the last couple of weeks for our valid AMP Pages as well even though nothing has changed on our side. Definitely something strange going on with both web.dev and pagespeed insights.
 homanp
on 9 Oct 2020
homanp
on 9 Oct 2020
Related issues
 mohanrohith
·
3Comments
mohanrohith
·
3Comments
 radum
·
3Comments
radum
·
3Comments
 sanprieto
·
3Comments
sanprieto
·
3Comments
 wizardnet972
·
3Comments
wizardnet972
·
3Comments
 johnfrancisli
·
3Comments
johnfrancisli
·
3Comments
Most helpful comment
Ah thanks for the additional info @anuragphadke!
cc @exterkamp FCP looks similar but JS execution time is much higher in LR perhaps this cpuSlowdownMultiplier rearing its head?