Lighthouse: pagespeed lighthouse loads uncompressed content
Something happened to pagespeed today at morning. My site had rating 20/60 and it dropped to 5/40. I see complaints about huge content size that all text content (scripts, css, etc.) reports uncompressed size. Even facebook and google scripts show the same huge sizes. I've checked another site of mine and it also dropped to 5/26 with the same complaints.
I've checked that compression is enabled at my local chrome and firefox. Also, local lighthouse shows mobile rating 40 and doesn't complain about huge sizes. And at morning pagespeed also didn't complain about huge script sizes too.
You can check these sites for example:
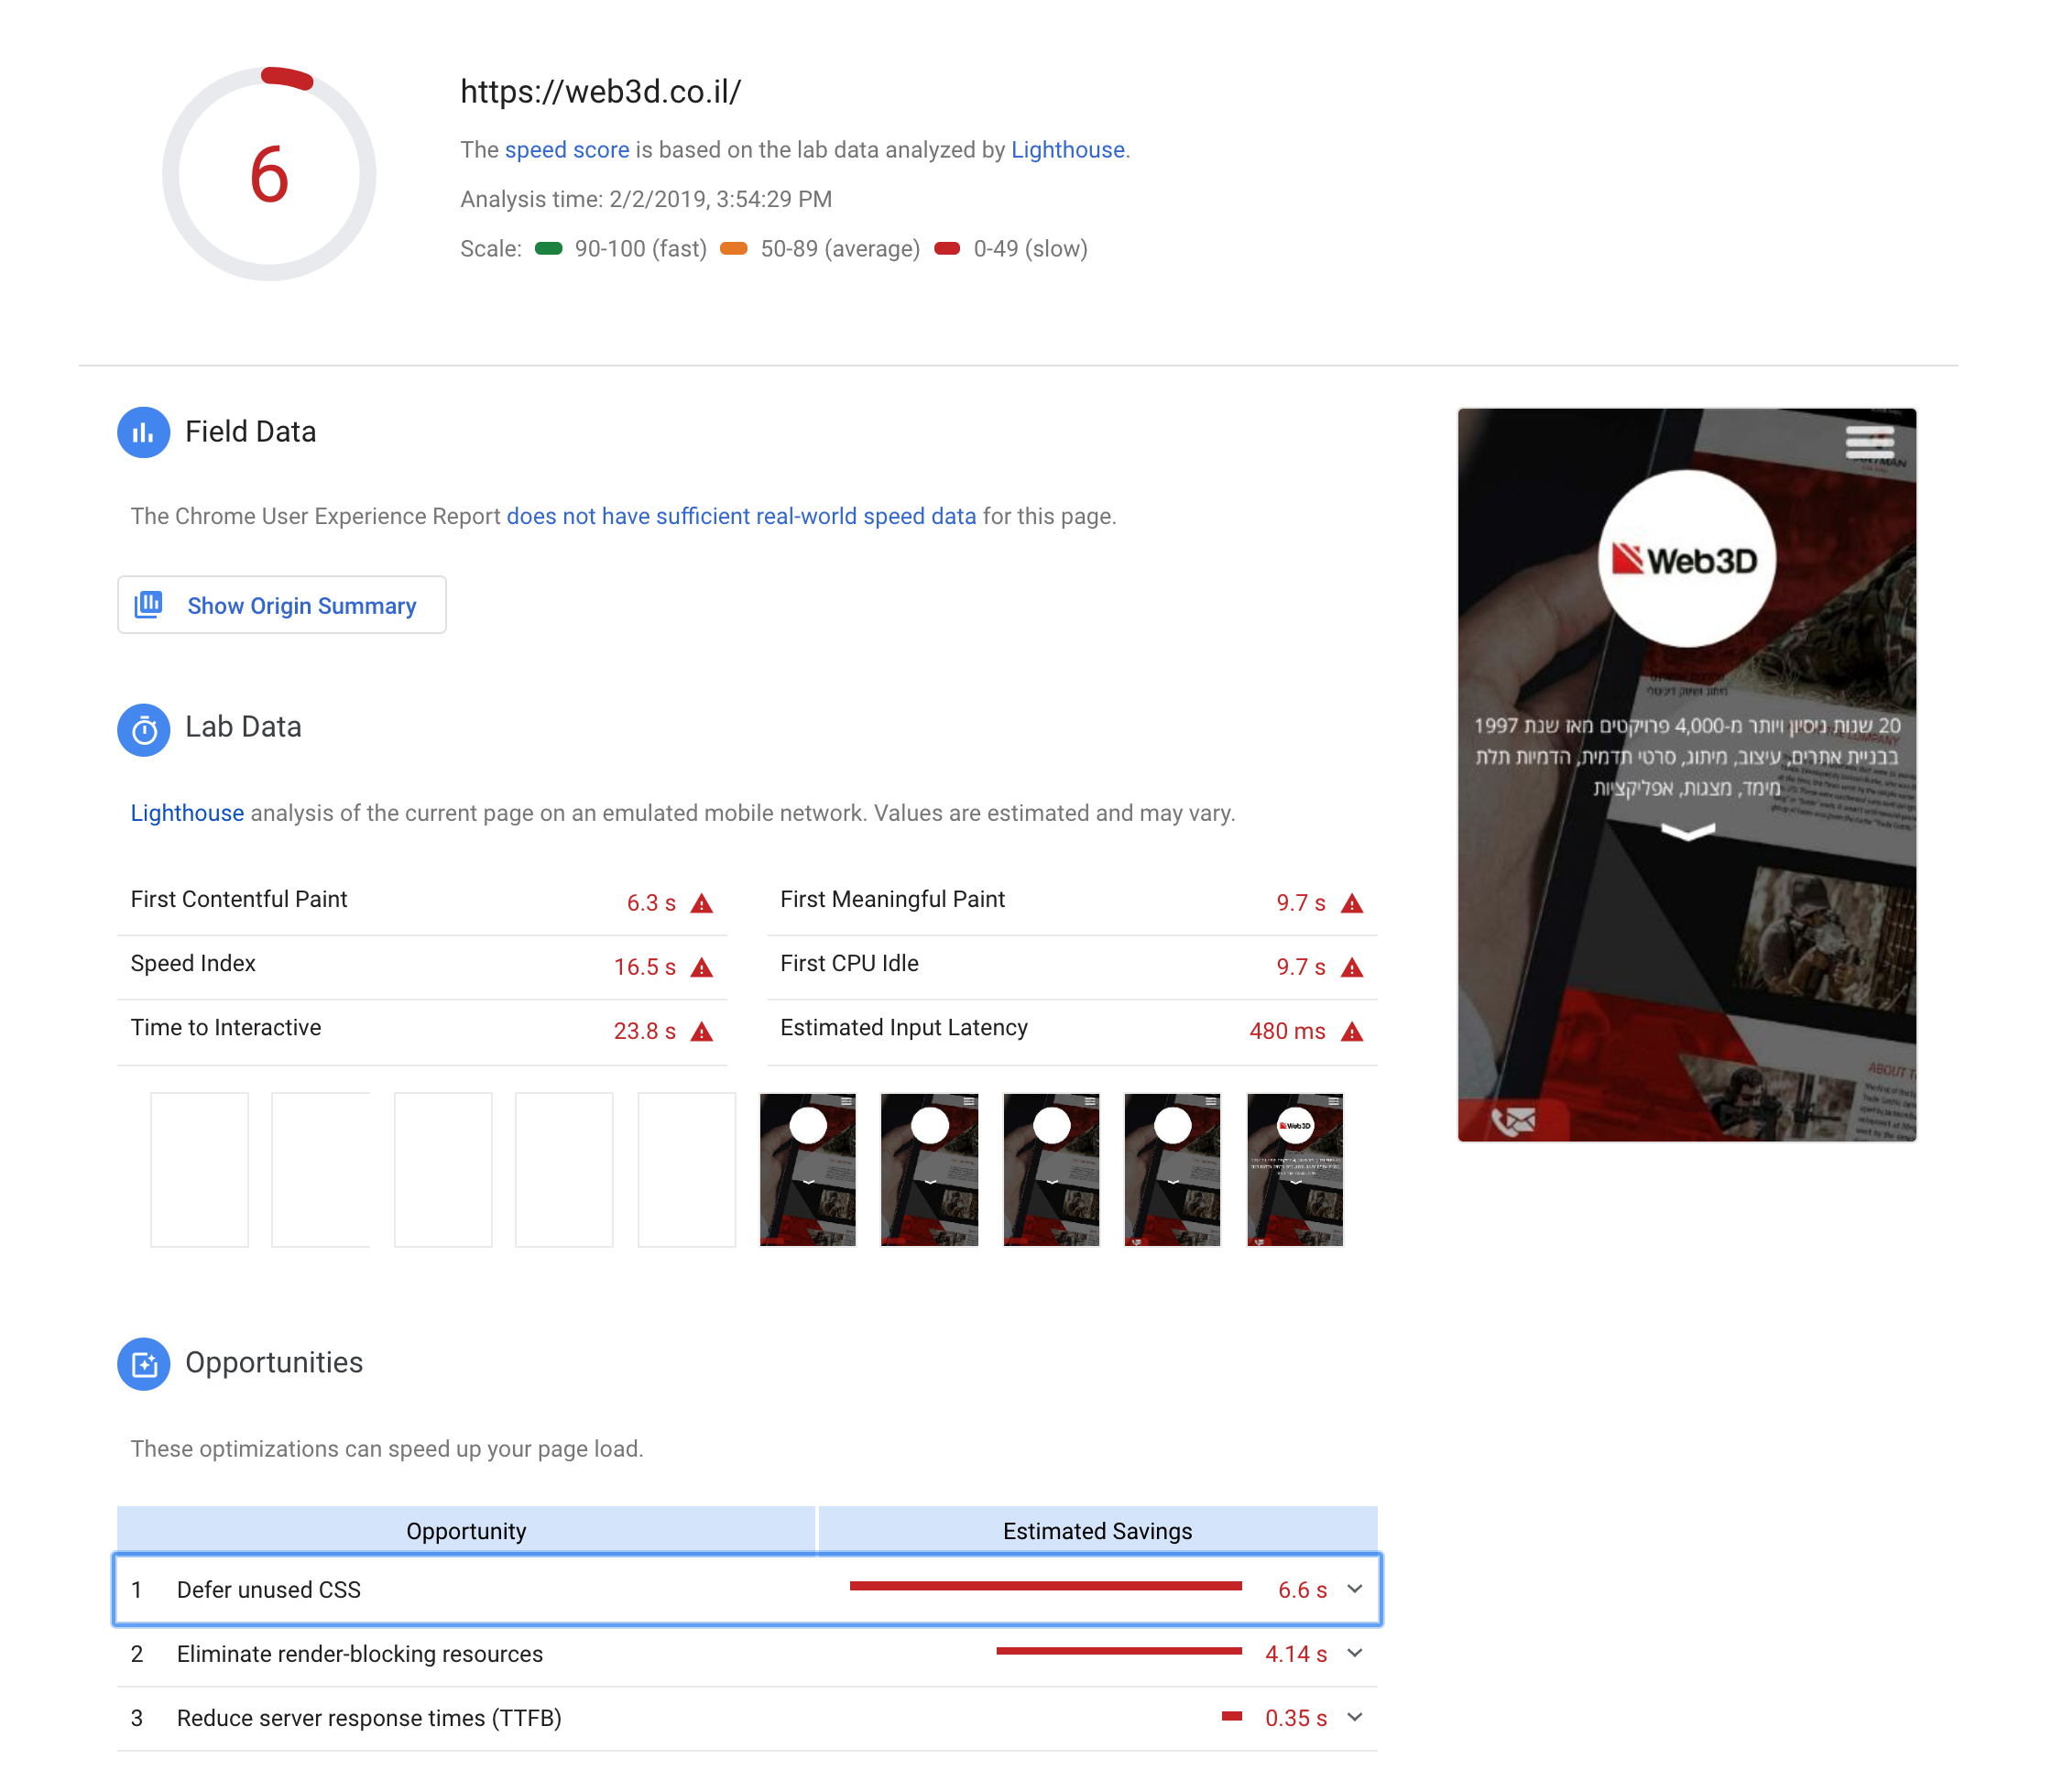
https://web3d.co.il/
https://blog.nli.org.il/
 eugenem
All 5 comments
Thanks for filing @eugenem! I don't see the same uncompressed assets issue you're referring to. I see lots of unused CSS (400-600kb) though on each page blocking first paint, so that's probably responsible for a decent score drop if that wasn't there before.
 patrickhulce
on 2 Feb 2019
patrickhulce
on 2 Feb 2019
at 'Avoid enormous network payloads' section I've got:
…1/9d72fcd….css(web3d.co.il) | 635.9 KB
which is minified CSS. But if you look at the local audit, you will see:
…1/9d72fcd….css(web3d.co.il) | 122.3 KB
And I'm pretty sure that yesterday PageSpeed was showing the same 120K
eugenem
on 2 Feb 2019
@patrickhulce
This is the same as what I have reported here:
https://groups.google.com/forum/#!topic/pagespeed-insights-discuss/luQUtDOnoik
Except that it doesn't seem to be lighthouse related, but rather specific to pagespeed insights tool.
 peixotorms
on 3 Feb 2019
peixotorms
on 3 Feb 2019
Looks like google are rolling out the 'bug fix' now, our scores are returning to normal.
 webgineergit
on 5 Feb 2019
webgineergit
on 5 Feb 2019
Aye. The thread @peixotorms linked is the canonical issue thread.
And this is now all resolved: https://groups.google.com/d/msg/pagespeed-insights-discuss/by9-TbqdlBM/AoAh70JBGgAJ
sorry and thx!
 paulirish
on 5 Feb 2019
paulirish
on 5 Feb 2019
Related issues
 mjara74
·
3Comments
mjara74
·
3Comments
 muuvmuuv
·
3Comments
muuvmuuv
·
3Comments
 devrsi0n
·
3Comments
devrsi0n
·
3Comments
 bitttttten
·
3Comments
bitttttten
·
3Comments
 codepodu
·
3Comments
codepodu
·
3Comments
Most helpful comment
Looks like google are rolling out the 'bug fix' now, our scores are returning to normal.