Lighthouse: Lighthouse performance results are inconsistent when tested multiple times
 bhargavkonkathi
All 12 comments
Lighthouse failing to show accurate results for performance section when tested multiple times.
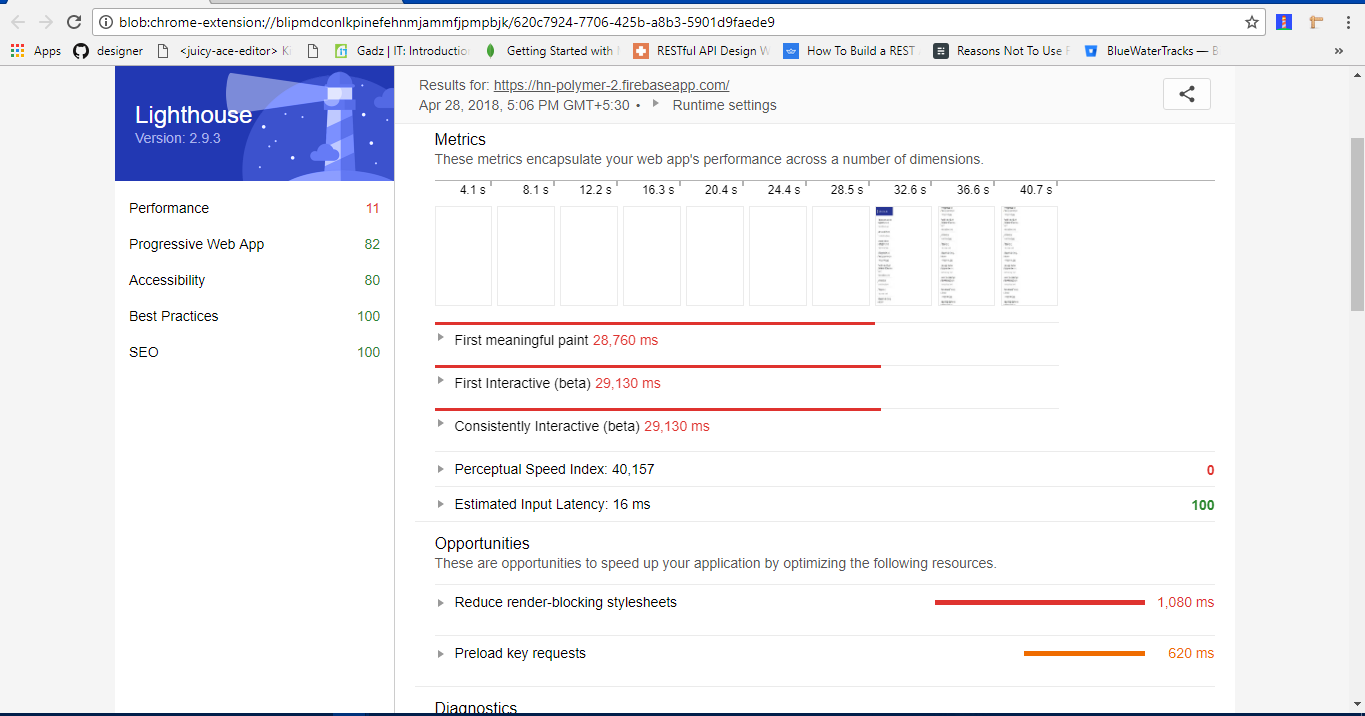
I have tested https://hn-polymer-2.firebaseapp.com/ three times in my browser. I got 3 different results for performance section which are not even close enough though. Performance is an important feature for any PWA app. It would be nice to see consistent results or close enough results when a particular website tested several times. Otherwise it is very difficult to understand how PWA app is performance and improve performance. Or If Internet speed is not good enough to analyse interactive speed or first paint, it would nice to see information like Slow Network connection performance might be varying.
Expected
Performance calculated should same even if report generated multiple times for a same website
Actual
Performance results are varying and not same every time when reports are generated multiple times.
Attached some of lighthouse screenshots for https://hn-polymer-2.firebaseapp.com, when tested multiple times.


Thanks.
bhargavkonkathi
on 28 Apr 2018
@bhargavkonkathi have you followed all the guidance for reducing variability in our scoring docs? 2 of those 3 runs look like external interference. If you have other software on your system that makes pages load irregularly that is what Lighthouse will observe and report.
Also note that if you're running with DevTools/Chrome Extension, the tab will need to be a visible window the entire duration of the audit or results will be skewed by backgrounding.
 patrickhulce
on 30 Apr 2018
patrickhulce
on 30 Apr 2018
I very much appreciate what Lighthouse is attempting to accomplish. I have many clients who I help with frontend performance. Lighthouse has the potential to make frontend timing more available and understandable.
That being said, the wide variance degrades the usefulness of the tool. Are there plans to allow user to increase n? Even more so than backend benchmarking, frontend benchmarking varies incredibly from request to request, depending on local CPU, network congestion, the stars aligning, etc. An n of requests less than 20 seems unideal. An n of 1 is asking for wildly varying results...
Lighthouse should probably also clearly say "hey, don't touch your computer while we benchmark" — I've noticed that if I keep browsing and using my computer, I can slow down and skew a result by 1.5-3x...
For the moment, I'm cautioning my clients when they come to me with Lighthouse runs. People are also not really clear about the throttling (that Lighthouse is showing a "worst case" scenario, which is awesome). I tell them to run it multiple times, to not touch their computer, and that webpagetest.org is their best bet for stable results (even with 9 runs the variance can be kinda crazy!)
In short, I love the user friendliness of the tool. I'd love to see support for multiple requests in Lighthouse so we can also see some stability in results!
 sudara
on 30 Apr 2018
sudara
on 30 Apr 2018
Also note that if you're running with DevTools/Chrome Extension, the tab will need to be a visible window the entire duration of the audit or results will be skewed by backgrounding.
This might be super valuable information to tell users immediately, right after hitting "Run Audit"...
sudara
on 30 Apr 2018
@patrickhulce Yes, I have followed the scoring docs. Also I didn't closed window for entire duration of audit. I have tested many times same websites, I saw variation in results.
Thanks.
bhargavkonkathi
on 1 May 2018
@sudara the initiative you're describing is tracked by #4204 (codename smoothhouse) which will run LH multiple times and combine the results.
In v3 our default mode of operation will be using a different performance engine that should cut variance by about 50%. Note there will always be a trade-off between realism and stability, the real world has a high amount of variance and so do all observed methods of performance measurement. Removing the variance is therefore removing an element of realism, and we're attempting to balance the two concerns thoughtfully.
If you'd like to learn more about this, there's a detailed document where you can read all about our findings.
@bhargavkonkathi of the three runs you pasted only one of them seems valid, the other two are clear error cases (1st one is a classic example of what happens when the window is obscured until the 28s mark and Chrome finally paints, 3rd one has an error in metric computation). If you're seeing variance on a particular URL beyond what's outlined in the document for non-error cases, we'd be happy to hear about it. If a particular URL errors frequently, a separate issue is very much appreciated :)
patrickhulce
on 2 May 2018
Thanks @patrickhulce!
That's fantastic that you guys have something planned. As you say, there's so much real life variance that it's important to capture and present that variance (vs. provide only 1 possible datapoint). Sounds like you guys plan on including stddev in some shape or form which will be helpful to guide people's expectations.
Wow, that detailed document is above and beyond. Thanks for sharing it. Looking forward to smoothhouse!
sudara
on 2 May 2018
Resolved in Lighthouse 3.x. We don't have the ability to do multiple runs (choosing the median), but its less important as 3.x is more consistent.
Please open a new issue if you're seeing significant variability now.
 paulirish
on 29 Aug 2018
paulirish
on 29 Aug 2018
I removed a large payload of vids from the tested URL, it went DOWN 1 point. Total payload was 14MB, surely removing these and then retesting would boost the score???
 fusiondesigner
on 10 Jul 2019
fusiondesigner
on 10 Jul 2019
@fusiondesigner generally speaking the complete size of videos does not affect the performance metrics. You should have seen a significant change to the "Total Byte Weight" diagnostic, but the first paint time for example is not really affected by the duration/size of a video clip.
Also, down a single point is not a meaningful measurement. Performance scores are expected to fluctuate within a few points. Learn more.
patrickhulce
on 10 Jul 2019
@patrickhulce thanks Patrick, we were confused as it highlighted a large payload from two videos in the source code.
fusiondesigner
on 10 Jul 2019
I am currently working my way in to Lighthouse 5.2.
So far I am pretty content with what I have learned. But I seem unable to get a stable output from the performance scan. As recommended I run five continuous scans and calculate the average. But the output vary a lot even though the conditions are the same.
In order to start using Lighthouse I need a stable output eg. for QA reporting and customer reviews.
In short my question is: How can I get an output from Lighthouse performance that does not fluctuate more than eg. +/- 2 points
 Lba-X
on 20 Nov 2019
Lba-X
on 20 Nov 2019
Related issues
 devrsi0n
·
3Comments
devrsi0n
·
3Comments
 etelai
·
3Comments
etelai
·
3Comments
 timj2
·
3Comments
timj2
·
3Comments
 dkajtoch
·
3Comments
dkajtoch
·
3Comments
 asistapl
·
3Comments
asistapl
·
3Comments
Most helpful comment
I am currently working my way in to Lighthouse 5.2.
So far I am pretty content with what I have learned. But I seem unable to get a stable output from the performance scan. As recommended I run five continuous scans and calculate the average. But the output vary a lot even though the conditions are the same.
In order to start using Lighthouse I need a stable output eg. for QA reporting and customer reviews.
In short my question is: How can I get an output from Lighthouse performance that does not fluctuate more than eg. +/- 2 points