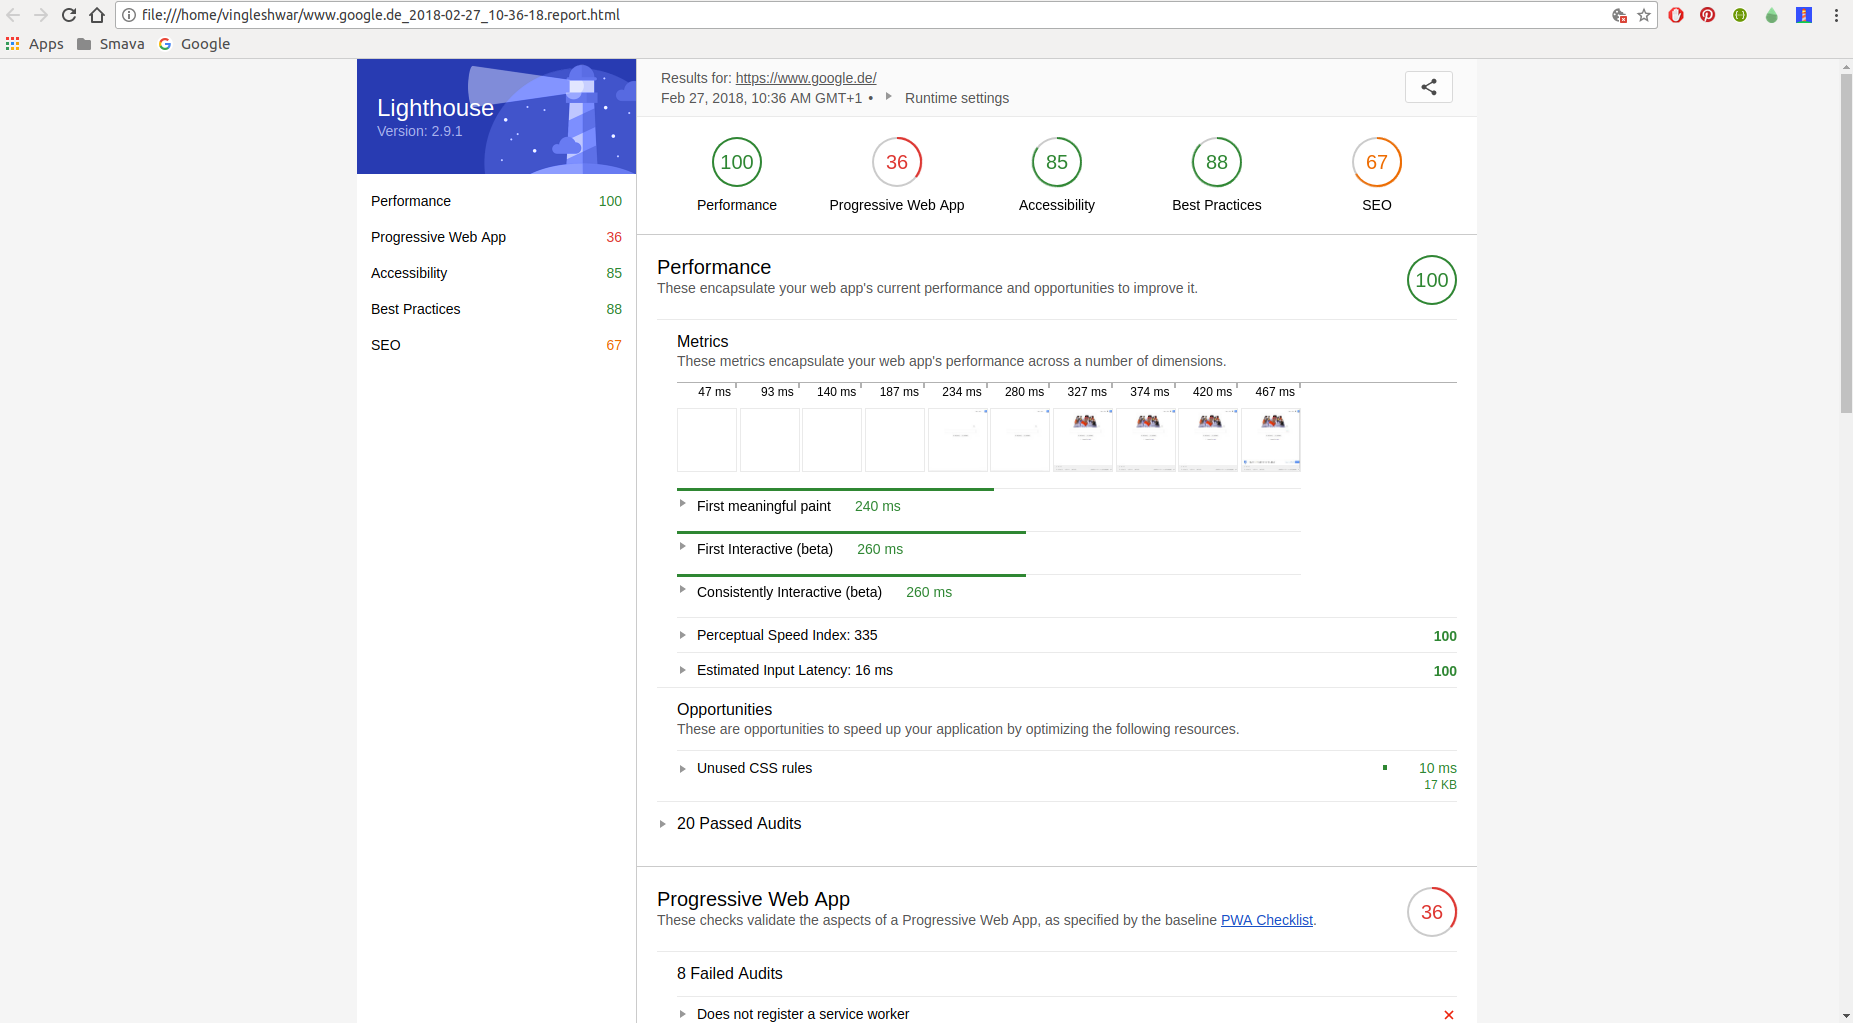
Lighthouse: "First meaningful paint, "First Interactive" values are mapped to
Please refer to 2 screen shots attached.
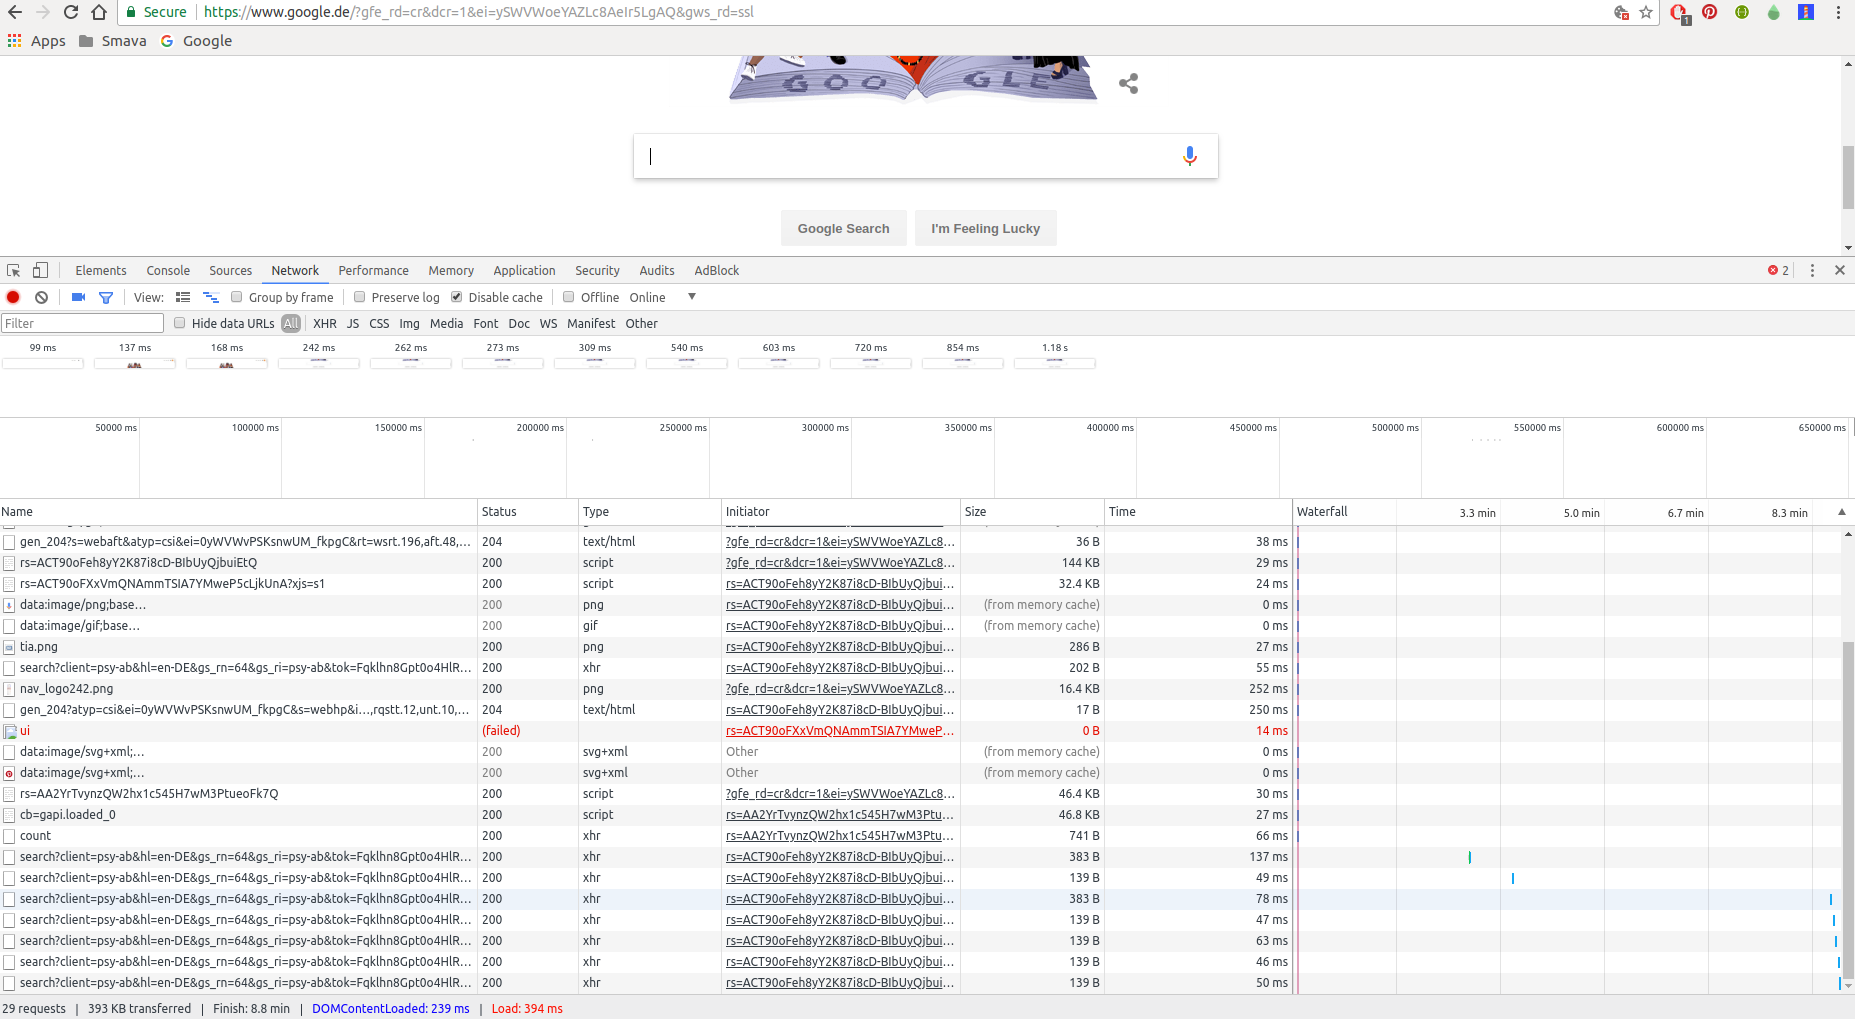
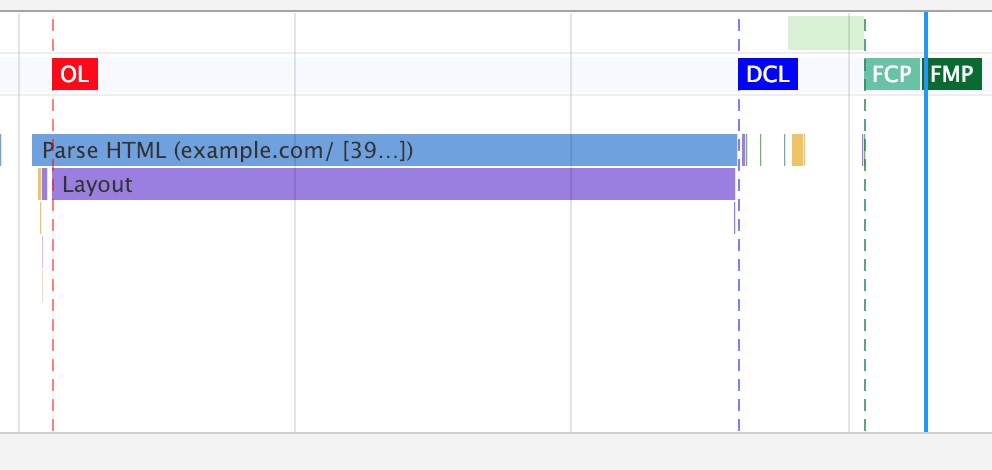
- First one is from Network tab under chrome tool
- Second one is report generated by lighthouse tool
Please clarify how does "First meaningful paint, "First Interactive" values can be mapped to values seen under Network tab ?
 vikramvi
All 12 comments
Hi Vikram- I think there might be some confusion here. The values for First Meaningful Paint don't map to network activity, but rather map to paint values. Therefore, there shouldn't be a consistency with what you see in the networks tab and in the LH report.
 vinamratasingal-zz
on 1 Mar 2018
vinamratasingal-zz
on 1 Mar 2018
@vinamratasingal Thanks for answer but still it's not clear to me
Without LH how to view values of First meaningful paint, First Interactive in chrome developer tools ?
Can you please explain in detail the terms First meaningful paint, First Interactive ?
vikramvi
on 5 Mar 2018
Answers to your questions are below @vikramvi but they may not be exactly what you were hoping for. Lighthouse provides these metrics to you precisely because they are relatively difficult to obtain on your own and on the cutting edge :)
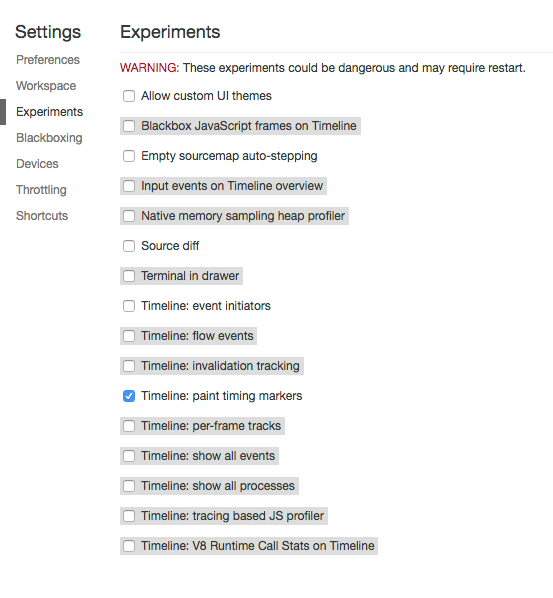
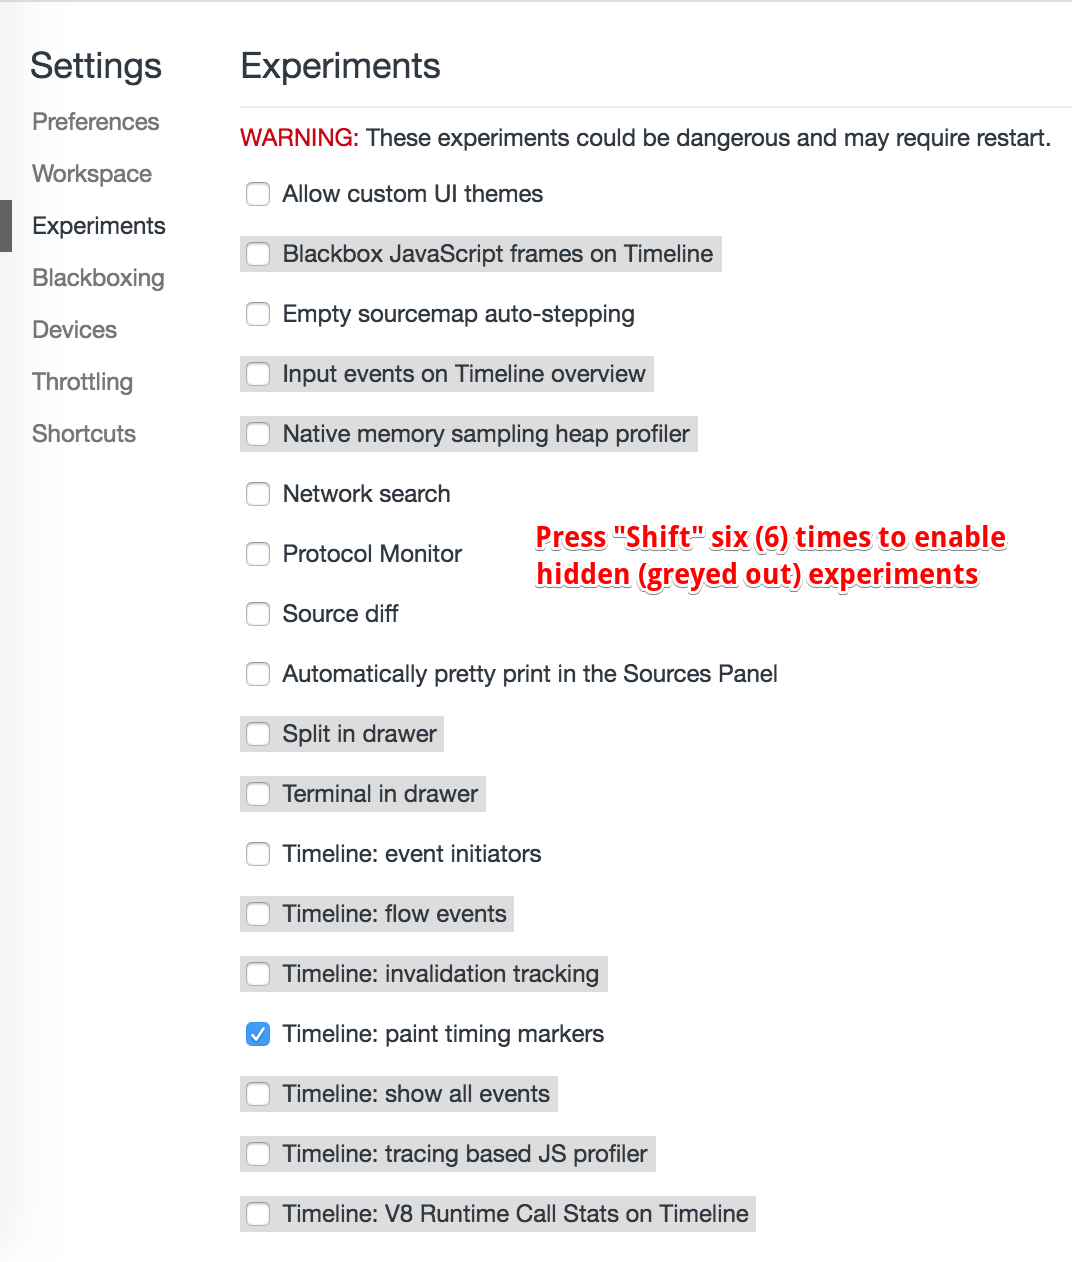
You can see FMP in DevTools by first enabling the "Timeline: paint timing markers" setting and recording a trace of your page load in the performance tab.
You cannot see first interactive anywhere, but on a recorded trace in the performance tab you can examine the trace manually to determine where First Interactive should be by following the algorithm outlined in "TTI explainer" link.
 patrickhulce
on 5 Mar 2018
patrickhulce
on 5 Mar 2018
Thanks for detailed info @patrickhulce
vikramvi
on 20 Mar 2018
@patrickhulce Are the experiment settings still available in later version of Chrome? I'm using ver 67 but didn't find 'Experiments' in the settings. Or do I need to turn it on somewhere else?
 shuangq
on 28 Jun 2018
shuangq
on 28 Jun 2018
@shuangq you'll need to enable DevTools experiments Chrome-wide at chrome://flags, beware all the usual caveats when playing with experimental features :)

patrickhulce
on 28 Jun 2018
@patrickhulce Thanks a lot 😃
shuangq
on 28 Jun 2018
@patrickhulce has this changed in Chrome 68 (Version 68.0.3440.84 (Official Build) (64-bit), Mac)?
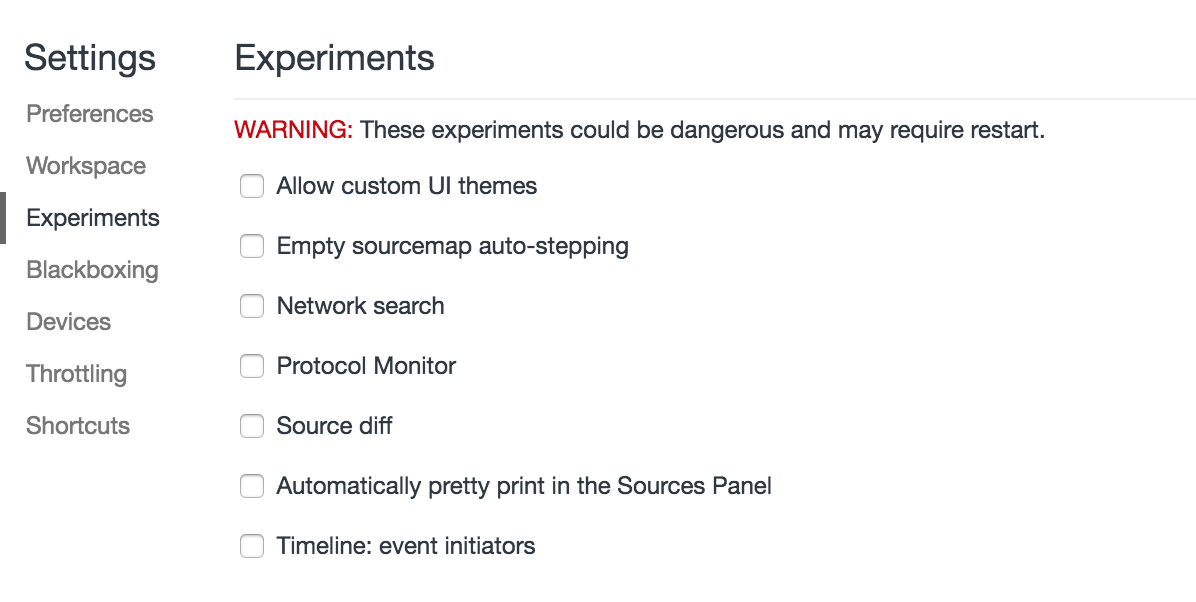
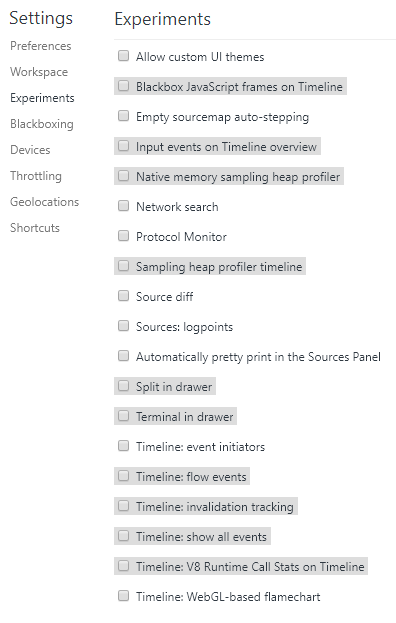
After enabling "Developer Tools experiments" in chrome://flags/ I still don't see an option to enable Timeline: paint timing markers in DevTools > Settings.
 lmakarov
on 8 Aug 2018
lmakarov
on 8 Aug 2018
Finally found the answer to this. You have to press "Shift" six times in DevTools > Settings > Experiments to uncover the hidden experiments.
lmakarov
on 10 Aug 2018
Hello @lmakarov
Am still not getting the option for Timeline: paint timing markers in DevTools > Settings.
 shrutiseth
on 12 Dec 2018
shrutiseth
on 12 Dec 2018
I want to get FMP and FCP for a URL. Please help
shrutiseth
on 12 Dec 2018
@shrutiseth it might have been taken out of experiments. I'm seeing a much better UI for the timing markers now in Canary 😍
patrickhulce
on 12 Dec 2018
Related issues
 etelai
·
3Comments
etelai
·
3Comments
 wizardnet972
·
3Comments
wizardnet972
·
3Comments
 mjara74
·
3Comments
mjara74
·
3Comments
 dkajtoch
·
3Comments
dkajtoch
·
3Comments
 asistapl
·
3Comments
asistapl
·
3Comments
Most helpful comment
@shrutiseth it might have been taken out of experiments. I'm seeing a much better UI for the timing markers now in Canary 😍