Lighthouse: Low Score for First and Consistently Interactive times with uglified code.
Webpack's production mode -> +4 seconds to first interactive.
- lighthouse 2.0.0
- chrome 59.0
I have two versions of the same SPA, the only difference between them is the way of generating the JS bundle, all the other resources are identical except for the JS bundles: one is generated using webpack's production mode (-p) which uglifies/minifies the js code using UglyfyJS.
So for the unminified one, I am getting a better score in performance that for the minified one, due to the First and Consistently Interactive times.
I have checked the docs and some code and can't figure out why is that.
- minified version's First Interactive time: 6-7s
- unminified version: 2.5s
Checking my page's performance in chrome's devtools, I am not able to see any meaningful difference. The two versions have the seme behaviour, after 2 seconds aprox. they do not do network requests or any tasks. Also the DOMContentLoaded event always before the First Meaningful Paint.
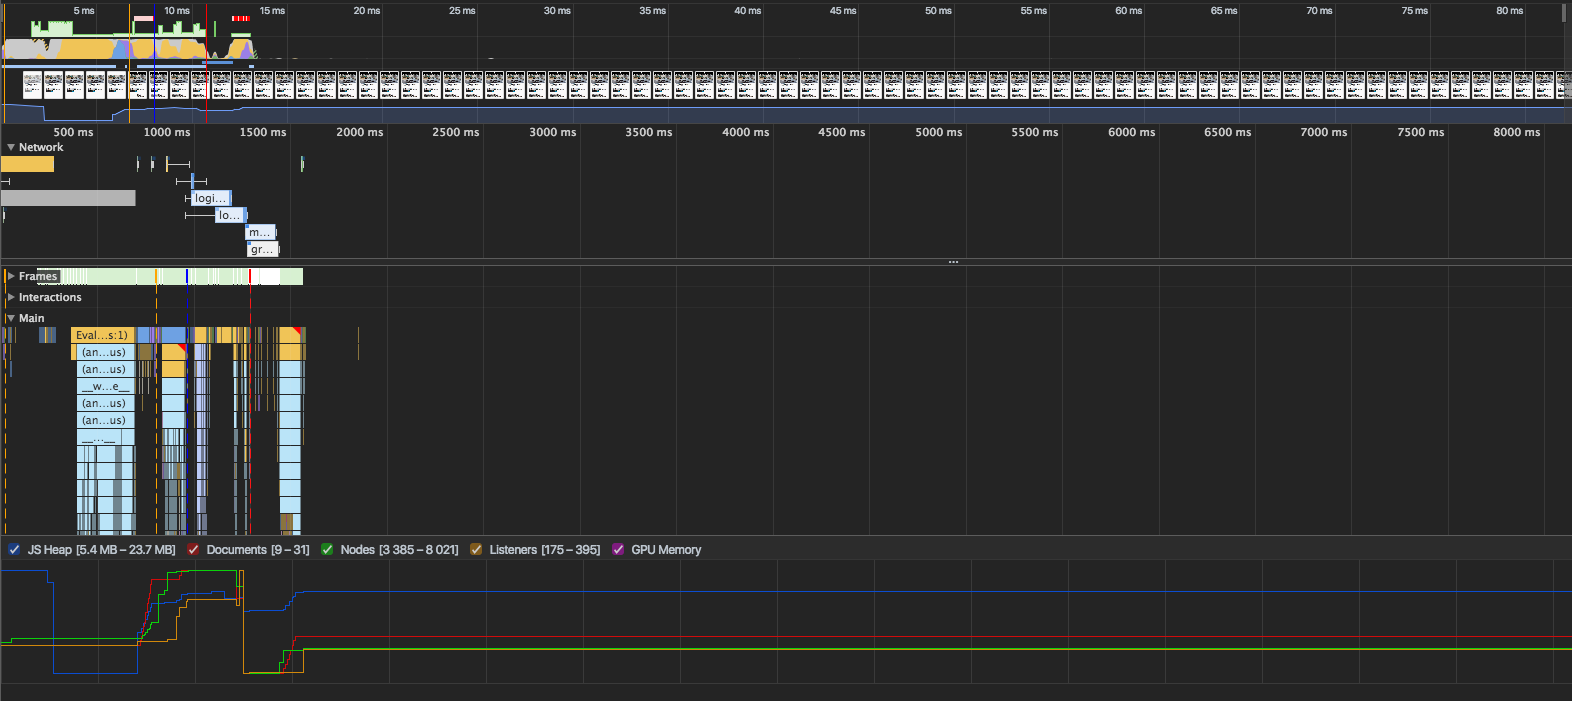
Unminified version
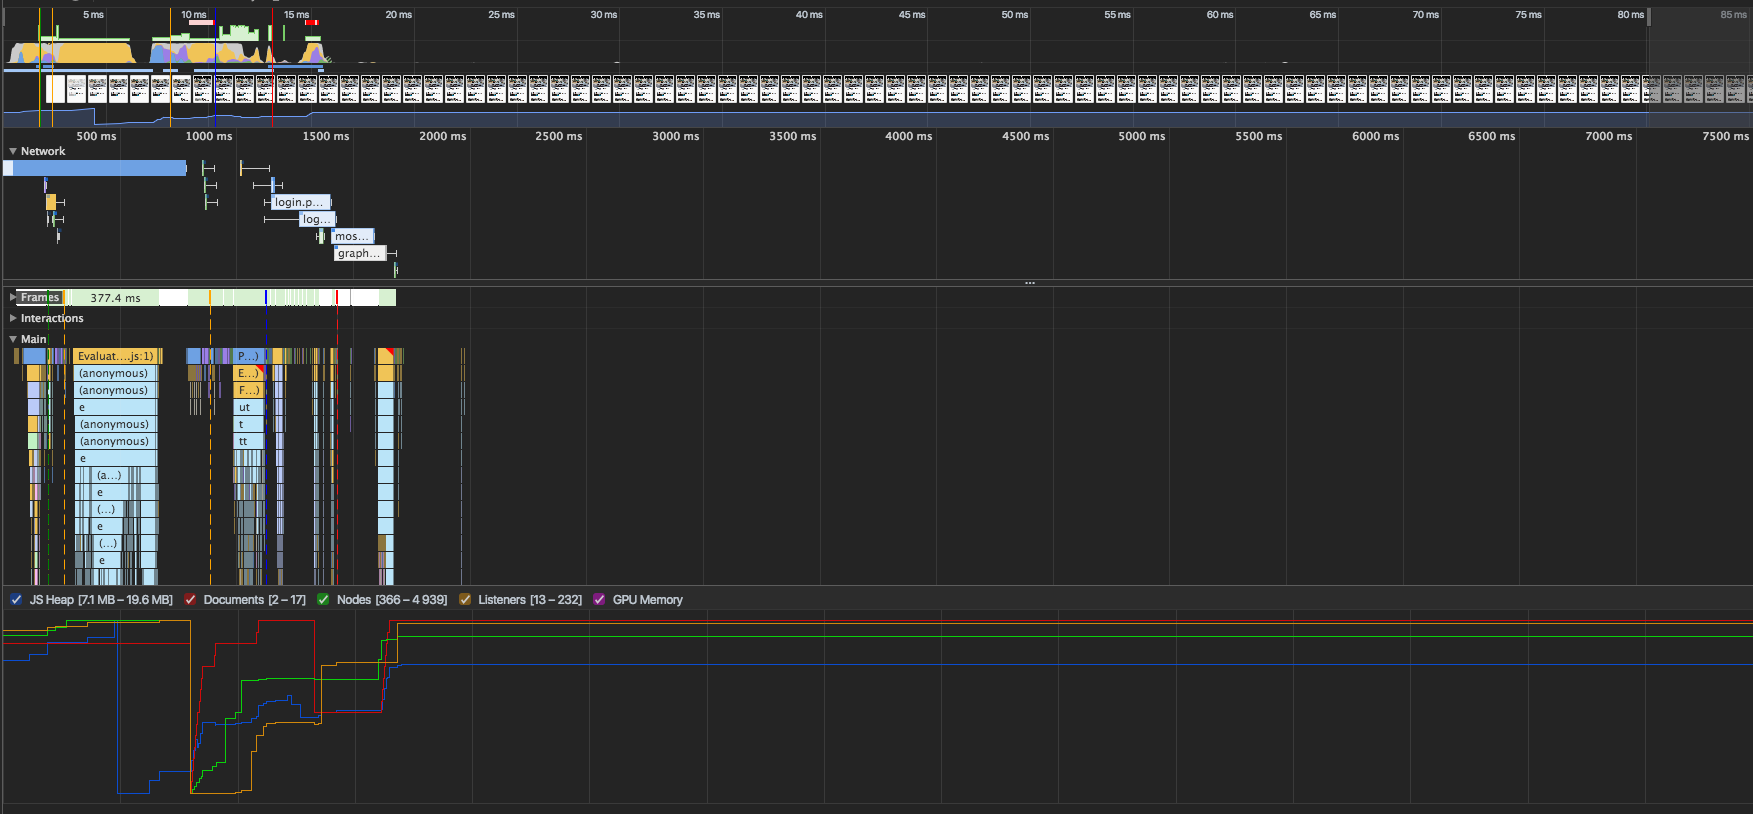
Minified version
 miquelmasrieramrf
All 8 comments
Could you save and attach the devtools profiles?
How reproducible is this - is that gap this large every execution?
 tdresser
on 6 Jun 2017
tdresser
on 6 Jun 2017
@miquelmasrieramrf do you have two URLs where these two version are available so we can investigate? There's no reason this should be happening that I can think of, so something fishy is going on. In fact, the minified bundle should perform better due to its smaller size under our throttling :)
 patrickhulce
on 6 Jun 2017
patrickhulce
on 6 Jun 2017
Thanks, since this is my company's code I can't provide the unminified version, I have to check if I can provide it to you.
but regarding to the profiles, this is 10seconds of profiling of the minified and unminified versions
miquelmasrieramrf
on 6 Jun 2017
Thanks for providing those! These traces don't look like they were taken by Lighthouse though. On those two traces first-interactive and consistently interactive would be nearly the same on both, so LH must be getting a different view of the world. Could you send the traces that LH is analyzing by running the CLI on your URLs with the --save-assets flag and sending the file ending in .trace.json?
patrickhulce
on 6 Jun 2017
yes, they were from chrome, here are the ones from lighthouse
Later I'll make a simple app and do a production and a dev build, and go a little deeper into lighthouse.
miquelmasrieramrf
on 7 Jun 2017
Thanks for providing those this is a perfect example case!
@tdresser this is a great example of where the 2-quiet heuristic fails. The unminified bundle takes so much longer that it is the only request for ~10s so we reach our 5s threshold of network and CPU quiet before it has even finished downloading
patrickhulce
on 7 Jun 2017
Thank you sharing this trace. It looks like this is a real issue with our current First (Consistently) Interactive definitions.
As @patrickhulce noted, the current definitions work by trying to detect 5s of network 2-quiet and main thread quietness in the Consistently Interactive case, and a smaller variable window of main thread quietness in the First Interactive case.
In your unminified case, the network request to download core.js takes 9.97 seconds, which is long enough that we give up the search for First (Consistently) Interactive and declare our best possible guess so far. In the minified case however, the request doesn't take so long, and so we detect the flurry of main thread activities after downloading core.js and correctly declare First (Consistently) Interactive after that.
We're always working on improving these metric definitions, and eventually we hope to cover this case. In the meantime, if you only track this metric in the minified case, I hope it still gives you some meaningful insight about the performance of your application.
As an aside, my guess for why you weren't seeing the differences when you recorded the traces with chrome devtools would be that lighthouse (I believe) emulates a slow network by default, so the 4.7MB js file tool a really long time to download. On a fast network, the download time is much shorter and we did not hit that edge case. You can load the traces you recorded through lighthouse in devtools and see the difference.
 deepanjanroy
on 7 Jun 2017
deepanjanroy
on 7 Jun 2017
I was testing with no-throttling, totally missed it. Now I have something to start with.
Thanks a lot!
miquelmasrieramrf
on 7 Jun 2017
Related issues
 bitttttten
·
3Comments
bitttttten
·
3Comments
 nl-igor
·
3Comments
nl-igor
·
3Comments
 etelai
·
3Comments
etelai
·
3Comments
 motiejuss
·
3Comments
motiejuss
·
3Comments
 workjalexanderfox
·
3Comments
workjalexanderfox
·
3Comments
Most helpful comment
Thank you sharing this trace. It looks like this is a real issue with our current First (Consistently) Interactive definitions.
As @patrickhulce noted, the current definitions work by trying to detect 5s of network 2-quiet and main thread quietness in the Consistently Interactive case, and a smaller variable window of main thread quietness in the First Interactive case.
In your unminified case, the network request to download core.js takes 9.97 seconds, which is long enough that we give up the search for First (Consistently) Interactive and declare our best possible guess so far. In the minified case however, the request doesn't take so long, and so we detect the flurry of main thread activities after downloading
core.jsand correctly declare First (Consistently) Interactive after that.We're always working on improving these metric definitions, and eventually we hope to cover this case. In the meantime, if you only track this metric in the minified case, I hope it still gives you some meaningful insight about the performance of your application.
As an aside, my guess for why you weren't seeing the differences when you recorded the traces with chrome devtools would be that lighthouse (I believe) emulates a slow network by default, so the 4.7MB js file tool a really long time to download. On a fast network, the download time is much shorter and we did not hit that edge case. You can load the traces you recorded through lighthouse in devtools and see the difference.