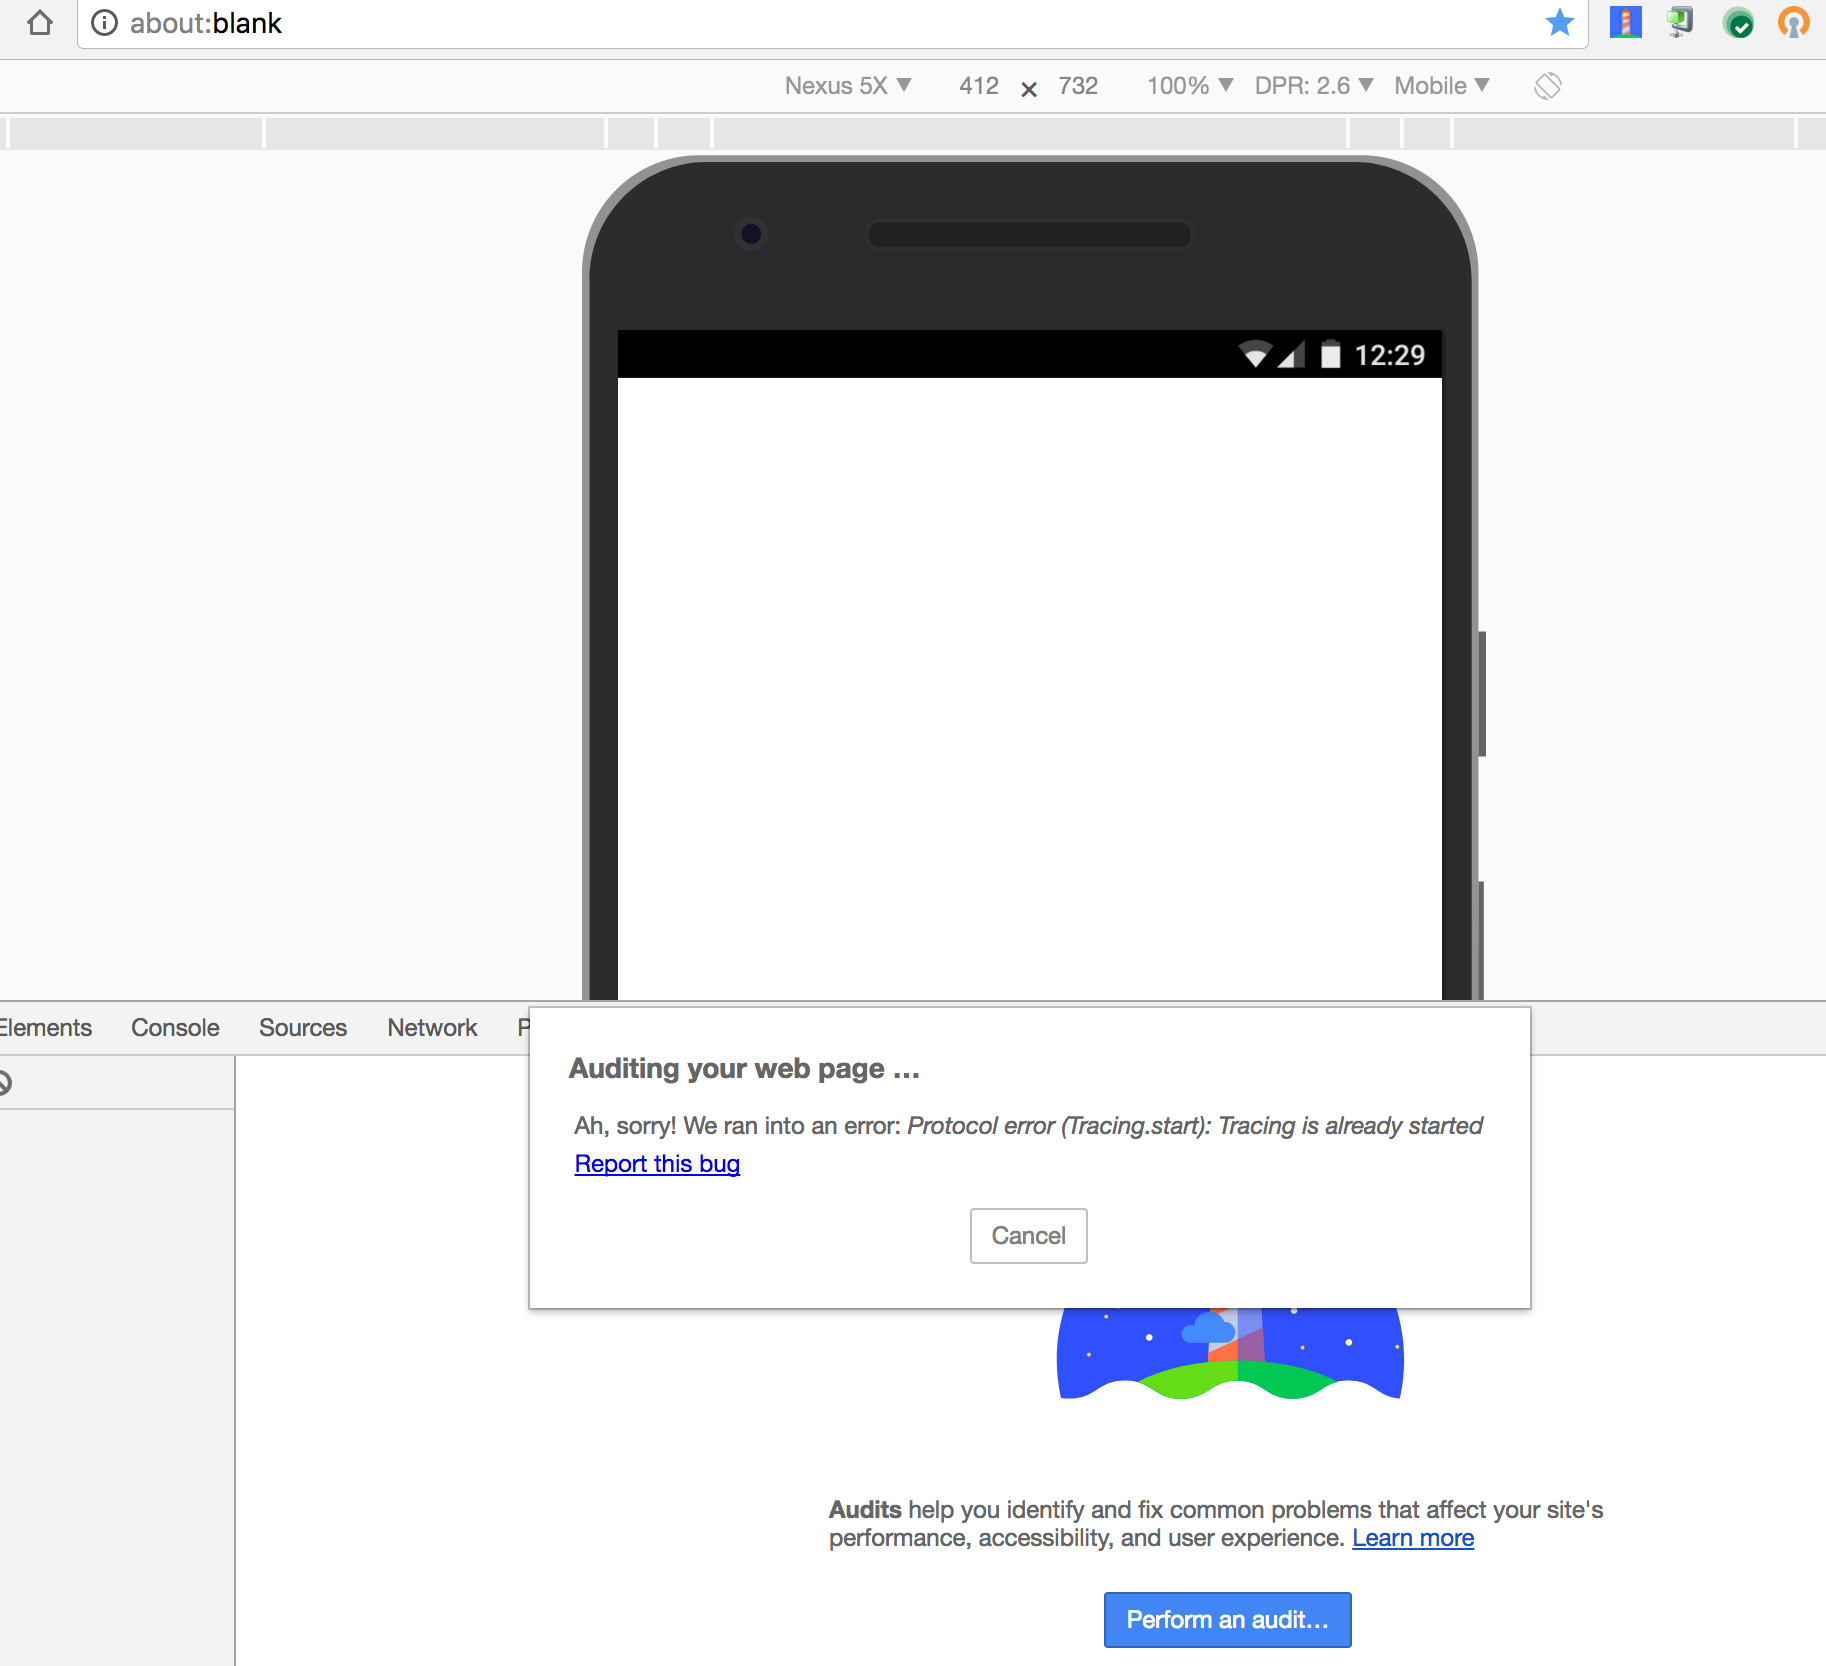
Lighthouse: ☔️ Protocol error (Tracing.start): Tracing is already started
NOTICE FOR DUPLICATE BUG FILERS: The only known fix for this is usually completely restarting the browser, and sometimes with a completely fresh profile.
Lighthouse Version: 1.2.2
Chrome Version: 57.0.2937.0
Error Message: Protocol error (Tracing.start): Tracing is already started
Stack Trace:
Error: Protocol error (Tracing.start): Tracing is already started
    at ExtensionConnection.handleRawError (chrome-extension://blipmdconlkpinefehnmjammfjpmpbjk/scripts/lighthouse-background.js:7377:11)
    at Object.chrome.debugger.sendCommand.result [as callback] (chrome-extension://blipmdconlkpinefehnmjammfjpmpbjk/scripts/lighthouse-background.js:7526:33)
    at safeCallbackApply (extensions::sendRequest:21:15)
    at handleResponse (extensions::sendRequest:74:7)
 maulanaahmadarif
All 21 comments
Can you post the URL you're trying? Is this 100℅ reproducible in stable
chrome or just canary?
On Wed, Nov 30, 2016, 8:57 PM Ahmad Arif Maulana notifications@github.com
wrote:
Lighthouse Version: 1.2.2
Chrome Version: 57.0.2937.0
Error Message: Protocol error (Tracing.start): Tracing is already
started
Stack Trace:at ExtensionConnection.handleRawError (chrome-extension://blipmdconlkpinefehnmjammfjpmpbjk/scripts/lighthouse-background.js:7377:11)
at Object.chrome.debugger.sendCommand.result [as callback] (chrome-extension://blipmdconlkpinefehnmjammfjpmpbjk/scripts/lighthouse-background.js:7526:33)
at safeCallbackApply (extensions::sendRequest:21:15)
at handleResponse (extensions::sendRequest:74:7)```—
You are receiving this because you are subscribed to this thread.
Reply to this email directly, view it on GitHub
https://github.com/GoogleChrome/lighthouse/issues/1091, or mute the
thread
https://github.com/notifications/unsubscribe-auth/AAOigCuub2MeGhEiqh0z4CF9EyMrjN1Zks5rDlOpgaJpZM4LBAOR
.
 ebidel
on 1 Dec 2016
ebidel
on 1 Dec 2016
I'm using canary right now
https://lab.ydigital.asia/precision/
maulanaahmadarif
on 1 Dec 2016
This one is hard to solve. It happens on occasion and the best solution is restarting chrome right now.
If this continues we can look into ways of forcing Chrome to stop tracing even after we've disconnected.
 paulirish
on 2 Dec 2016
paulirish
on 2 Dec 2016
for errors that are causing this, we could add an attempt to stop tracing in the gather-runner cleanup. If the error caused us to lose connection to devtools it won't work, but it may help in some cases
 brendankenny
on 2 Dec 2016
brendankenny
on 2 Dec 2016
@caseq tells me that the tracing backend should stop the trace is the protocol client has disconnected. So everything is lined up to make this work, though there may be a race condition.
I'm having trouble reproducing this bug (though I have hit it before).
If anyone can find a reliable repro for this, please comment with it.
paulirish
on 3 Dec 2016
I have a reproducible test case. Will try and reduce so you can either use it for debugging OR add it as part of the integration tests.
 gauntface
on 6 Jan 2017
gauntface
on 6 Jan 2017
Yes, I switched tabs originally and came back and it was still running, then it appeared to be running in all of my tabs, then I closed the window and now clicking the extension button gives me the error here.
ebidel
on 7 Apr 2017
crazy idea: we could always try to stop tracing before doing anything and just throw away any exception that results
 patrickhulce
on 7 Apr 2017
patrickhulce
on 7 Apr 2017
Posting here instead of falling into the dupe graveyard ☝️
Initial URL: https://my.mimeo.com/Library/Default.aspx
Chrome Version: 60.0.3112.78
Error Message: Protocol error (Tracing.start): Tracing is already started
Stack Trace:
Error: Protocol error (Tracing.start): Tracing is already started
    at callback.resolve.Promise.resolve.then._ (https://chrome-devtools-frontend.appspot.com/serve_file/@f901216ec1e383df23283fec9bc8f4e8b67aa0fb/audits2_worker/audits2_worker_module.js:515:305)
    at <anonymous>
 skylerwshaw
on 31 Jul 2017
skylerwshaw
on 31 Jul 2017
Ok, I got this in DevTools and now I can't get out of this state:
Ironically, it's ended up on about:blank. So I wonder if that's how a lot of https://github.com/GoogleChrome/lighthouse/issues/2362 is/was happening.
ebidel
on 12 Aug 2017
FWIW @ebidel the running theory for ending up on about:blank with "Unable to load the page" is the bug in DevTools for auditing the URL of an iframe instead of the main page.
patrickhulce
on 12 Aug 2017
Not a fix, but to keep you working... I got back on track after quitting and re-launching Chrome. Not any individual tab or even profile (I usually have a few profiles running with many tabs each). But actually restarting Chrome itself. Then I could audit my site again.
 adavis0000
on 8 Sep 2017
adavis0000
on 8 Sep 2017
Can confirm @adavis0000 solution. Chrome needs to restart completely, not just close current profile running in chrome.
 tobiastornros
on 13 Sep 2017
tobiastornros
on 13 Sep 2017
Seems like it fails if I'm starting two different traces at the same time? I did it from two different tabs.
 jontejj
on 28 Sep 2017
jontejj
on 28 Sep 2017
I had the panel open in another tab, didn't run it, then opened the panel in a second tab and it fails
 Haroenv
on 12 Nov 2017
Haroenv
on 12 Nov 2017
Seems like this happens frequently enough. Does it make sense to increase the priority and finally fix this?
 jamesshannon
on 31 Jul 2018
jamesshannon
on 31 Jul 2018
@jamesshannon it does yes. :)
paulirish
on 19 Sep 2018
Here's an attached screen shot from www.yahoo.com site audit. Tested on Version 73.0.3681.0 (Official Build) canary (64-bit). The error message says "Something went wrong with recording the trace over your page load. Please run Lighthouse again.", in case that helps. I've quit/closed the app, and restarted, and it still happens.

 mssodhi
on 24 Jan 2019
mssodhi
on 24 Jan 2019
@mssodhi thanks for reporting. I can share that we are aiming to push 4.0.0 to the next Chrome (not yet in Canary), and in doing so I see that this tracing error no longer happens. Could be that next Canary will have this issue resolved.
 connorjclark
on 24 Jan 2019
connorjclark
on 24 Jan 2019
@Hoten thanks for the update!
mssodhi
on 24 Jan 2019
We believe this is primarily due to Chrome tracing in the background and is fixed with chrome-launcher v0.13.3 (https://github.com/GoogleChrome/chrome-launcher/pull/203).
If you cannot use that version of chrome-launcher because you're running from DevTools or another channel make sure Chrome is started with the following flag --force-fieldtrials=*BackgroundTracing/default/.
patrickhulce
on 26 Aug 2020
Related issues
 devrsi0n
·
3Comments
devrsi0n
·
3Comments
 Simply007
·
3Comments
Simply007
·
3Comments
 nl-igor
·
3Comments
nl-igor
·
3Comments
 sanprieto
·
3Comments
sanprieto
·
3Comments
 timj2
·
3Comments
timj2
·
3Comments
Most helpful comment
Here's an attached screen shot from www.yahoo.com site audit. Tested on Version 73.0.3681.0 (Official Build) canary (64-bit). The error message says "Something went wrong with recording the trace over your page load. Please run Lighthouse again.", in case that helps. I've quit/closed the app, and restarted, and it still happens.
