Less.js: Version 3.10.x uses significantly more memory and is significantly slower than 3.9.0
Our builds recently started failing because we run about 80 Less builds in parallel during our project's build process and the new version of Less.js uses so much memory that Node crashes. We traced the crash to upgrading from Less.js from 3.9.0 to 3.10.3.
I changed our Less script to compile the files sequentially (building 2 files at a time) and sampled Node's memory usage during the process and got the following results:
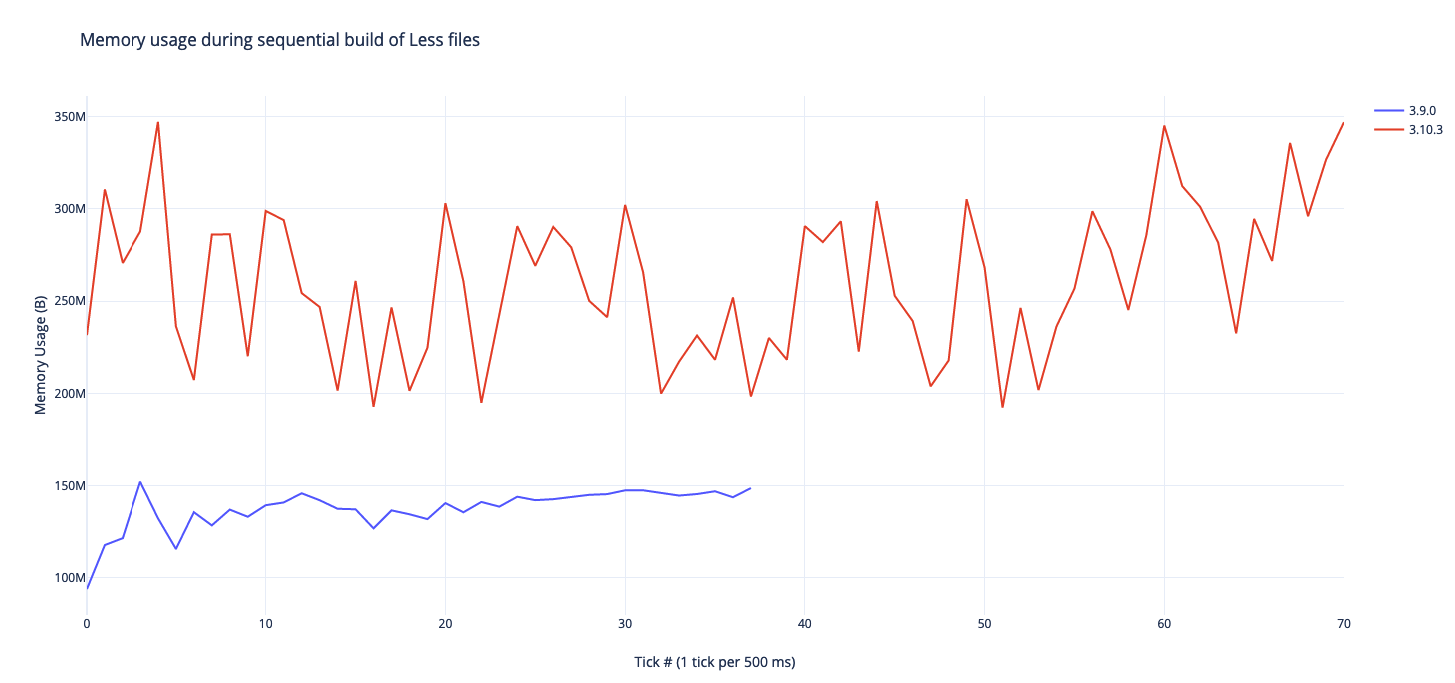
Less.js seems to use 130% more memory now and takes about 100% longer to compile for us.
Just wondering if you've benchmarked Less.js and whether you see similar results
 PatSmuk360
All 95 comments
That's odd. What is your Node version?
 matthew-dean
on 13 Sep 2019
matthew-dean
on 13 Sep 2019
@PatSmuk360 Could you test and get a memory profile of 3.10.0 and see if it differs?
matthew-dean
on 13 Sep 2019
We're running the latest version of 10 (10.16.3).
Heap snapshot before:

Heap snapshot after:

PatSmuk360
on 16 Sep 2019
Also I tried on Node 12.10.0 and it seems a lot worse, hitting 587 MB of memory usage at one point in the sequential build.
PatSmuk360
on 16 Sep 2019
CPU profile before:
CPU-20190916T133934.cpuprofile.zip

CPU profile after:
CPU-20190916T134917.cpuprofile.zip

PatSmuk360
on 16 Sep 2019
@PatSmuk360 So, the long and short is that the difference between those versions is that the codebase was transformed to ES6 syntax. Which isn't technically a breaking change, which is why it wasn't a major version.
BUT... my suspicion is that some of the Babel conversions for things like object / array spread syntax are less efficient than the more verbose ES5 versions. That's why I was asking if you could test 3.10.0, because originally I was exporting a transpiled package that was compatible with Node 6 and up, but it broke an integration with a particular library that couldn't handle class syntax. So I went down to Node 4 with no class constructs.
If we can figure out exactly which ES5 transform is not performing well, we could theoretically more granularly set those Babel export settings to a more performant export.
matthew-dean
on 17 Sep 2019
@PatSmuk360 Incidentally, what's that split function that's getting so much time?
matthew-dean
on 17 Sep 2019
@matthew-dean That seems to be the String.prototype.split. If you open the profile in your chrome devtools you can see all the data color coded. I'm trying to alter the profile to link to https://cdn.jsdelivr.net/npm/[email protected]/dist/less.cjs.js as its source so it is easier to inspect the bottlenecks. Is there a source map available for the *.cjs.js to *.js file? The https://cdn.jsdelivr.net/npm/[email protected]/dist/less.min.js.map file seems to map the .min file to the ES6 source. Maybe we can feed the source map to the dev tools so that we can figure out where transpilation causes bottlenecks.
 kevinramharak
on 17 Sep 2019
kevinramharak
on 17 Sep 2019
This line in specific https://github.com/less/less.js/blob/cae5021358a5fca932c32ed071f652403d07def8/lib/less/source-map-output.js#L78 seems to have an high amount of cpu time. But considering the operation it performs that does not seem out of place to me.
kevinramharak
on 17 Sep 2019
I don't have much experience with heap profiles, but the thing that stands out to me is the increase in the amount of (closures), (system), (array), system / Context. Trying to tie that to the cpu profile it seems that the increase of these objects results in a massive increase in time spent garbage collecting.
kevinramharak
on 17 Sep 2019
@kevinramharak In general, converting an AST like Less's with _n_ depth into a serialized, flatted output tree like CSS involves lots of temporary object creation. So, what could be happening is that with certain transforms, it's adding an additional _x_ amount of objects. Even temporarily, you can get an exponential effect where each node creating even just 2-3x the objects, multiplied by the number of nodes multiplied by the number of times it has to flatten rules... I could see it adding up. We were probably naive in general to essentially think of ES6 syntax as essentially syntactic sugar of ES5 syntax. (JavaScript developers are probably guilty of this in general.) In reality, transpiling newer syntax can create ES5 patterns that are not very performant. For 99% of devs, this isn't a big deal because they're not iterating through that code hundreds or thousands of times per second. But this is my guess as to what's happening, because there were no other major changes.
matthew-dean
on 17 Sep 2019
@kevinramharak Re: the source lines - this is because the original Less parser doesn't track lines / columns of input, so when source mapping was added, it needed to essentially chunk input into lines to figure out how it should map to the original source. This won't be an issue in 4.x+, but that makes sense why it would spend a lot of time there now.
matthew-dean
on 17 Sep 2019
I'm using less.min.js in a browser and 3.10.3 is two times slower than 2.7.3 I was using before. Both in Chrome and Firefox.
 alecpl
on 7 Oct 2019
alecpl
on 7 Oct 2019
@PatSmuk360 Can you check out this branch? https://github.com/matthew-dean/less.js/tree/3.11.0
In short, Babel's transpilation to ES5 is kinda awful, and uses tons of Object.defineProperty calls to transpile classes. I switched transpilation to TypeScript, which has much saner output of function prototypes.
This is all fine and dandy, but after doing this, Less's browser tests won't run because it uses the very old and outdated PhantomJS, and thus far, no one (including me) has been able to successfully migrate the tests off of PhantomJS onto Headless Chrome.
But, one problem at a time: if the dist source on that branch doesn't have the memory issues, then maybe we could tackle the mess that is browser testing.
matthew-dean
on 8 Oct 2019
I've managed to migrate Less browser tests to Headless Chrome, but in terms of performance / stability, I need a lot of feedback from users before it's safe to merge, because of changing the transpilation pipeline entirely from Babel to TypeScript.
Current branch(es) can be found here: https://github.com/less/less.js/pull/3442
matthew-dean
on 9 Oct 2019
Still 2x slower than 2.7.
alecpl
on 16 Oct 2019
@alecpl That's good information, but really I want to know if 3.11.0 is an improvement over 3.10.
matthew-dean
on 16 Oct 2019
The odd thing about this is that, _in theory_, the original Less code was converted with Lebab, which should be the opposite of Babel. Which means that ES5 -> ES6 -> ES5 should be nearly identical, but that's obviously not the case. So I'll need to investigate (unless anyone else has the time, which is welcome support) just how the ES6->ES5 code differs from the original ES5 code.
matthew-dean
on 17 Oct 2019
@alecpl
So, I've run a variety of tests, and spent the time doing benchmarking of 3.11.0 vs. 3.10.3 vs. 3.9.0 vs. 2.7.3 in Headless Chrome
I've found no evidence that the Less compiler is slower for any version, let alone 2x slower. It could still be true that 3.10.0 has more memory overhead because of the transpilation settings, and maybe if a system was constrained for space and doing more memory swaps or more GC as a result, it might result in a slowdown? But I can't verify it.
You can test yourself running grunt benchmark on the 3.11.0 branch. They may report different numbers on an individual run, but if you run enough times, you should see the times are roughly equal. So I don't know where you are getting your data.
@PatSmuk360 Have you been able to test the memory overhead of 3.11.0?
matthew-dean
on 18 Oct 2019
I do not build your code by myself. I don't use nodejs. I just take less.min.js file from dist folder for two different versions I mentioned and use them on my page. Then in console I see timings printed by Less code. My less code uses multiple file and the output file is about 100kB of minified css. That's a "real life" benchmark. I'm talking about Roundcube code.
Chrome is much faster than Firefox, but in both the difference between versions is similar.
alecpl
on 19 Oct 2019
@alecpl Hmm....maybe it's a particular difference for that particular Less code. It's true that the benchmark is arbitrary. If I have time, I'll add those Less files to benchmarking.
matthew-dean
on 19 Oct 2019
This issue has been automatically marked as stale because it has not had recent activity. It will be closed if no further activity occurs. Thank you for your contributions.
![stale[bot] picture](https://avatars.githubusercontent.com/in/1724?v=4&s=40) stale[bot]
on 16 Feb 2020
stale[bot]
on 16 Feb 2020
Just wanted to post a quick update: I tried 3.11.1 and it was just as slow as 3.10.3. I'll see if I can cook up a representative benchmark for testing/profiling this.
PatSmuk360
on 26 Feb 2020
I've upgraded to 3.11.1 and have the same memory consumption problems now.
A modestly sized project is taking ~600MB RAM to build through webpack and less-loader.
I've taken a heap allocation timeline resulting in this;

Something is causing crazy huge allocations kept alive by Ruleset.
[EDIT]
I'm downgrading to 3.9 and grabbing a heap alloc timeline from that. Going to see if I spot anything radically different.
 rjgotten
on 4 May 2020
rjgotten
on 4 May 2020
@matthew-dean
Found a hint for you.
In 3.11 one of the listed retainers for RuleSet is the ImportManager.
In 3.9 this is _not the case_.
If everything is kept alive by ImportManager and ImportManager is a singleton across the entire compilation process. Well... yes; that would significantly inflate memory use because nothing can be garbage collected. Not even intermediary rulesets.
rjgotten
on 4 May 2020
@rjgotten Hmm...... if an object has a reference to another object, why would that prevent GC? I mean, technically, all objects retain references to the public API nodes via the prototype chain. It would only prevent GC if the reverse is true i.e. some object retaining references to every ruleset instance.
matthew-dean
on 4 May 2020
You seem to have misunderstood.
When "A is a retainer of B," it means A is retaining references to B which prevent B's garbage collection. So when I wrote ImportManager is listed as a retainer of Ruleset I expressed exactly what you also conclude: ImportManager holds references to Ruleset instances, which prevents GC of those Ruleset instances.
rjgotten
on 4 May 2020
@rjgotten Oh it does? I wonder how that change got in there. Strong possibility I'm to blame, or there's something about the ES6 refactor that did it. But yeah, that could definitely do it! Thanks for investigating!
matthew-dean
on 5 May 2020
Okay, what about this radical idea.
I created a branch with cherry picking everything EXCEPT the ES6 conversion. This wasn't simple, and this would nuke all that work, but if a Babelified / Typescript'd file can't outperform the existing native JS, then it's just not worth it.
I have no idea how we'll reconcile the git history, but here's the branch -> https://github.com/less/less.js/tree/release_v3.12.0-RC1. Nuking the conversion is a big deal, so I'd think this branch would some real solid benchmarking to compare.
matthew-dean
on 5 May 2020
I wonder how that change got in there. Strong possibility I'm to blame, or there's something about the ES6 refactor that did it. But yeah, that could definitely do it! Thanks for investigating!
It's certainly weird. From what I was able to decipher, it looks like ImportManager somehow ends up a retainer for Rulesets through gluecode/polyfill added by the ES6 conversion.
I wonder if there's a solution here that meets ends midway. I.e. retain the ES6 build for Node.js but also have a transpiled browser target. It would be an enormous loss to do away with the code clarity that the ES6 conversion adds. 😢
rjgotten
on 5 May 2020
@rjgotten
It would be an enormous loss to do away with the code clarity that the ES6 conversion adds.
It may not be as bad as it seems, for two reasons:
- The rollup config still exists, and could be pulled from a commit if someone wants to research it.
- I've been actively working on a TypeScript-based Less 4.0 for some time. I'd rather spend my time on that than track down this performance regression. It's a ground-up refactor, so it's not close by any means, but by the nature of TS, it's unlikely to have these one-off object mutations that hold onto references and prevent GC. And the code is a lot clearer to follow. So there's that.
matthew-dean
on 5 May 2020
It seems a _bit_ heavy-handed to roll everything back to ES5 just to fix this issue, but it’s understandable given a re-write is in progress. Still, we should consider for how long we’d have to live with this decision. As @rjgotten mentioned, we’d be loosing a lot of code clarity, and if v4 is still a ways away, then I’d say let’s try investigating a bit more before taking the ES5 nuclear option—especially since this issue (while a bad one) doesn’t seem to be a dealbreaker for most users.
Is there anyone who’s experienced this that would be willing to share their code? It would be great if we could benchmark using a real-world project so we can be sure whether changes are helping or not. If we could get that then I’d be willing to help try and narrow down where the bottleneck might be.
@matthew-dean, on a side note, did you try compiling with Babel in loose mode to see if it produced any saner-looking code?
 seanCodes
on 21 May 2020
seanCodes
on 21 May 2020
@seanCodes I'm all for not taking the nuclear option, if someone has the time to investigate just how / why Rollup / Typescript's output performs worse, and has these extra memory effects. It would partly be a matter of looking at the original code, and comparing to the output, and looking for clues.
One guess I have is that some of the destructuring logic has a lot of object-creation boilerplate.
Basically, someone would have to volunteer to own this issue.
@matthew-dean, on a side note, did you try compiling with Babel in loose mode to see if it produced any saner-looking code?
@seanCodes The code is compiled using TypeScript, not Babel. My idea was to gradually add in JSDoc types to make type-checking stronger, but the TS in v4 is enough of a re-write, I'm not sure if that is necessary. So, someone could experiment with Babel v. TypeScript (and different settings for each) to see if Babel produces more performant code. Just be very conscious of this issue, which was caused by initially producing a non-ES5 build for Node.js: https://github.com/less/less.js/issues/3414
matthew-dean
on 21 May 2020
@seanCodes Also, I still have found it hard to VERIFY the performance difference. No one has produced a PR / steps to PROVE, definitively, the difference in performance. There are number of anecdotes in this thread, but without reproducible code or steps, I'm not sure how someone investigates this. Ideally, there would be a PR that launches a profiling tool (via Chrome debugger or otherwise) to output a number on a system, averaging over a number of tests. So because this, thus far, is not 100% reproducible, as far as anyone has been able to offer reproduction steps, that's partly why I personally didn't want to go down that rabbit hole. (In other words, feedback of "I used Chrome debugger" is not a set of reproduction steps. It's useful to know about, but it doesn't help someone investigate. We need to know what we are tracking and why / what outcome is expected.)
So, if people want to improve Less performance using the current codebase, it's going to take probably multiple volunteers, and one person to own this issue.
matthew-dean
on 21 May 2020
Personally, I haven't seen much of a performance difference as in _speed_ but the difference in memory consumption is astounding and seems to correlate with amount of imports, which my cursory heap analysis seems to suggest as tied to the issue as well.
If that's correct, ~you~ anyone should be able to jerry-rig together a viable test project as long as it consists a lot of imported files where each contains some rulesets, to see the difference as well.
rjgotten
on 22 May 2020
@rjgotten
If that's correct, you should be able to jerry-rig together a test project with lots of imported files, each containing some rulesets and see the difference as well.
The "you" is the important bit here. 😉
matthew-dean
on 22 May 2020
The "you" is the important bit here. 😉
Unfortunate choice of words. I mean that in the general sense - i.e. "anyone."
I would dig in further myself, but I've already got too many plates spinning currently.
rjgotten
on 23 May 2020
@rjgotten Can you give me a better idea of what “a lot of imported files” might be? Would 100 separate files do it or are we talking 1000?
Also, how did you first notice the issue? Did a build fail due to memory consumption or did you happen to be looking at memory usage? Or did you notice your machine slowing down?
I haven’t attempted to replicate this yet but I’m still hoping to learn what exactly to look for so that I don’t have to resort to guess-and-check.
seanCodes
on 5 Jun 2020
100 or so would do it. That's around the size of the real-life project on which I noticed the issue.
I first noticed it when a build running on our corporate CI environment started failing. We run those inside Docker containers with memory restrictions configured.
rjgotten
on 5 Jun 2020
@rjgotten Do we still have the memory issue on 3.11.3? I removed any caching (referencing) of the AST within imports in a previous release, so if imports was being held, and AST trees were being held within that, then that would increase memory usage, but if we drop the trees from being held, does that solve it?
matthew-dean
on 6 Jun 2020
@matthew-dean Yes, the issue is still present on 3.11.3.
I'll try to create a proof of concept but I have a lot on my plate. I've put this on my to do list once I get some extra time.
PatSmuk360
on 9 Jun 2020
@matthew-dean I want to test this on a relatively big project, which was previously failing. Anything I need to know? Should I use this branch, https://github.com/less/less.js/tree/release_v3.12.0-RC1 ?
 nfq
on 21 Jun 2020
nfq
on 21 Jun 2020
@nfq You can try it, but the prevailing wisdom in this thread is not to blow up the ES6 conversion, which is what that branch does, and instead get more information to properly diagnose the issue.
matthew-dean
on 21 Jun 2020
Incidentally, I tried inspecting the less object during compilation in an attempt to find any persistent objects, and couldn't find any. 🤷♂️
matthew-dean
on 25 Jun 2020
I'm experiencing performance issues too. For a same test suite:
| Version | Time |
| -- | -- |
| v3.9.0 | ~1.6s |
| v3.10.0~v3.11.1 | ~3.6s |
| v3.11.2+ | ~12s |
Apart from 3.9.0 → 3.10.0 discussed here, there seems to be a significant performance degradation at v3.11.2. This change in the changelog seems to be suspicious:
3498 Remove tree caching in import manager (#3498)
 Justineo
on 12 Aug 2020
Justineo
on 12 Aug 2020
Same for me.
Timings for identical builds (all on node 10.19.0):
- v3.9: 29.9 sec
- v3.10: 76.0 sec
- v3.12: 89.3 sec
 jrnail23
on 16 Sep 2020
jrnail23
on 16 Sep 2020
@jrnail23
Do you have a repo that can demonstrate those results?
matthew-dean
on 16 Sep 2020
@matthew-dean I have one for https://github.com/less/less.js/issues/3434#issuecomment-672580467: https://github.com/ecomfe/dls-tooling/tree/master/packages/less-plugin-dls (It's a monorepo, which includes a Less plugin.)
Justineo
on 16 Sep 2020
Sorry, @matthew-dean, I don't. Those results are from my employer's product.
jrnail23
on 16 Sep 2020
Those results are from my employer's product.
Same reason I can't provide any files either. 😞
rjgotten
on 18 Sep 2020
@rjgotten @jrnail23 @Justineo - Just curious, do you have a number of cases where the same import is imported multiple times in different files?
matthew-dean
on 25 Sep 2020
In my case we have a plugin that injects an @import statement and provides a bunch of custom functions. The imported file imports other parts of the project which will finally produce 1000+ Less variables.
Justineo
on 25 Sep 2020
@matthew-dean, we've got a base.less file that imports common things (e.g., color variables, typography, etc.).
Some quick grepping of our app shows that a base.less reference (i.e., @import (reference) "../../../less/base.less";) gets imported by 66 other component/feature-specific less files, and some of those files may also import other component/feature-specific less files (which may themselves reference base.less).
Interestingly, we apparently also have another less file that (probably accidentally?) imports itself as a reference.
jrnail23
on 25 Sep 2020
@rjgotten @jrnail23 @Justineo - Just curious, do you have a number of cases where the same import is imported multiple times in different files?
For me, that's a 'yes.' The project that I first experienced problems on is a skinnable solution that makes use of a centralized variables file which is included in all others. Moreover, we use a component-based design where we have mixin factories that produce e.g. certain types of buttons, font icons, etc. and parts of those are imported in several files as well.
Basically; every dependent is set up to strictly import its dependencies and we rely on the Less compiler to de-dupe and sequence the imports into correct order and ensure correct CSS output.
rjgotten
on 25 Sep 2020
@rjgotten
I posted and deleted it (because I thought I had figured it out, but I still couldn't replicate it), there still aren't any steps to reproduce in what people are reporting, including on what process.
Even something as simple as this:
In 3.11 one of the listed retainers for RuleSet is the ImportManager.
I can find no evidence of that, but I also don't know how you were able to determine it. I'm not familiar enough with Chrome DevTools to know how one could determine such a thing as what is retained by what, and that's a vague enough topic that Google hasn't helped me. Like, are people attaching to the Node process? Running it in the browser and setting breakpoints? What are the steps?
In short, in the year that this issue has been opened, none of the reports have steps to reproduce. I'm sure all of these anecdotes mean SOMETHING, but how did YOU determine what YOU found? Or can you think of a setup that will demonstrate this? I'd like to help figure it out, but I don't know how to reproduce it.
matthew-dean
on 26 Sep 2020
@Justineo On your repo, what steps did you take to determine either memory size or time to compile? What were you using to measure?
matthew-dean
on 26 Sep 2020
@Justineo Since you pointed out the cache removal (which was maybe a bad idea), can you test this branch and see if it helps your build speed? https://github.com/less/less.js/tree/cache-restored
matthew-dean
on 26 Sep 2020
Just to give some updates on today's experimentation / testing:
Grunt's shell:test times
- Less 3.9 -- 1.8s
- Less 3.12 (Babel-transpiled to ES5) -- 9.2s
- Less 3.12 (Babel-transpiled to ES6) -- 3.1s
- Less 3.12 (TypeScript-transpiled to ES5) -- 3.2s
So, I think the long and short is that transpiled code is always slower, and we were naive to think otherwise. I'm kind of surprised since transpilation is now so "standard" in the JavaScript world. Is there any other research that backs this up?
matthew-dean
on 26 Sep 2020
@Justineo On your repo, what steps did you take to determine either memory size or time to compile? What were you using to measure?
npm run test will produce the total time elapsed. And in other projects we are experiencing OOM when switched to 3.12.
Justineo
on 27 Sep 2020
If we look at TypeScript generated code, we get something like:
Object.defineProperty(exports, "__esModule", { value: true });
var tslib_1 = require("tslib");
var node_1 = tslib_1.__importDefault(require("./node"));
var variable_1 = tslib_1.__importDefault(require("./variable"));
var property_1 = tslib_1.__importDefault(require("./property"));
var Quoted = /** @class */ (function (_super) {
    tslib_1.__extends(Quoted, _super);
    function Quoted(str, content, escaped, index, currentFileInfo) {
        var _this = _super.call(this) || this;
        _this.escaped = (escaped == null) ? true : escaped;
        _this.value = content || '';
        _this.quote = str.charAt(0);
        _this._index = index;
        _this._fileInfo = currentFileInfo;
        _this.variableRegex = /@\{([\w-]+)\}/g;
        _this.propRegex = /\$\{([\w-]+)\}/g;
        _this.allowRoot = escaped;
        return _this;
    }
vs:
var Node = require('./node'),
    Variable = require('./variable'),
    Property = require('./property');

var Quoted = function (str, content, escaped, index, currentFileInfo) {
    this.escaped = (escaped == null) ? true : escaped;
    this.value = content || '';
    this.quote = str.charAt(0);
    this._index = index;
    this._fileInfo = currentFileInfo;
    this.variableRegex = /@\{([\w-]+)\}/g;
    this.propRegex = /\$\{([\w-]+)\}/g;
};
So my guess is that all those extra function definitions and calls add up, over time? Unless this is a red herring, but I don't know what else to attribute this to except transpilation. What I don't understand is why TS can't produce code closer to the original.
matthew-dean
on 27 Sep 2020
UPDATE:
If I try to put the 3.9 tests on par with what's in 3.12, then I essentially get 1.2s vs. 1.3s. So I'm not sure anymore about this difference because the tests have changed. It would have to be run against the exact same less files.
@Justineo @rjgotten I've pushed a few TypeScript tweaks to maybe make a more efficient build. Do you want to build and try that branch? https://github.com/less/less.js/tree/cache-restored
matthew-dean
on 27 Sep 2020
@matthew-dean 👍 Thanks! I’ll try it out later today.
Justineo
on 27 Sep 2020
I've tested the cache-restored branch and it's much faster than v3.11.2+, at about the same speed as v.3.1.0~3.11.1.
Justineo
on 28 Sep 2020
@Justineo
I've tested the cache-restored branch and it's much faster than v3.11.2+, at about the same speed as v.3.1.0~3.11.1.
Well, that's promising. Let's get some feedback from @rjgotten @jrnail23 and others in this thread. That cache removal was after this thread was posted (3.11.2); in fact that was an attempt to remove some of the memory overhead, but in instances where you're importing the same file several times, it could definitely have made things worse.
So, in short, I still am not sure about the original issue or its cause (other than SOMETHING that happened in the code conversion), and I'd be curious to know if this branch still has those issues, but as I mentioned before, there aren't clear repro steps so I'm not sure.
matthew-dean
on 28 Sep 2020
@matthew-dean, I'm having a bit of trouble trying to use the cache-restored branch (I'm not quite clear on what needs to be done to use it locally, as npm link fails me).
Can you publish a canary/pre-release version that I can try?
jrnail23
on 28 Sep 2020
@jrnail23
I think this worked. Try removing Less and installing with npm i [email protected]+84d40222
matthew-dean
on 29 Sep 2020
@matthew-dean, I just tried that version, and it's still bad for me.
For fresh webpack builds (no caching), it takes 62.4 sec for v3.9, but 121 sec for v3.13.1.
For cached builds, v3.9 takes 30 sec, and v3.13.1 takes 83-87 sec.
jrnail23
on 29 Sep 2020
@jrnail23 Can you try removing all node modules and installing [email protected]+b2049010
matthew-dean
on 5 Dec 2020
Less 3.9 Benchmark:

Less 4.0.1-alpha.0:

Less 4.0.1-alpha.2:

matthew-dean
on 5 Dec 2020
@Justineo @rjgotten Can you try this also?
matthew-dean
on 6 Dec 2020
@jrnail23 @Justineo @rjgotten
Note that this is a 4.0 build so you might encounter errors if your code has these breaking changes:
- Parentheses are required for mixin calls (e.g.
.mixin;is not allowed) - Less's default math mode is now parens-division, so slashes (intended as math) need to be in parentheses
matthew-dean
on 6 Dec 2020
So, while I'm now much more optimistic I've fixed the issue, based on the latest benchmarks, I have yet to figure out why this issue has been happening. If performance holds up for everyone else, I can give a run-down of how I finally narrowed down the issue and what I found. In other words, I think I found _where_ the issue is/was, but not necessarily why.
matthew-dean
on 6 Dec 2020
The result of the same test suite as https://github.com/less/less.js/issues/3434#issuecomment-672580467:
| Version | Time |
| -- | -- |
| v3.9.0 | ~1.6s |
| v3.10.0~v3.11.1 | ~3.6s |
| v3.11.2+ | ~12s |
| 4.0.1-alpha.2+b2049010 | ~1.6s |
I can confirm that for my specific test suite, the performance level has improved to as fast as v3.9.0. Very much appreciated Matt! While I'm not sure about the break change on math mode. Changing this may lead to breakage of many of our applications so we may be stuck on v3.9.0 even the performance issue is solved.
Justineo
on 6 Dec 2020
@Justineo
While I'm not sure about the break change on math mode.
You can explicitly compile in math=always mode to get previous math behavior. It's just a different default.
matthew-dean
on 6 Dec 2020
Breakdown of the issue
TL;DR - Beware of the class pattern
The problem was in the transpilation of classes in both Babel and TypeScript. (In other words, both had the same performance issues with the transpiled code, with Babel being slightly worse.) Now, years ago, when the class pattern was introduced, I was told--and until this issue, believed--that class inheritance in JavaScript is syntactic sugar for functional inheritance.
In short, it isn't. _(Edit: well.... it is and it isn't. It depends on what you mean by "inheritance" and how you've defined it as you'll see shortly.... i.e. there are several patterns to create "inheritance" in the prototype chain in JavaScript, and classes represent just one pattern, but that pattern is somewhat different from all the others, hence TS's / Babel's need for helper code to "mimic" this pattern using specialized functions.)_
Less code looked like this:
var Node = function() {
  this.foo = 'bar';
}

var Inherited = function() {
  this.value = 1;
}
Inherited.prototype = new Node();

var myNode = new Inherited();
Now say you wanted to re-write this using "modern" JS. In fact, you can automate this process, which I did, but either way I would have written it the same, which was:
class Node {
  constructor() {
    this.foo = 'bar';
  }
}
class Inherited extends Node {
  constructor() {
    super();
    this.value = 1;
  }
}
var myNode = new Inherited();
Same thing, right? Actually, no. The first one will create an object with a property of { value: 1 }, and on its prototype chain, it has an object of { foo: 'bar' }.
The second one, because it will call the constructor on both Inherited and Node, will create an object with a structure like { value: 1, foo: 'bar' }.
Now, for the _user_, this really doesn't matter, because you can access both value and foo from myNode in either case. _Functionally_, they appear to behave the same.
Here's where I enter pure speculation
From what I remember in articles about JIT engines like V8, object structures are actually very important. If I create a bunch of structures like { value: 1 }, { value: 2 }, { value: 3 }, { value: 4 }, V8 creates an internal static representation of that structure. You're essentially storing the structure+data once, and then the data 3 more times.
BUT if I add different properties to this each time, like: { a: 'a', value: 1 }, { b: 'b', value: 2 }, { c: 'c', value: 3 }, { d: 'd', value: 4 }, then those are 4 different structures with 4 datasets, even if they were created from the same set of original classes. Every mutation of a JS object de-optimizes data lookups, and a class pattern that's transpiled into functions causes (maybe) more-unique mutations. (I honestly have no idea if this is true for native class support in browsers.)
AFAIK, what's also true is that the more properties you have on an object, the longer that an individual property lookup takes.
Again for end users, this rarely matters because JS engines are so fast. Buuuuut say you're maintaining an engine that creates and looks up properties / methods on LOTS of objects as quickly as possible. (Ding ding ding.) Suddenly these small differences between the way TypeScript / Babel "extend" objects and native functional prototypal inheritance adds up very quickly.
I wrote a bare-bones implementation of a Node and an inheriting function, using the old Less syntax and the class pattern transpiled with TS. Right out of the gate, the inherited node consumes 25% more memory / resources, and that's BEFORE any instances of the inherited node have been created.
Now consider that some nodes inherit from other nodes. That means, the in-memory representation of the classes starts to multiply, as does their inherited instances.
Again, this is speculation
I have to emphasize taking all this with a grain of salt, because I've never heard of a conversion to classes being this disastrous for performance. What I _think_ is happening is that there's some special combination of object / instance lookups that Less is using that is seriously de-optimizing the JIT. _(If some JavaScript engine expert knows why transpiled classes perform so much worse than native JS inheritance methods in this case, I would love to know.)_ I tried to create a performance measure of creating thousands of inherited objects using both methods, and I could never see a consistent difference in performance.
So, before you walk away with "classes in JavaScript are bad", it could be some other really unfortunate pattern in the Less codebase coupled with the difference in transpiled classes vs. native JS that created this drop in performance.
How I finally figured it out
Honestly, I never ever suspected the class pattern. I knew that the original ES5 code ran faster than the reverse-Babelified code, but I suspected something around arrow functions or spread syntax somewhere. I still had the up-to-date ES5 branch, so one day I decided to run lebab again, and only use these transforms: let,class,commonjs,template. That's when I discovered it again had performance problems. I knew it wasn't string templating or let-to-var; I thought maybe requires-to-imports did something so I played with that for a while. That left classes. So on a hunch, I rewrote all the extended classes back to functional inheritance. Bam, performance was back.
A cautionary tale
So! Lesson learned. If your project is on old ES5 code, and you're craving that "modern" Babel-ified or TypeScripted goodness, remember that whatever you transpile, you didn't write.
I was still able to re-write classes into something more "class-like", with a slightly more maintainable pattern, but more or less retaining Less node's original functional inheritance pattern, and I'll be leaving a strong note in the project for a future maintainer to never do this again.
matthew-dean
on 6 Dec 2020
You can explicitly compile in math=always mode to get previous math behavior. It's just a different default.
I’m aware of this. We have many Less codebases across many different teams so break changes even in default compilation options would increase communication costs. I’m not sure whether the benefits are worth the breakage.
Justineo
on 7 Dec 2020
Thank you for the detailed breakdown!
I saw the usage of Object.assign in the compiled output, which means it only works in browsers that support native ES class syntax unless polyfills are now required. So can we just use the native syntax without transpiling down to ES5 if we intend to drop support for older environments (eg. IE11, Node 4, ...)?
At the same time, I think it's better if we can separate the fix of performance degradation and the breaking changes, which means to land the performance fix in v3 and include the breaking changes only in v4.
Justineo
on 7 Dec 2020
@matthew-dean
The fact that ES classes are the culprit is crazy scary.
Thanks for the elaborate breakdown.
Goes to show: _composition over inheritance_ 😛
Though FYI; if you want a cleaner protypal inheritance chain you really should do it a bit different than your example.
If you use Object.create like this:
var Node = function() {
  this.foo = 'bar';
}
Node.prototype = Object.create();
Node.prototype.constructor = Node;

var Inherited = function() {
  Node.prototype.constructor.call( this );
  this.value = 1;
}
Inherited.prototype = Object.create( Node.prototype );
Inherited.prototype.constructor = Inherited;

var myNode = new Inherited();
then you flatten the properties onto the instances themselves which then share the same shape; the prototypes share shape; _and_ you avoid having to crawl up the prototype chains for each property access. 😉
rjgotten
on 7 Dec 2020
@Justineo
I saw the usage of Object.assign in the compiled output, which means it only works in browsers that support native ES class syntax unless polyfills are now required. So can we just use the native syntax without transpiling down to ES5 if we intend to drop support for older environments (eg. IE11, Node 4, ...)?
I don't think that's quite right i.e. Object.assign landed shortly before classes implementation but your point is taken. I was just hoping to avoid writing [Something].prototype.property over and over :/
Technically, everything's still transpiling, so I dunno. The original goal was a more maintainable / readable code-base. If you need an Object.assign polyfill in some environment, so be it. It would be on a version of something that Less doesn't support.
At the same time, I think it's better if we can separate the fix of performance degradation and the breaking changes, which means to land the performance fix in v3 and include the breaking changes only in v4.
I've been thinking of that, and I guess that's also a fair point. I'm just trying to make my head not explode building / maintaining 3 major versions of Less.
@rjgotten AFAIK that's what a class pattern is supposed to do, exactly as you've defined it. Unless I'm not seeing a critical difference. So 🤷♂️ . I'm not going to try to alter Less's Node inheritance pattern again if it's performing well (other than I may remove this Object.assign call as @Justineo suggested.)
matthew-dean
on 8 Dec 2020
@Justineo @rjgotten Can you try this: [email protected]+b1390a54
matthew-dean
on 8 Dec 2020
Just tried it:
| Version | Time |
| -- | -- |
| v3.9.0 | ~1.6s |
| v3.10.0~v3.11.1 | ~3.6s |
| v3.11.2+ | ~12s |
| 4.0.1-alpha.2+b2049010 | ~1.6s |
| 3.13.0-alpha.10+b1390a54 | ~4.7s |
Ps. Tested with Node.js v12.13.1.
Justineo
on 8 Dec 2020
I'm.... what.
matthew-dean
on 8 Dec 2020
Didn't have the time to set up seperate benchmarks.
But from an integration test perspective, here's some real-world numbers: the cumulative results of a production-grade Webpack project that uses Less.
Version | Time | Peak Memory
:------------------------|--------:|------------:
3.9 | 35376ms | 950MB
3.11.3 | 37878ms | 920MB
3.13.0-alpha.10+b1390a54 | 34801ms | 740MB
3.13.1-alpha.1+84d40222 | 37367ms | 990MB
4.0.1-alpha.2+b2049010 | 35857ms | 770MB
For me the 3.13.0 gives the _best_ results... 🙈
3.11.3 also seems to not have the runaway memory use that I saw before with the 3.11.1 version.
But the 4.0.1 and 3.13.0 betas are better still.
The 3.13.1 which restored the cache doesn't help with improving my real-world compile times and just inflates memory use.
rjgotten
on 8 Dec 2020
@rjgotten Yeah, I think the problem is that, in this thread, people are measuring different things, and everyone thus far essentially has private data which is impossible to replicate (without submitting to Less benchmarking, or translating that into a PR). Less does have a benchmark test, which I could use against different clones of the repo, to verify for myself differences in parse / eval time, but where caching doesn't (currently) apply.
Here is a published build with the inheritance changes on the tree, and with the parse tree cache restored: [email protected]+e8d05c61
matthew-dean
on 8 Dec 2020
Test case
https://github.com/ecomfe/dls-tooling/tree/master/packages/less-plugin-dls
Results
| Version | Time |
| -- | -- |
| v3.9.0 | ~1.6s |
| v3.10.0~v3.11.1 | ~3.6s |
| v3.11.2+ | ~12s |
| 4.0.1-alpha.2| ~1.6s |
| 3.13.0-alpha.10| ~4.7s |
| 3.13.0-alpha.12 | ~1.6s |
Node.js version
v12.13.1
To me this version seem to work perfectly. I'll ask my colleagues to try out and verify.
Justineo
on 8 Dec 2020
Works slightly worse than the alpha.10 for me, but could also just be variance:
Version | Time | Peak Memory
:------------------------|--------:|------------:
3.9 | 35376ms | 950MB
3.11.3 | 37878ms | 920MB
3.13.0-alpha.10+b1390a54 | 34801ms | 740MB
3.13.0-alpha.12+e8d05c61 | 36263ms | 760MB
3.13.1-alpha.1+84d40222 | 37367ms | 990MB
4.0.1-alpha.2+b2049010 | 35857ms | 770MB
rjgotten
on 8 Dec 2020
@matthew-dean, it looks like my code is not yet compatible with the 4.0.1-alpha.2+b2049010 changes. I'll see if I can resolve my issues and give it a try.
jrnail23
on 8 Dec 2020
@rjgotten Yeah, the difference seems minor for your test case.
I think the outcome of this is that I might prepare both a 3.x and a 4.0 release. I wasn't itching to push 4.0 with this issue unresolved. Thankfully, it looks like it has been.
The other item I'll do is open an issue for anyone to grab which is to put in a CI pipeline that fails Less if it falls below a certain benchmark threshold.
matthew-dean
on 8 Dec 2020
@jrnail23 It would be great if you can modify to run the 4.0 alpha, but can you in the meantime try [email protected]+e8d05c61?
matthew-dean
on 8 Dec 2020
@matthew-dean, I'm getting the following for my build:
- v3.9: 98 seconds
- v3.10.3: 161 seconds
- v3.13.0-alpha.12: 93-96 seconds
So it looks like you're back down to where you want to be! Nice work!
jrnail23
on 8 Dec 2020
Nice work!
Yeah, I'm going to second; third; and fourth that.
This was a nasty, nasty performance regression that really took a _lot_ of effort to clean out.
Job _very well_ done.
rjgotten
on 9 Dec 2020
Okay team! I'm going to publish the 3.x build, and sometime later, maybe next week, publish 4.0. Both should now have the performance fixes. Thanks to everyone who helped debug!
matthew-dean
on 9 Dec 2020
By the way, I'm currently in the process of converting the Less.js codebase to TypeScript, and plan to use the opportunity to do some performance tuning / refactoring. I'm open to help if anyone is interested! https://github.com/matthew-dean/less.js/compare/master...matthew-dean:next
matthew-dean
on 7 Jan 2021
Anything specific where you would prefer some extra eyes? The PR is very large, so I don't really know where to start
kevinramharak
on 7 Jan 2021
@kevinramharak That's a fair question. To be honest, I ran into unexpected roadblocks with converting to TypeScript (errors that became hard to resolve), and am now re-thinking doing it at all. Less is running fine as it is, and a lot of the reasons I wanted to convert (to make refactoring / adding new language features easier) are now irrelevant as I've decided to move my ideas for new language features to a new pre-processing language. I don't want to over-self-promote, so DM me on Twitter or Gitter if you want details.
matthew-dean
on 21 Jan 2021
Related issues
 MarkSG93
·
4Comments
MarkSG93
·
4Comments
 renoth
·
6Comments
renoth
·
6Comments
 xblakestone
·
3Comments
xblakestone
·
3Comments
 awebdev
·
4Comments
awebdev
·
4Comments
 briandipalma
·
6Comments
briandipalma
·
6Comments
Most helpful comment
Okay team! I'm going to publish the 3.x build, and sometime later, maybe next week, publish 4.0. Both should now have the performance fixes. Thanks to everyone who helped debug!