Leakcanary: Heap analysis failed for Obfuscated App
Description
I ran the app from android studio setting up LeakCanary for obfuscated apps and it failed during heap analysis. I turned off obfuscation in progaurd-rules.pro and it worked.
m.d
at shark.c$o$a.a()
at shark.c$o$a.a()
at shark.q0.a()
at shark.c$o.a()
at shark.o.a()
at shark.o.a()
at shark.o.a()
at shark.o.a()
at shark.o.a()
at leakcanary.internal.HeapAnalyzerService.a()
at leakcanary.internal.HeapAnalyzerService.a()
at leakcanary.internal.i.onHandleIntent()
at android.app.IntentService$ServiceHandler.handleMessage(IntentService.java:66)
at android.os.Handler.dispatchMessage(Handler.java:102)
at android.os.Looper.loop(Looper.java:148)
at android.os.HandlerThread.run(HandlerThread.java:61)

Build.VERSION.SDK_INT: 23
Build.MANUFACTURER: LGE
LeakCanary version: 2.2
Analysis duration: 75543 ms
Heap dump file path: /storage/emulated/0/Download/leakcanary-com.colevit.furmate/2020-04-25_23-53-20_181.hprof
Heap dump timestamp: 1587839082676
Steps to Reproduce
hprof:
2020-04-25_23-53-20_181.hprof.zip
Expected behavior: It should analyse the heap and show leak trace with de-obfuscated names.
Version Information
- LeakCanary version: 2.2
- Android OS version: 23
- Gradle version: 5.6.4
- Android Gradle plugin version: 3.5.3
Additional Information
This is tested on a release build though I also tested on debug build as well with code obfuscation and it failed.
 Guneetgstar
All 36 comments
Can you provide a deobfuscated stacktrace?
 pyricau
on 28 Apr 2020
pyricau
on 28 Apr 2020
You mean trace with obfuscation disabled? Yeah, sure here it is:-
====================================
HEAP ANALYSIS RESULT
====================================
2 APPLICATION LEAKS
References underlined with "~~~" are likely causes.
Learn more at https://squ.re/leaks.
174775 bytes retained by leaking objects
Signature: 214a494349cfcf4e95bf3d7597a03eb579a99978
┬───
│ GC Root: System class
│
├─ leakcanary.internal.InternalLeakCanary class
│ Leaking: NO (HomeActivity↓ is not leaking and a class is never leaking)
│ ↓ static InternalLeakCanary.resumedActivity
├─ com.colevit.furmate.module.home.HomeActivity instance
│ Leaking: NO (DocumentsFragment↓ is not leaking and Activity#mDestroyed is false)
│ ↓ HomeActivity.manager
├─ androidx.fragment.app.FragmentManagerImpl instance
│ Leaking: NO (DocumentsFragment↓ is not leaking)
│ ↓ FragmentManagerImpl.mActive
├─ java.util.HashMap instance
│ Leaking: NO (DocumentsFragment↓ is not leaking)
│ ↓ HashMap.table
├─ java.util.HashMap$HashMapEntry[] array
│ Leaking: NO (DocumentsFragment↓ is not leaking)
│ ↓ HashMap$HashMapEntry[].[0]
├─ java.util.HashMap$HashMapEntry instance
│ Leaking: NO (DocumentsFragment↓ is not leaking)
│ ↓ HashMap$HashMapEntry.value
├─ com.colevit.furmate.module.home.fragment.sub.DocumentsFragment instance
│ Leaking: NO (Fragment#mFragmentManager is not null)
│ Fragment.mTag=DocumentsFragment
│ ↓ DocumentsFragment.actionBarLayout
│ ~~~~~~~~~~~~~~~
├─ com.google.android.material.appbar.AppBarLayout instance
│ Leaking: YES (View detached and has parent)
│ mContext instance of com.colevit.furmate.module.home.HomeActivity with mDestroyed = false
│ View#mParent is set
│ View#mAttachInfo is null (view detached)
│ View.mID = R.id.appBar
│ View.mWindowAttachCount = 1
│ ↓ AppBarLayout.mParent
├─ android.widget.FrameLayout instance
│ Leaking: YES (AppBarLayout↑ is leaking and View detached and has parent)
│ mContext instance of com.colevit.furmate.module.home.HomeActivity with mDestroyed = false
│ View#mParent is set
│ View#mAttachInfo is null (view detached)
│ View.mWindowAttachCount = 1
│ ↓ FrameLayout.mParent
╰→ android.widget.LinearLayout instance
Leaking: YES (ObjectWatcher was watching this because com.colevit.furmate.module.home.fragment.sub.DocumentsFragment received Fragment#onDestroyView() callback (references to its views should be cleared to prevent leaks))
key = 6dd9534d-d2a6-4b05-b6e3-3f886b115d7f
watchDurationMillis = 6016
retainedDurationMillis = 1014
key = cf023779-5695-4278-bf65-7cb6676382bc
mContext instance of com.colevit.furmate.module.home.HomeActivity with mDestroyed = false
View#mParent is null
View#mAttachInfo is null (view detached)
View.mWindowAttachCount = 1
7868351 bytes retained by leaking objects
Signature: cc59415c0c7c49314f182d218b8dce1ce4546
┬───
│ GC Root: System class
│
├─ leakcanary.internal.InternalLeakCanary class
│ Leaking: NO (HomeActivity↓ is not leaking and a class is never leaking)
│ ↓ static InternalLeakCanary.resumedActivity
├─ com.colevit.furmate.module.home.HomeActivity instance
│ Leaking: NO (DashBoardFrag↓ is not leaking and Activity#mDestroyed is false)
│ ↓ HomeActivity.manager
├─ androidx.fragment.app.FragmentManagerImpl instance
│ Leaking: NO (DashBoardFrag↓ is not leaking)
│ ↓ FragmentManagerImpl.mActive
├─ java.util.HashMap instance
│ Leaking: NO (DashBoardFrag↓ is not leaking)
│ ↓ HashMap.table
├─ java.util.HashMap$HashMapEntry[] array
│ Leaking: NO (DashBoardFrag↓ is not leaking)
│ ↓ HashMap$HashMapEntry[].[0]
├─ java.util.HashMap$HashMapEntry instance
│ Leaking: NO (DashBoardFrag↓ is not leaking)
│ ↓ HashMap$HashMapEntry.next
├─ java.util.HashMap$HashMapEntry instance
│ Leaking: NO (DashBoardFrag↓ is not leaking)
│ ↓ HashMap$HashMapEntry.value
├─ com.colevit.furmate.module.home.fragment.DashBoardFrag instance
│ Leaking: NO (Fragment#mFragmentManager is not null)
│ Fragment.mTag=DashBoardFrag
│ ↓ DashBoardFrag.mLifecycleRegistry
│ ~~~~~~~~~~~~~~~~~~
├─
droidx.lifecycle.LifecycleRegistry instance
│ Leaking: UNKNOWN
│ ↓ LifecycleRegistry.mObserverMap
│ ~~~~~~~~~~~~
├─ androidx.arch.core.internal.FastSafeIterableMap instance
│ Leaking: UNKNOWN
│ ↓ FastSafeIterableMap.mEnd
│ ~~~~
├─ androidx.arch.core.internal.SafeIterableMap$Entry instance
│ Leaking: UNKNOWN
│ ↓ SafeIterableMap$Entry.mKey
│ ~~~~
├─ androidx.lifecycle.LiveData$LifecycleBoundObserver instance
│ Leaking: UNKNOWN
│ ↓ LiveData$LifecycleBoundObserver.mObserver
│ ~~~~~~~~~
├─ com.colevit.furmate.module.home.fragment.-$$Lambda$DashBoardFrag$3Kt4IWcLLu7Dm5nOhHZVm8mQS08 instance
│ Leaking: UNKNOWN
│ ↓ -$$Lambda$DashBoardFrag$3Kt4IWcLLu7Dm5nOhHZVm8mQS08.f$0
│ ~~~
╰→ androidx.coordinatorlayout.widget.CoordinatorLayout instance
Leaking: YES (ObjectWatcher was watching this because com.colevit.furmate.module.home.fragment.DashBoardFrag received Fragment#onDestroyView() callback (references to its views should be cleared to prevent leaks))
key = fe207a15-396e-401d-9790-17142c79f2c8
watchDurationMillis = 8167
retainedDurationMillis = 3166
key = c66fff73-9faa-40aa-a8c8-2733d7b455bf
watchDurationMillis = 8166
mContext instance of com.colevit.furmate.module.home.HomeActivity with mDestroyed = false
View#mParent is null
View#mAttachInfo is null (view detached)
View.mID = R.id.parent
View.mWindowAttachCount = 1
====================================
0 LIBRARY LEAKS
Library Leaks are leaks coming from the Android Framework or Google libraries.
====================================
METADATA
Please include this in bug reports and Stack Overflow questions.
Build.VERSION.SDK_INT: 23
Build.MANUFACTURER: LGE
LeakCanary version: 2.2
App process name: com.colevit.furmate
Analysis duration: 74183 ms
Heap dump file path: /storage/emulated/0/Download/leakcanary-com.colevit.furmate/2020-04-28_06-00-28_701.hprof
Heap dump timestamp: 1588033910808
====================================
haha no, I meant keep obfuscation on but deobfuscate the stacktrace. Proguard generates a mapping.txt file that you can use to deobfuscate stacktraces. You probably already do that when looking at crash reports.
I can't investigate the stacktrace you shared as it's all obfuscated. But if you deobfuscate (or share your proguard's mapping file for that crashing build) then I might be able to.
pyricau
on 1 May 2020
Ok I got it. Here it is:-
kotlin.KotlinNullPointerException
 at shark.AndroidObjectInspectors$SUPPORT_FRAGMENT$inspect$1.invoke(AndroidObjectInspectors.java)
 at shark.AndroidObjectInspectors$SUPPORT_FRAGMENT$inspect$1.invoke(AndroidObjectInspectors.java)
 at shark.ObjectReporter.getHeapObject(ObjectReporter.java)
                         whenInstanceOf(ObjectReporter.java)
 at shark.AndroidObjectInspectors$SUPPORT_FRAGMENT.getLeakingObjectFilter$shark_android(AndroidObjectInspectors.java)
                                                   inspect(AndroidObjectInspectors.java)
 at shark.HeapAnalyzer.analyze(HeapAnalyzer.java)
                       analyzeGraph(HeapAnalyzer.java)
                       buildLeakTraceObjects(HeapAnalyzer.java)
                       buildLeakTraces(HeapAnalyzer.java)
                       computeLeakStatuses(HeapAnalyzer.java)
                       findLeaks(HeapAnalyzer.java)
                       findResultsInTrie(HeapAnalyzer.java)
                       recordClassName(HeapAnalyzer.java)
                       resolveStatus(HeapAnalyzer.java)
                       since(HeapAnalyzer.java)
                       updateTrie(HeapAnalyzer.java)
 at leakcanary.internal.HeapAnalyzerService.analyzeHeap(HeapAnalyzerService.java)
                                            missingFileFailure(HeapAnalyzerService.java)
                                            onAnalysisProgress(HeapAnalyzerService.java)
                                            onHandleIntentInForeground(HeapAnalyzerService.java)
 at leakcanary.internal.ForegroundService.onHandleIntent(ForegroundService.java)
 at android.app.IntentService$ServiceHandler.handleMessage(IntentService.java:66)
 at android.os.Handler.dispatchMessage(Handler.java:102)
 at android.os.Looper.loop(Looper.java:148)
 at android.os.HandlerThread.run(HandlerThread.java:61)
Thanks!
Though we don't have line numbers, it looks like this might be the failing line:
val fragmentManager = instance["android.support.v4.app.Fragment", "mFragmentManager"]!!
This would imply that the fragment doesn't have a mFragmentManager. Assuming the LeakCanary plugin is doing its work, LeakCanary should know what class this is / and what the actual name for mFragmentManager is.
What's really confusing to me, however, is that from what I can see you've been using Android X, not the support library. So AndroidObjectInspectors.SUPPORT_FRAGMENT should never match. Unless Jetifier gets in the way and replaces the "android.support.v4.app.Fragment" string with androidx.fragment.app.Fragment
Can you share the mapping.txt that was used for the build you got the hprof from? Then I can try running Shark CLI with that mapping and see if it crashes and if yes why. If it doesn't crash then it's likely that jetifier did something nasty.
pyricau
on 1 May 2020
My project is in production and and not open source so I don't think sharing the mapping.txt would be a good idea. Is there any other way to resolve it?
Guneetgstar
on 1 May 2020
I'm assuming you got this in a debug / QA build (since LeakCanary is on) and hopefully that APK isn't in production. Every distinct build should yield a different mapping.txt with different class names so sharing that should not impact the security of your production build.
That being said, I totally understand if you'd rather not share it. In that case, would you mind at least sharing what the android.support.v4.app.Fragment and androidx.fragment.app.Fragment are obfuscated to? And, for each of those, what the mFragmentManager field was renamed to? I'd love to confirm what the issue is.
pyricau
on 1 May 2020
I didn't find any mapping to android.support.v4.app.Fragment in mapping.txt perhaps coz as you said I am using AndroidX so this shouldn't be here either. But I did find this:-
```
androidx.fragment.app.Fragment -> androidx.fragment.app.Fragment:
.
.
androidx.fragment.app.FragmentManagerImpl mFragmentManager -> y
Guneetgstar
on 1 May 2020
Ok. Am I finding Fragment.y in the hprof, and looks slike it might indeed be the fragment manager.
Would you mind trying again with this configuration:
    LeakCanary.config = LeakCanary.config.copy(
        objectInspectors = AndroidObjectInspectors.appDefaults - AndroidObjectInspectors.SUPPORT_FRAGMENT
    )
This should remove the crashing inspector (which you shouldn't need anyway), and I'm curious to know if something else will crash next or if that's the only place where you have an issue.
pyricau
on 2 May 2020
No, heap analysis still fails after adding the given code into the Application.onCreate.
Guneetgstar
on 2 May 2020
Cool, but does it fail with the exact same unobfuscated stacktrace? Probably not, so what's the new stacktrace?
pyricau
on 2 May 2020
Ok. Am I finding Fragment.y in the hprof, and looks slike it might indeed be the fragment manager.
As per I understand you are saying that from the hprof, you are think that Fragment.y has a different mapping from what I gave above.
This could be the reason as the hprof you are looking is the old one. Progaurd might have changed the mapping to this new build.
Guneetgstar
on 2 May 2020
Cool, but does it fail with the exact same unobfuscated stacktrace? Probably not, so what's the new stacktrace?
I was about to add that even the stacktrace looks no different. Here it is:
m.d
 at shark.c$b$a.a()
 at shark.c$b$a.a()
 at shark.q0.a()
 at shark.c$b.a()
 at shark.o.a()
 at shark.o.a()
 at shark.o.a()
 at shark.o.a()
 at shark.o.a()
 at leakcanary.internal.HeapAnalyzerService.a()
 at leakcanary.internal.HeapAnalyzerService.a()
 at leakcanary.internal.i.onHandleIntent()
 at android.app.IntentService$ServiceHandler.handleMessage(IntentService.java:66)
 at android.os.Handler.dispatchMessage(Handler.java:102)
 at android.os.Looper.loop(Looper.java:148)
 at android.os.HandlerThread.run(HandlerThread.java:61)
The stacktrace is definitely different, shark.c$b$a.a() vs shark.c$o$a.a(). No idea what that could be without the unmapping though.
pyricau
on 2 May 2020
The stacktrace is definitely different,
shark.c$b$a.a()vsshark.c$o$a.a(). No idea what that could be without the unmapping though.
I have already done that and posted the same but deleted as this was expected:
kotlin.KotlinNullPointerException
 at shark.AndroidObjectInspectors$ANDROIDX_FRAGMENT$inspect$1.invoke(AndroidObjectInspectors.java)
 at shark.AndroidObjectInspectors$ANDROIDX_FRAGMENT$inspect$1.invoke(AndroidObjectInspectors.java)
 at shark.ObjectReporter.getHeapObject(ObjectReporter.java)
                         whenInstanceOf(ObjectReporter.java)
 at shark.AndroidObjectInspectors$ANDROIDX_FRAGMENT.getLeakingObjectFilter$shark_android(AndroidObjectInspectors.java)
                                                    inspect(AndroidObjectInspectors.java)
 at shark.HeapAnalyzer.analyze(HeapAnalyzer.java)
                       analyzeGraph(HeapAnalyzer.java)
                       buildLeakTraceObjects(HeapAnalyzer.java)
                       buildLeakTraces(HeapAnalyzer.java)
                       computeLeakStatuses(HeapAnalyzer.java)
                       findLeaks(HeapAnalyzer.java)
                       findResultsInTrie(HeapAnalyzer.java)
                       recordClassName(HeapAnalyzer.java)
                       resolveStatus(HeapAnalyzer.java)
                       since(HeapAnalyzer.java)
                       updateTrie(HeapAnalyzer.java)
 at leakcanary.internal.HeapAnalyzerService.analyzeHeap(HeapAnalyzerService.java)
                                            missingFileFailure(HeapAnalyzerService.java)
                                            onAnalysisProgress(HeapAnalyzerService.java)
                                            onHandleIntentInForeground(HeapAnalyzerService.java)
 at leakcanary.internal.ForegroundService.onHandleIntent(ForegroundService.java)
 at android.app.IntentService$ServiceHandler.handleMessage(IntentService.java:66)
 at android.os.Handler.dispatchMessage(Handler.java:102)
 at android.os.Looper.loop(Looper.java:148)
 at android.os.HandlerThread.run(HandlerThread.java:61)
so, it really looks like the mFragmentManager field can't be found, which would imply that there's a bug in how LeakCanary deobfuscate the field. I'm not sure where to go from here (cc @mzgreen )
pyricau
on 2 May 2020
Hey!
@Guneetgstar can you verify that the mapping file has been copied into the apk? You can do it by drag n dropping the apk into AS, it'll open apk analyzer. Then look inside assets directory.
There should be a mapping file:
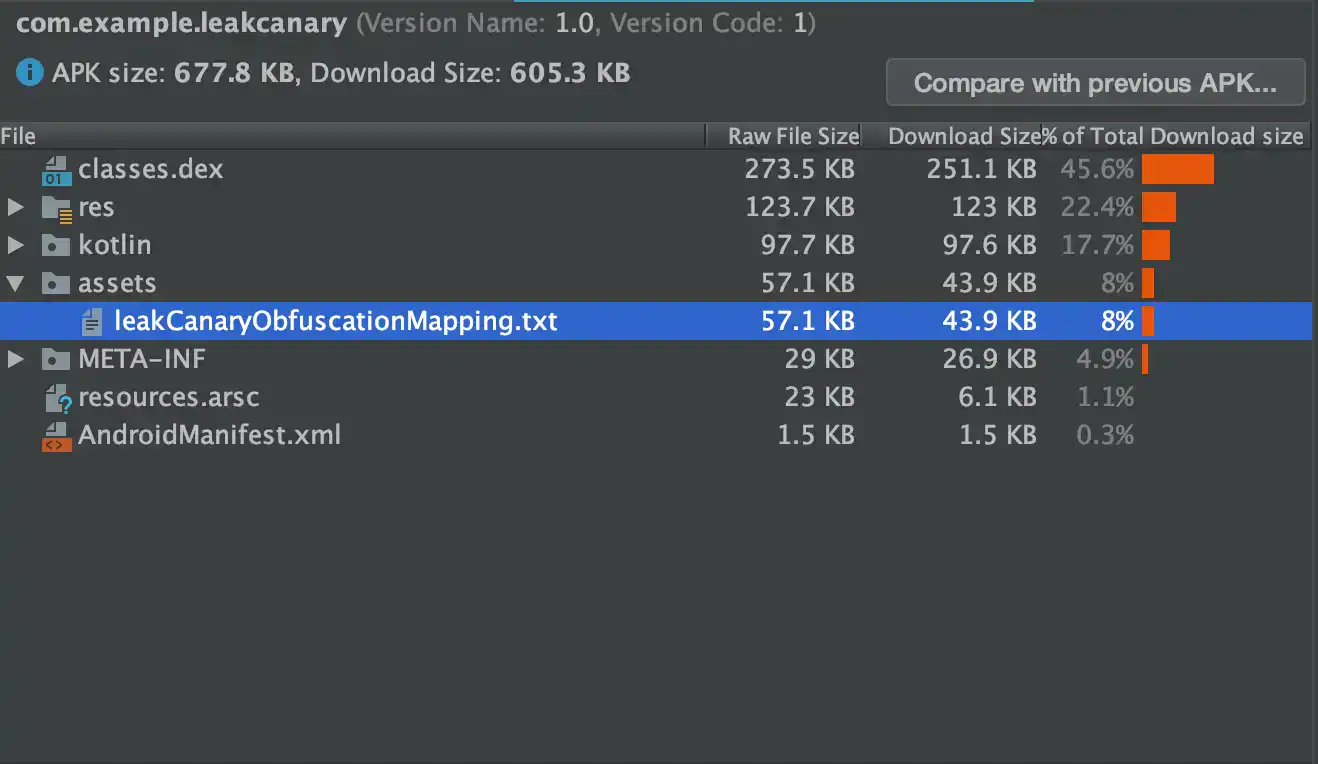
If it's not there then it means that something is wrong with deobfuscation gradle plugin.
 mzgreen
on 2 May 2020
mzgreen
on 2 May 2020
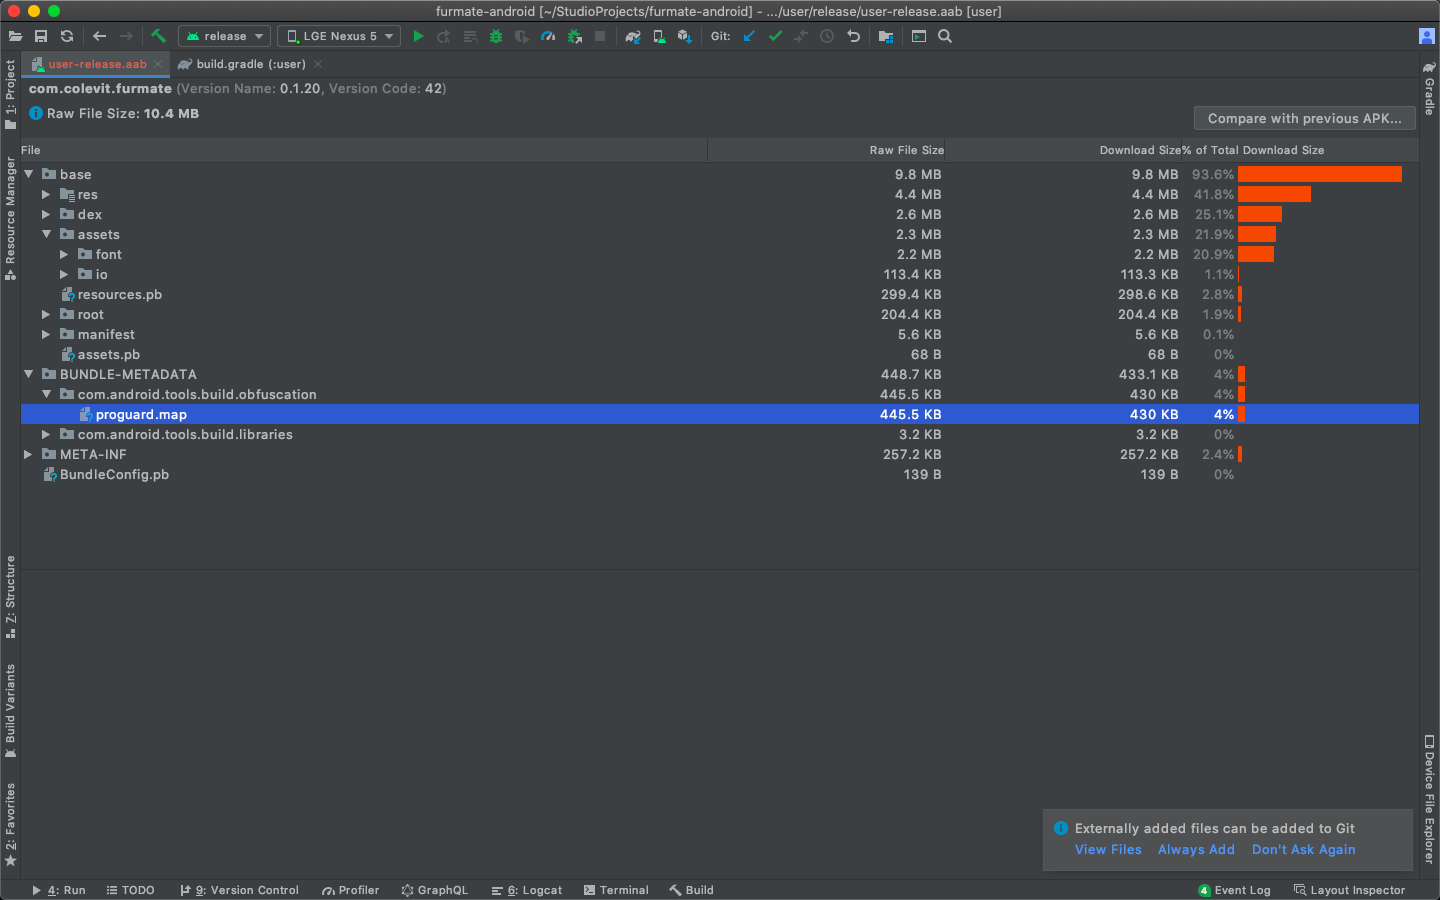
@mzgreen I am installing the app using App bundle not APK. Although, I have analysed the app bundle and I can see something like a mapping file, but I think this is not the one we are looking for:
Guneetgstar
on 2 May 2020
Ok so I think we just found the problem. I just tested the app installing the APK and the LeakCanary deobfuscation plugin works just fine, which means that the problem lies with App bundles as it doesn't include the progaurd-mapping file in it which is 'Okay' if we just put it in the docs.
Guneetgstar
on 2 May 2020
Thank you for checking! I haven't tested it with app bundles. I'll check if we can make it work with aab. In the meantime I pushed a change that improves plugin initialization, so you may check the snapshot build when it's merged.
mzgreen
on 2 May 2020
@Guneetgstar I've just checked with this latest change I made and it worked in my project. I've build aab and I have the mapping file inside:
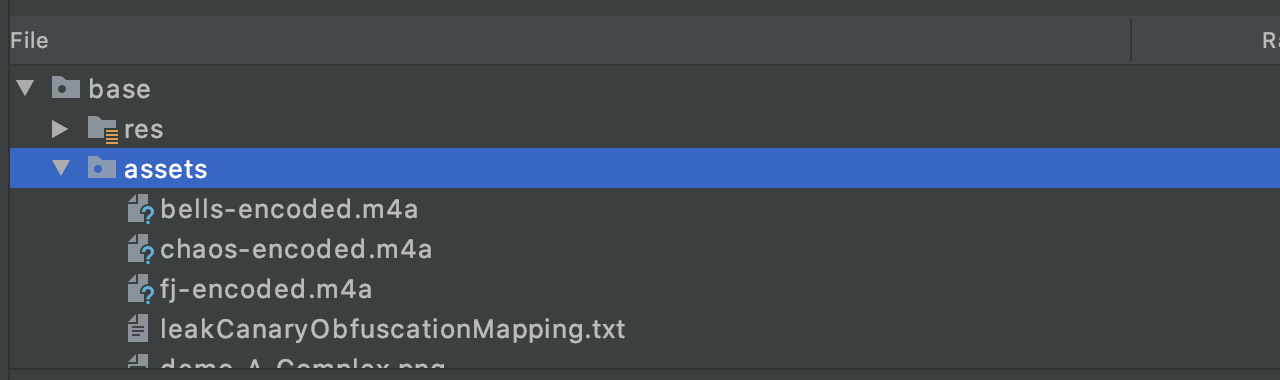
I hope it'll work for you too. Also please make sure that your LeakCanary gradle plugin config is correct (check if you're passing proper variant name in leakCanary{} block).
mzgreen
on 3 May 2020
Thanks @mzgreen ! Will check it as soon as the changes are merged and released. And As I said the plugin is working well with the APK already shows that its gradle plugin config is correct (at least the variant name that you mentioned).
Guneetgstar
on 3 May 2020
@Guneetgstar Can you try again with the snapshot build?
https://square.github.io/leakcanary/faq/#how-do-i-use-the-snapshot-version
pyricau
on 4 May 2020
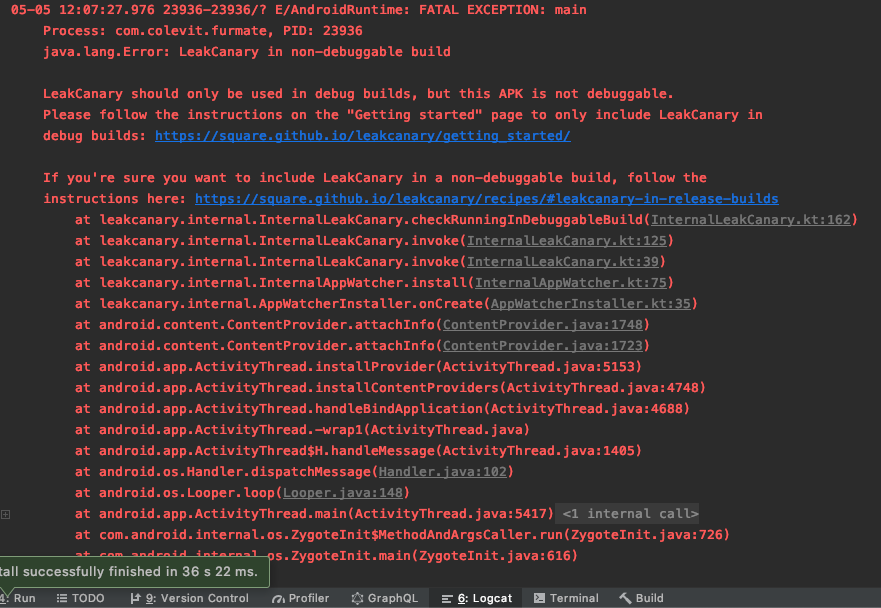
@pyricau Thanks for the reference! I just tried to see it working with the snapshot build but I am having a problem particularly to that. Is there any change related to configuring LeakCanary in release builds coz just enabling it manually is not working anymore for me?
Guneetgstar
on 5 May 2020
@Guneetgstar you just ran into a new check that will ship in the next release: https://github.com/square/leakcanary/pull/1806 (cc @cketti). We added this because Amazon Music shipped LeakCanary on the app store.
The doc hasn't been updated yet, but here's the latest from master: https://github.com/square/leakcanary/blob/master/docs/recipes.md#leakcanary-in-release-builds
TL;DR: add this:
<?xml version="1.0" encoding="utf-8"?>
<resources>
  <bool name="leak_canary_allow_in_non_debuggable_build">true</bool>
</resources>
@pyricau And how do you think this could stop Amazon Music from doing it (pun intended)?
Guneetgstar
on 5 May 2020
@Guneetgstar: It stopped you, didn't it? The goal is to stop people from accidentally including LeakCanary in release builds, not to make it impossible. That's why there's a way to do it anyway. But you have to opt-in for that.
 cketti
on 5 May 2020
cketti
on 5 May 2020
@cketti Well, It stopped me just like it did earlier (Only until I got to know I can do it)!
In my opinion it would make this happen even easier as earlier you can completely avoid it by just creating a new/different build for QA and say call a function which enables LeakCanary only in that build not in others. But now it's just hardcoded. In am promoting this idea as developers already use this kind of implementations for testing/debugging and prod/non-prod builds.
Guneetgstar
on 5 May 2020
Bdw its working! Thanx @mzgreen @pyricau for resolving the issue!
Guneetgstar
on 5 May 2020
Closing, looks like we've solved both issues (support fragment inspector triggering for no reason & mapping file not included)
pyricau
on 5 May 2020
Does Leakcanary work with obfuscated Android App Bundles? I don't see base.apk/assets/leakCanaryObfuscationMapping.txt appearing in the AAB. (while it does appear when building the apk)
 wbervoets
on 9 Sep 2020
wbervoets
on 9 Sep 2020
@wbervoets It should work/worked in the past. What version of LeakCanary and Android Gradle Plugin are you using?
mzgreen
on 9 Sep 2020
@mzgreen I'm using Android Gradle Plugin 4.0.1 and LeakCanary 2.4
R8 is configured to use full-mode (android.enableR8.fullMode=true)
wbervoets
on 10 Sep 2020
@wbervoets I've just ran it on Leak Canary sample app and it indeed doesn't work properly with bundles. I was testing it with different settings and it worked once but most of the times it didn't. Not sure if this is related to this issue. I think we should probably create a new one for that. cc @pyricau
mzgreen
on 14 Sep 2020
@mzgreen can you open a new issue with a sample project to repro?
pyricau
on 15 Sep 2020
mzgreen
on 16 Sep 2020
Related issues
 arctouch-carlosottoboni
·
4Comments
arctouch-carlosottoboni
·
4Comments
 msfjarvis
·
6Comments
msfjarvis
·
6Comments
 smallgirl
·
3Comments
pyricau
·
4Comments
smallgirl
·
3Comments
pyricau
·
4Comments
 willswinson
·
6Comments
willswinson
·
6Comments