Leakcanary: Beta 3 has much slower heap analysis
Description
Updating to beta 3 from beta 2 I noticed that heap analysis became much slower (I'm assuming because of changes in https://github.com/square/leakcanary/pull/1543)
We mainly use LeakCanary in instrumentation tests on CI via Firebase test lab, and with beta 3 a heap analysis takes 14 minutes. This is really problematic because Firebase test matrices time out at 30 minutes, so if multiple tests have the same leak then the test matrix can't complete.
Leak canary v1, as well as v2-beta1, also had similarly slow performance that made it infeasible for us to use in instrumentation tests. Thankfully, beta 2 brought the analysis time down to about 5 minutes so we could actually use it.
I'm following the standard instructions for using leak canary with instrumentation tests. We also run our Firebase tests on a Pixel 3 physical device, which is the fastest one available. Running analysis locally on an emulator is a bit faster, but still around 10 minutes.
Steps to Reproduce
hprof file at:
https://drive.google.com/file/d/1xJYE7YogS1Ae2sHyjbk5ZXlu6U0mjGBN/view?usp=sharing
- Run heap analysis on hprof file with LeakCanary v2.0-beta-3
- Takes ~14 minutes to complete on Pixel 3 Firebase device
- Heap analysis with beta 2 seemed to be about half as long.
Expected behavior: [What you expect to happen]
For a ~70MB heap dump I'm not sure what the expected analysis time is, but this big of a regression across versions forces us to stay on beta 2 for now.
Version Information
- LeakCanary version: v2.0-beta-3
- Android OS version: API 28
- Gradle version: 4.10.2
Additional Information
As a side note, I am using a subclass of FailTestOnLeakRunListener that blocks heap analysis after one leak is found (in following tests). This helps to prevent the test matrix from taking too long and timing out if several of the tests have a leak. I am not sure if our heap analysis is much slower than others, or how other people are using instrumentation tests with leak canary, but a change like this was necessary for us to even be able to use it.
 elihart
All 12 comments
Thanks for the bug report! Will look into it.
 pyricau
on 5 Sep 2019
pyricau
on 5 Sep 2019
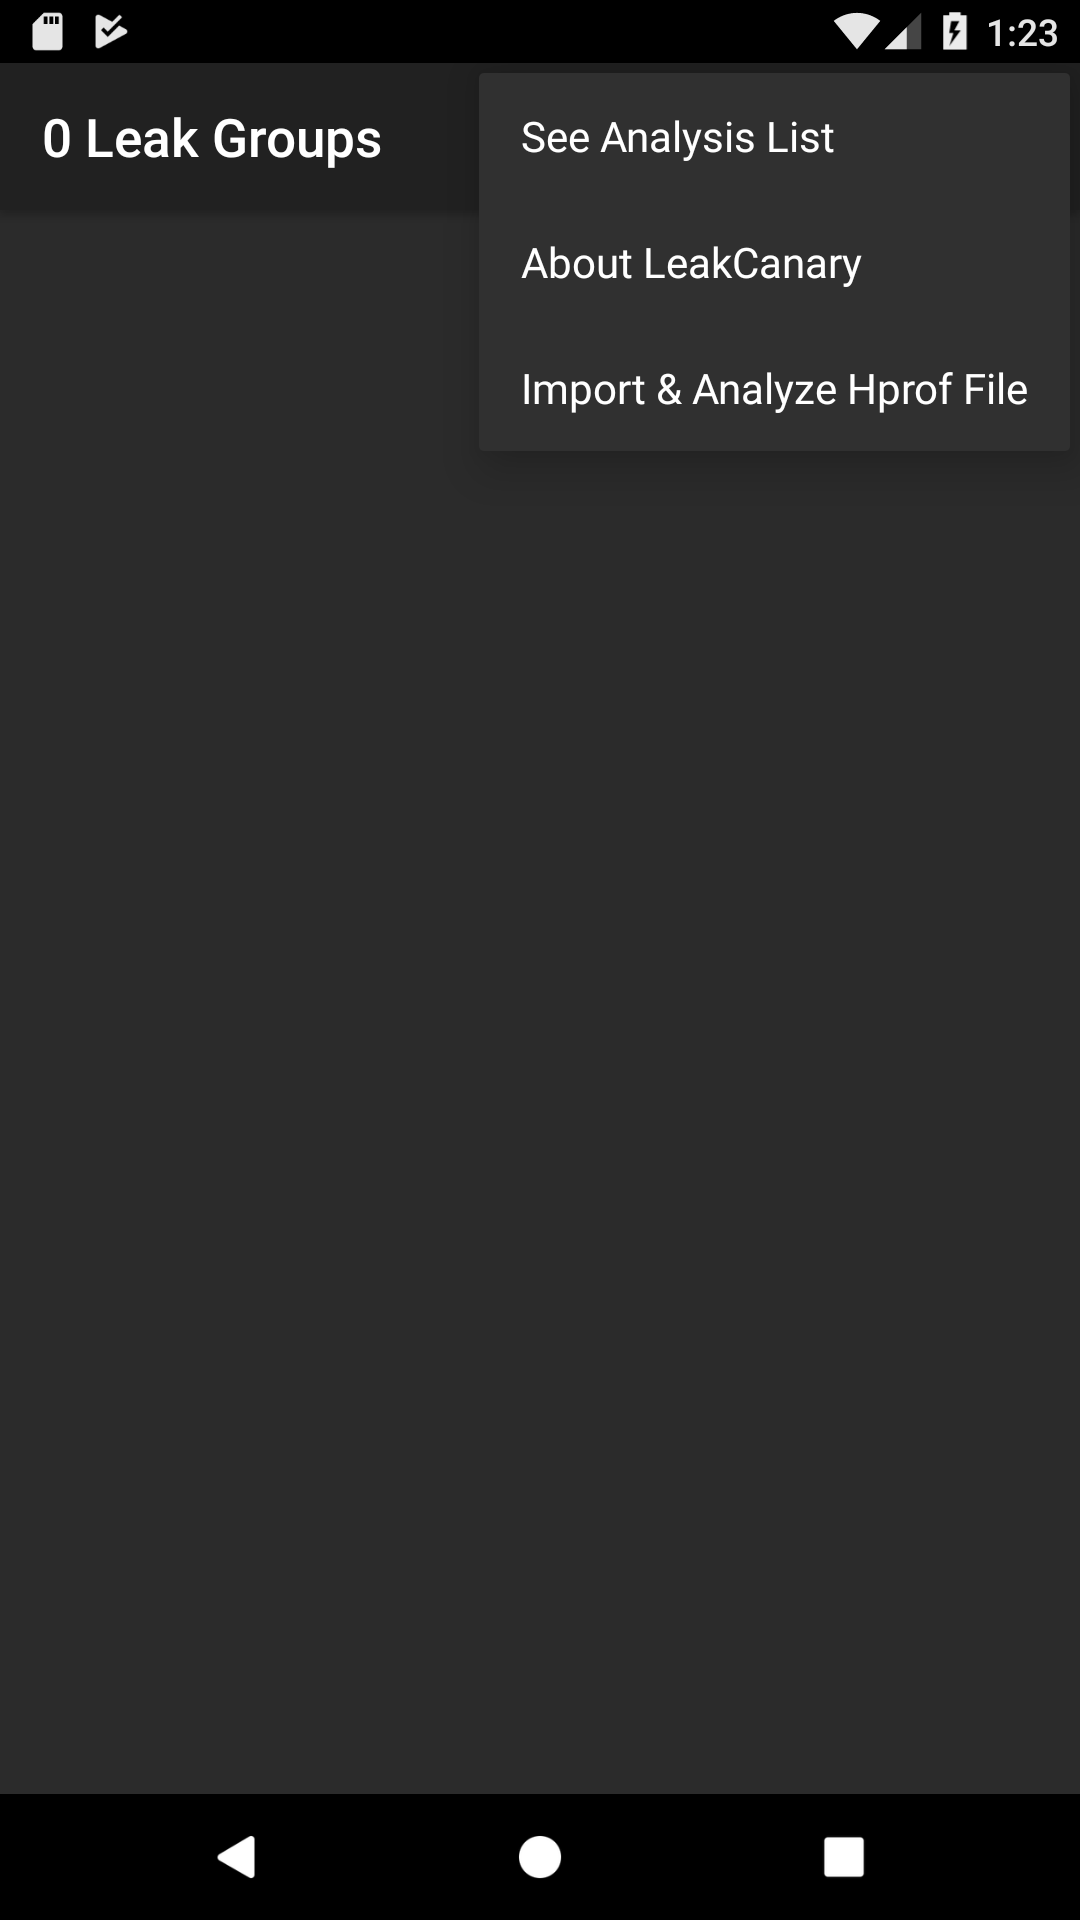
@elihart When I run the analysis of this file in an emulator it takes 20 seconds. Can you import the file into LeakCanary and reanalyze it just to confirm? You can do that by opening the LeakCanary launcher app and going into the menu:
pyricau
on 6 Sep 2019
Wow, that's very interesting that it runs so quickly for you. I imported the file into the leak canary app on an emulator and it still took about ten minutes.
Here is the logcat output I get on Firebase btw
08-24 18:03:13.997: D/LeakCanary(15402): Heap Analysis:
08-24 18:03:13.997: D/LeakCanary(15402): HeapAnalysisSuccess(heapDumpFile=/data/user/0/com.airbnb.android.development/files/instrumentation_tests_heapdump.hprof, createdAtTimeMillis=1566694993995, analysisDurationMillis=707706, applicationLeaks=[], libraryLeaks=[LibraryLeak(className=com.airbnb.android.lib.mvrxtest.HappoTestActivity, leakTrace=
08-24 18:03:13.997: D/LeakCanary(15402): ┬
08-24 18:03:13.997: D/LeakCanary(15402): ├─ android.view.inputmethod.InputMethodManager
08-24 18:03:13.997: D/LeakCanary(15402): │ Leaking: NO (InputMethodManager↓ is not leaking and a class is never leaking)
08-24 18:03:13.997: D/LeakCanary(15402): │ GC Root: System class
08-24 18:03:13.997: D/LeakCanary(15402): │ ↓ static InputMethodManager.sInstance
08-24 18:03:13.997: D/LeakCanary(15402): ├─ android.view.inputmethod.InputMethodManager
08-24 18:03:13.997: D/LeakCanary(15402): │ Leaking: NO (InputMethodManager is a singleton)
08-24 18:03:13.997: D/LeakCanary(15402): │ ↓ InputMethodManager.mCurRootView
08-24 18:03:13.997: D/LeakCanary(15402): │ ~~~~~~~~~~~~
08-24 18:03:13.997: D/LeakCanary(15402): ├─ com.android.internal.policy.DecorView
08-24 18:03:13.997: D/LeakCanary(15402): │ Leaking: YES (View.mContext references a destroyed activity)
08-24 18:03:13.997: D/LeakCanary(15402): │ mContext instance of com.android.internal.policy.DecorContext, wrapping activity com.airbnb.android.lib.mvrxtest.HappoTestActivity with mDestroyed = true
08-24 18:03:13.997: D/LeakCanary(15402): │ View#mParent is null
08-24 18:03:13.997: D/LeakCanary(15402): │ View#mAttachInfo is null (view detached)
08-24 18:03:13.997: D/LeakCanary(15402): │ View.mWindowAttachCount = 1
08-24 18:03:13.997: D/LeakCanary(15402): │ ↓ DecorView.mContentRoot
08-24 18:03:13.997: D/LeakCanary(15402): ├─ android.widget.LinearLayout
08-24 18:03:13.997: D/LeakCanary(15402): │ Leaking: YES (DecorView↑ is leaking and View.mContext references a destroyed activity)
08-24 18:03:13.997: D/LeakCanary(15402): │ mContext instance of com.airbnb.android.lib.mvrxtest.HappoTestActivity with mDestroyed = true
08-24 18:03:13.997: D/LeakCanary(15402): │ View#mParent is set
08-24 18:03:13.997: D/LeakCanary(15402): │ View#mAttachInfo is null (view detached)
08-24 18:03:13.997: D/LeakCanary(15402): │ View.mWindowAttachCount = 1
08-24 18:03:13.997: D/LeakCanary(15402): │ ↓ LinearLayout.mContext
08-24 18:03:13.997: D/LeakCanary(15402): ╰→ com.airbnb.android.lib.mvrxtest.HappoTestActivity
08-24 18:03:13.997: D/LeakCanary(15402): Leaking: YES (LinearLayout↑ is leaking and Activity#mDestroyed is true and ObjectWatcher was watching this)
08-24 18:03:13.997: D/LeakCanary(15402): key = 64f96c24-818e-4785-ba38-f856d4d8f44d
08-24 18:03:13.997: D/LeakCanary(15402): watchDurationMillis = 5326
08-24 18:03:13.997: D/LeakCanary(15402): retainedDurationMillis = 325
08-24 18:03:13.997: D/LeakCanary(15402): , retainedHeapByteSize=8116, pattern=instance field android.view.inputmethod.InputMethodManager#mCurRootView, description=The singleton InputMethodManager is holding a reference to mCurRootView long after the activity has been destroyed. Observed on ICS MR1: https://github.com/square/leakcanary/issues/1#issuecomment-100579429 Hack: https://gist.github.com/pyricau/4df64341cc978a7de414)])
Any idea why it may be running so much more quickly on your emulator?
elihart
on 7 Sep 2019
Yep: analysisDurationMillis=707706 you're getting 11 minutes wow.
I've been using an API 25 emulator with no profiler (which slows things down).. on a last gen macbook pro, which likely makes a difference. Didn't expect a 30x diff though.
When you say "on firebase", do you mean that you're running it on firebase emulators, not on your own computer?
Would you mind running the exact same file but against leakcanary 2 beta2 just to get an exact ratio?
Also, I might ask you to run a profiler trace on the analysis if you know how to do that, and share it with us. My concern though is that it would take a while to complete.
We've identified a bunch of things to optimize but I'd love to get closer to reproducing, 20 seconds isn't "bad enough"
pyricau
on 7 Sep 2019
I'm running the emulator locally on a maxed out recent gen macbook pro (API 28 emulator). When I refer to Firebase, that's our instrumentation tests that are running on Pixel 3 physical devices on Firebase test lab (also API 28)
I analyzed the same file on the emulator on my macbook. Here are the reported durations from logcat.
Beta 3: 616470ms
Beta 2: 348745ms
I'll try to get a trace to share, but I am also not sure how well that will go given the length of this. I'll start with a beta 2 trace since that runs faster for me.
elihart
on 7 Sep 2019
Now I'm seeing anomalies in the parsing time too!
Environment
Real device Google Pixel 3 with Android 10
First test
- Make a dummy empty app (
com.artem.flikrfinderin my logs) and adding Leakcanary as adebugImplementation 'com.squareup.leakcanary:leakcanary-android:2.0-beta-3'. - Install the dummy app, close it, open the LeakCanary app and import HPROF file attached above.
Result
Analysis took 7.5 minutes!
Log:
2019-09-07 10:47:24.488 30941-32309/com.artem.flickrfinder D/LeakCanary: WRITE_EXTERNAL_STORAGE permission not granted, ignoring
2019-09-07 10:47:24.914 30941-10879/com.artem.flickrfinder D/LeakCanary: Analysis in progress, working on: PARSING_HEAP_DUMP
2019-09-07 10:47:28.112 30941-31026/com.artem.flickrfinder D/LeakCanary: Checking retained object because app became invisible
2019-09-07 10:47:28.112 30941-31026/com.artem.flickrfinder D/LeakCanary: No retained objects
2019-09-07 10:47:39.152 30941-10879/com.artem.flickrfinder D/LeakCanary: Analysis in progress, working on: FINDING_LEAKING_INSTANCES
2019-09-07 10:48:29.841 30941-31026/com.artem.flickrfinder D/LeakCanary: Checking retained object because app became invisible
2019-09-07 10:48:29.842 30941-31026/com.artem.flickrfinder D/LeakCanary: No retained objects
2019-09-07 10:49:27.794 30941-10879/com.artem.flickrfinder D/LeakCanary: Analysis in progress, working on: FINDING_PATHS_TO_LEAKING_INSTANCES
2019-09-07 10:51:12.099 30941-10879/com.artem.flickrfinder D/LeakCanary: Analysis in progress, working on: FINDING_DOMINATORS
2019-09-07 10:54:30.694 30941-10879/com.artem.flickrfinder D/LeakCanary: Analysis in progress, working on: COMPUTING_NATIVE_RETAINED_SIZE
2019-09-07 10:54:59.635 30941-10879/com.artem.flickrfinder D/LeakCanary: Analysis in progress, working on: COMPUTING_RETAINED_SIZE
2019-09-07 10:55:00.275 30941-10879/com.artem.flickrfinder D/LeakCanary: Analysis in progress, working on: BUILDING_LEAK_TRACES
2019-09-07 10:55:00.292 30941-10879/com.artem.flickrfinder D/LeakCanary: Analysis in progress, working on: REPORTING_HEAP_ANALYSIS
2019-09-07 10:55:00.295 30941-10879/com.artem.flickrfinder D/LeakCanary: HeapAnalysisSuccess(heapDumpFile=/data/user/0/com.artem.flickrfinder/files/leakcanary/2019-09-07_10-47-24_489.hprof, createdAtTimeMillis=1567878900294, analysisDurationMillis=455380, applicationLeaks=[ApplicationLeak(className=com.airbnb.android.lib.mvrxtest.interaction.InteractionTestActivity, leakTrace=
┬
├─ okio.AsyncTimeout
│ Leaking: NO (PathClassLoader↓ is not leaking and a class is never leaking)
│ GC Root: Input or output parameters in native code
│ ↓ static AsyncTimeout.$class$classLoader
├─ dalvik.system.PathClassLoader
│ Leaking: NO (Object[]↓ is not leaking and A ClassLoader is never leaking)
│ ↓ PathClassLoader.runtimeInternalObjects
├─ java.lang.Object[]
│ Leaking: NO (P3ReviewFragmentKt↓ is not leaking)
│ ↓ array Object[].[15263]
├─ com.airbnb.android.p3.P3ReviewFragmentKt
│ Leaking: NO (a class is never leaking)
│ ↓ static P3ReviewFragmentKt.leak
│ ~~~~
╰→ com.airbnb.android.lib.mvrxtest.interaction.InteractionTestActivity
Leaking: YES (Activity#mDestroyed is true and ObjectWatcher was watching this)
key = 156a9eac-9c80-4933-b601-bbbd95885c17
watchDurationMillis = 8162
retainedDurationMillis = 3162
, retainedHeapByteSize=884950)], libraryLeaks=[])
Second test
- Checkout latest codebase for LeakCanary, import and compile
- Run
leakcanary-android-sampleon the real device. Once activity with text 'Rotate screen 5 times' appears - close it - Open corresponding LeakCanary app (make sure to double-check the package name!) and import HPROF file.
Result
Analysis takes about 30 seconds
Log:
2019-09-07 10:57:44.448 24988-24988/com.example.leakcanary D/LeakCanary: Got activity result with requestCode=0 resultCode=-1 returnIntent=Intent { dat=content://com.android.providers.downloads.documents/document/5007 flg=0x1 }
2019-09-07 10:57:44.474 24988-25567/com.example.leakcanary D/LeakCanary: WRITE_EXTERNAL_STORAGE permission not granted, ignoring
2019-09-07 10:57:44.826 24988-25077/com.example.leakcanary D/LeakCanary: Checking retained object because app became invisible
2019-09-07 10:57:44.826 24988-25077/com.example.leakcanary D/LeakCanary: No retained objects
2019-09-07 10:57:45.007 24988-25568/com.example.leakcanary D/LeakCanary: Analysis in progress, working on: PARSING_HEAP_DUMP
2019-09-07 10:57:45.104 24988-25033/com.example.leakcanary W/System: A resource failed to call close.
2019-09-07 10:57:47.256 24988-25568/com.example.leakcanary D/LeakCanary: Analysis in progress, working on: FINDING_LEAKING_INSTANCES
2019-09-07 10:57:50.484 24988-25568/com.example.leakcanary D/LeakCanary: Analysis in progress, working on: FINDING_PATHS_TO_LEAKING_OBJECTS
2019-09-07 10:57:56.077 24988-25031/com.example.leakcanary I/mple.leakcanar: Background concurrent copying GC freed 1079684(26MB) AllocSpace objects, 5(1328KB) LOS objects, 36% free, 41MB/65MB, paused 60us total 130.814ms
2019-09-07 10:57:56.702 24988-25031/com.example.leakcanary I/mple.leakcanar: Background concurrent copying GC freed 1156273(32MB) AllocSpace objects, 0(0B) LOS objects, 37% free, 40MB/64MB, paused 29us total 120.557ms
2019-09-07 10:57:57.375 24988-25031/com.example.leakcanary I/mple.leakcanar: Background concurrent copying GC freed 1423253(32MB) AllocSpace objects, 0(0B) LOS objects, 37% free, 39MB/63MB, paused 29us total 120.938ms
2019-09-07 10:58:00.367 24988-25568/com.example.leakcanary D/LeakCanary: Analysis in progress, working on: FINDING_DOMINATORS
2019-09-07 10:58:17.492 24988-25568/com.example.leakcanary D/LeakCanary: Analysis in progress, working on: COMPUTING_NATIVE_RETAINED_SIZE
2019-09-07 10:58:18.371 24988-25568/com.example.leakcanary D/LeakCanary: Analysis in progress, working on: COMPUTING_RETAINED_SIZE
2019-09-07 10:58:18.457 24988-25568/com.example.leakcanary D/LeakCanary: Analysis in progress, working on: BUILDING_LEAK_TRACES
2019-09-07 10:58:18.463 24988-25568/com.example.leakcanary D/LeakCanary: Analysis in progress, working on: REPORTING_HEAP_ANALYSIS
2019-09-07 10:58:18.466 24988-25568/com.example.leakcanary D/LeakCanary: HeapAnalysisSuccess(heapDumpFile=/data/user/0/com.example.leakcanary/files/leakcanary/2019-09-07_10-57-44_475.hprof, createdAtTimeMillis=1567879098465, analysisDurationMillis=33457, applicationLeaks=[ApplicationLeak(className=com.airbnb.android.lib.mvrxtest.interaction.InteractionTestActivity, leakTrace=
┬
├─ okio.AsyncTimeout
│ Leaking: NO (PathClassLoader↓ is not leaking and a class is never leaking)
│ GC Root: Input or output parameters in native code
│ ↓ static AsyncTimeout.$class$classLoader
├─ dalvik.system.PathClassLoader
│ Leaking: NO (Object[]↓ is not leaking and A ClassLoader is never leaking)
│ ↓ PathClassLoader.runtimeInternalObjects
├─ java.lang.Object[]
│ Leaking: NO (P3ReviewFragmentKt↓ is not leaking)
│ ↓ array Object[].[15263]
├─ com.airbnb.android.p3.P3ReviewFragmentKt
│ Leaking: NO (a class is never leaking)
│ ↓ static P3ReviewFragmentKt.leak
│ ~~~~
╰→ com.airbnb.android.lib.mvrxtest.interaction.InteractionTestActivity
Leaking: YES (Activity#mDestroyed is true and ObjectWatcher was watching this)
key = 156a9eac-9c80-4933-b601-bbbd95885c17
watchDurationMillis = 8162
retainedDurationMillis = 3162
, retainedHeapByteSize=884950)], libraryLeaks=[])
2019-09-07 10:58:49.882 24988-25077/com.example.leakcanary D/LeakCanary: Checking retained object because app became invisible
2019-09-07 10:58:49.883 24988-25077/com.example.leakcanary D/LeakCanary: No retained objects
I tried attaching profiler in first scenario, between PARSING_HEAP_DUMP and FINDING_PATHS_TO_LEAKING_OBJECTS and found that most of the time is spent in HeapAnalyser.findLeakingObjects() inside the .toSet() call. But, then again, it's only part of the analysis, so this might be a wrong lead here.
very long analysis.zip
@elihart if it's possible, can you please fork the latest code from LeakCanary and trying the second scenario on your real device / emulator? We need to make sure that there's indeed a difference between beta3 and latest code from master
 Armaxis
on 7 Sep 2019
Armaxis
on 7 Sep 2019
I tried running a heap dump analysis on the JVM (with no retained size computation) and it went from ~6s in beta 2 to ~9s in beta3 / master. The variance was too high to measure any kind of difference between beta3 and master.
I'd love to be able to repro and maybe take good old timestamp measurements of the different parts (with no tracing) to understand which part has changed widely.
pyricau
on 9 Sep 2019
The retained size computation is worth noting, it does make things slower, though I reenabled it by default because I didn't expect it to have a large impact. Worth testing with and without on a live env.
pyricau
on 9 Sep 2019
I just did a fresh install of the sample app from the Beta 3 branch on my Pixel 3 (Android 9) and then imported the provided heap dump: analysisDurationMillis=27729
pyricau
on 9 Sep 2019
I believe I found the reason behind these horrible slowdowns: it was Android Studio's Advanced memory profiler. The one that does you the favor of tracing all the allocations on API 28+ devices, even if you don't ask for it. Without profiler being attached - and it's very good at doing it silently, keep an eye on the profiler tab! - the analysis time stays around 30-40 seconds.
@elihart can you please try analyzing an hprof once more, but this time without connecting your phone to the profiler; to be 100% just disconnect it completely from the laptop and run the analysis, then you can connect to pull the logs. I wonder if this would resolve the issue.
As for the CI build, it looks like Firebase test lab attaches a profiler to measure the performance during the test, so it's quite possible that the memory profiler is affecting the test in a similar way to a local run. Can you try to disable performance metrics for one run and see if the analysis time changes?
Armaxis
on 10 Sep 2019
@Armaxis thanks for the update, appreciate you looking into it!
On CI we already run our tests with performance metrics disabled, so I don't believe it's that (unless there is some other way for profiling to get run).
I have run the heap analysis in both the leak canary sample app and the airbnb app (via opening the Leaks activity and importing the same file). The sample app runs it in about 15 seconds while the airbnb app runs it in ~5 minutes. This is with android studio closed, on the same emulator, and just switching back and forth between the two activities and running them one after the other.
I also ran the analysis on a physical device (Android 10) unplugged from a laptop like you requested. It finished in analysisDurationMillis=207108, which is much better than other times I have seen for our app, but still seems several times higher than it should be.
Given that I think it is something beyond profiling slow down, possibly something specific to our app environment.
elihart
on 11 Sep 2019
We've made a few performance improvements, but overall we haven't been able to reproduce the issue here so I'm going to close it. Happy to reopen and look into this if we have a way to repro.
pyricau
on 13 Nov 2019
Related issues
 peter1492
·
6Comments
peter1492
·
6Comments
 edgelv34
·
7Comments
edgelv34
·
7Comments
 devism
·
6Comments
devism
·
6Comments
 basti-shi031
·
3Comments
basti-shi031
·
3Comments
 nobeh
·
5Comments
nobeh
·
5Comments
Most helpful comment
We've made a few performance improvements, but overall we haven't been able to reproduce the issue here so I'm going to close it. Happy to reopen and look into this if we have a way to repro.