Leaflet: Define the extent of a tile layer that is covering a small portion of the world.
Is your feature request related to a problem? Please describe.
I am having a xyz tile layer just covering portions of middle europe. But it is not possible to define the extent of the tile Layer.
Describe the solution you'd like
Define a bounding box of the tile layer that covers the certain region of the world.
Describe alternatives you've considered
Actually no alternative found.
Additional context
 meteoDaniel
All 9 comments
Hi, great to hear that you find Leaflet useful!
However, this issue tracker is used for reporting bugs and discussing new features. For questions on using Leaflet, please use gis.stackexchange.com or stackoverflow.
If you are really sure that this is a bug in leaflet, or a feature request, please change the wording to make it look like a bug report.
 IvanSanchez
on 18 Jul 2019
IvanSanchez
on 18 Jul 2019
Also, https://leafletjs.com/reference-1.5.0.html#gridlayer-bounds
IvanSanchez
on 18 Jul 2019
Dear @IvanSanchez this is not a question it is a feature request because this feature does not exist. Otherwise i missunderstand the concept of tileLayers.
GridLayer Bounds defines a region where just 1 tile of the Layer should be loaded.
meteoDaniel
on 18 Jul 2019
The feature you're asking for already exists and I linked to the documentation about and here's an example of it in use for completeness. https://plnkr.co/edit/0UaDosy6sKBJLNeRY52g?p=preview
IvanSanchez
on 18 Jul 2019
This issue 5818 says that this feature is not working as we expect and it is definetly the behaviour i explained to you in an earlier comment.
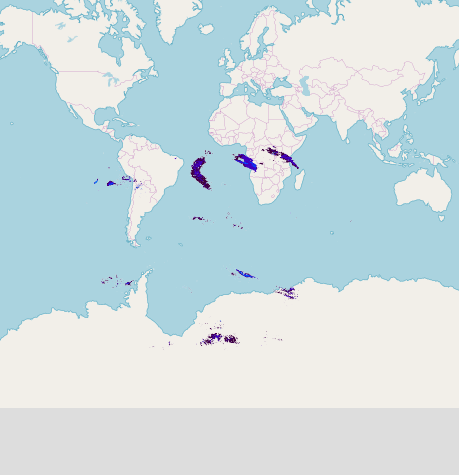
I am having images like this: http://weatheroo.net/radar/data/2019/07/16/16/05/radar_de.png and i tile them into http://weatheroo.net/radar/data/{year}/{month}/{day}/{hour}/{minute}/{z}/{x}/{y}.png
The whole image should be displayed within the rectangle in your example but only one frame of the tiles is actually in there. If you change your script in plunker with the following code you will see that it is not doing what I want.
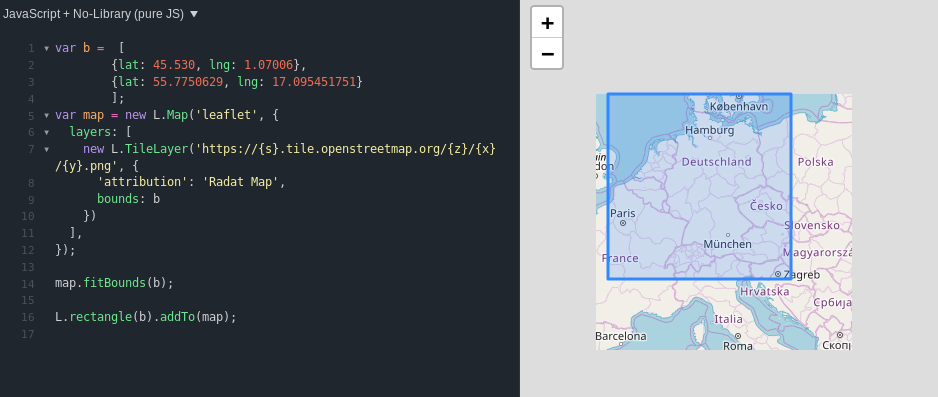
var b =  [
        {lat: 45.530, lng: 1.07006},
        {lat: 55.7750629, lng: 17.095451751}
        ];
var map = new L.Map('leaflet', {
    layers: [
        new L.TileLayer('http://weatheroo.net/radar/data/2019/07/18/12/00/{z}/{x}/{y}.png', {
            'attribution': 'Radat Map',
            bounds: b
        })
    ],
});

map.fitBounds(b);

L.rectangle(b).addTo(map)
I want to set the bounds of the layer to a certain region like it is done with an ImageOverlay.
meteoDaniel
on 18 Jul 2019
I am having images like this: http://weatheroo.net/radar/data/2019/07/16/16/05/radar_de.png
That's not a tile. There are no tile coordinates there. Do not use L.TileLayer.
IvanSanchez
on 18 Jul 2019
Please read the full comment!.
I used gdal2tiles to seperate e.g. this image http://weatheroo.net/radar/data/2019/07/16/16/05/radar_de.png into tile layers.
Here is a fiddle for you:
https://jsfiddle.net/qf032pth/
So there are tiles
-> http://weatheroo.net/radar/data/2019/07/16/16/05/{z}/{x}/{y}.png
And I can Overlay this Image with ImageOverlay but I want to use the tileLayers of it.
meteoDaniel
on 18 Jul 2019
Pal, you're running gdal2tiles in such a way (TMS coordinate scheme) that the y coordinate is inverted and the bounds are not what they should (and I'm guessing the image is not being reprojected):
https://plnkr.co/edit/0UaDosy6sKBJLNeRY52g?p=preview
var map = new L.Map('leaflet', {
    layers: [
        new L.TileLayer('https://{s}.tile.openstreetmap.org/{z}/{x}/{y}.png', {
            'attribution': 'Map data © <a href="http://openstreetmap.org">OpenStreetMap</a> contributors',
        }),
        L.tileLayer('http://weatheroo.net/radar/data/2019/07/16/16/05/{z}/{x}/{-y}.png')
    ],
    center: [0, 0], zoom: 1
});
I encourage you to read through https://leafletjs.com/examples/zoom-levels/ and also https://wiki.osgeo.org/wiki/Tile_Map_Service_Specification for completeness - note that Leaflet does not support any custom TMS grid specs, WMTS grids through plugins are flaky at best.
You are tiling your tiles the wrong way.
There is no bug in Leaflet, there is no missing feature in Leaflet, because if I switch the tile source in your plunkr code to one that follows the well-known EPSG:3857 pyramid scheme, everything just works:
IvanSanchez
on 18 Jul 2019
This was the answer I needed. Thanks for your support.
meteoDaniel
on 18 Jul 2019
Related issues
 prbaron
·
3Comments
prbaron
·
3Comments
 ttback
·
4Comments
ttback
·
4Comments
 edmsgists
·
3Comments
edmsgists
·
3Comments
 CallMarl
·
3Comments
CallMarl
·
3Comments
 remilev
·
4Comments
remilev
·
4Comments