Leaflet: Problems to detect geojson multipolygon
The following example works well in version 1.1.0 the problem is in 2.0.1
library(shiny)
library(leaflet)

seattle_geojson <- list(
  type = "Feature",
  geometry = list(type = "MultiPolygon",
    coordinates = list(
      list(
        list(
          c(-122.36075812146,  47.6759920119894),
          c(-122.360781646764, 47.6668890126755),
          c(-122.360782108665,  47.6614990696722),
          c(-122.366199035722, 47.6614990696722),
          c(-122.366199035722,  47.6592874248973),
          c(-122.364582509469, 47.6576254522105),
          c(-122.363887331445,  47.6569107302038),
          c(-122.360865528129, 47.6538418253251),
          c(-122.360866157644,  47.6535254473167),
          c(-122.360866581103, 47.6533126275176),
          c(-122.362526540691,  47.6541872926348),
          c(-122.364442114483, 47.6551892850798),
          c(-122.366077719797,  47.6560733960606),
          c(-122.368818463838, 47.6579742346694),
          c(-122.370115159943,  47.6588730808334),
          c(-122.372295967029, 47.6604350102328),
          c(-122.37381369088,  47.660582362063),
          c(-122.375522972109, 47.6606413027949),
          c(-122.376079703095,  47.6608793094619),
          c(-122.376206315662, 47.6609242364243),
          c(-122.377610811371,  47.6606160735197),
          c(-122.379857378879, 47.6610306942278),
          c(-122.382454873022,  47.6627496239169),
          c(-122.385357955057, 47.6638573778241),
          c(-122.386007328104,  47.6640865692306),
          c(-122.387186331506, 47.6654326177161),
          c(-122.387802656231,  47.6661492860294),
          c(-122.388108244121, 47.6664548739202),
          c(-122.389177800763,  47.6663784774359),
          c(-122.390582858689, 47.6665072251861),
          c(-122.390793942299,  47.6659699214511),
          c(-122.391507906234, 47.6659200946229),
          c(-122.392883050767,  47.6664166747017),
          c(-122.392847210144, 47.6678696739431),
          c(-122.392904778401,  47.6709016021624),
          c(-122.39296705153, 47.6732047491624),
          c(-122.393000803496,  47.6759322346303),
          c(-122.37666945305, 47.6759896300663),
          c(-122.376486363943,  47.6759891899754),
          c(-122.366078869215, 47.6759641734893),
          c(-122.36075812146,  47.6759920119894)
        )
      )
    )
  ),
  properties = list(
    name = "Ballard",
    population = 48000,
    # You can inline styles if you want
    style = list(
      fillColor = "yellow",
      weight = 2,
      color = "#000000"
    )
  ),
  id = "ballard"
)


ui <- fluidPage(
  leafletOutput("map1"),
  checkboxInput("addMarker", "Add marker on click"),
  actionButton("clearMarkers", "Clear all markers"),
  textOutput("message", container = h3)
)

server <- function(input, output, session) {

  v <- reactiveValues(msg = "")

  output$map1 <- renderLeaflet({
    leaflet() %>%
      addGeoJSON(seattle_geojson) %>%
      addCircles(-122.3, 47.65, radius = 500, layerId = "circle") %>%
      fitBounds(-122.42, 47.6126, -122.26, 47.7)
  })

  observeEvent(input$map1_geojson_mouseover, {
    v$msg <- paste("Mouse is over", input$map1_geojson_mouseover$featureId)
  })
  observeEvent(input$map1_geojson_mouseout, {
    v$msg <- ""
  })
  observeEvent(input$map1_geojson_click, {
    v$msg <- paste("Clicked on", input$map1_geojson_click$featureId)
    cat("\n estructura",ls.str(output ))
  })
  observeEvent(input$map1_shape_mouseover, {
    v$msg <- paste("Mouse is over shape", input$map1_shape_mouseover$id)
  })
  observeEvent(input$map1_shape_mouseout, {
    v$msg <- ""
  })
  observeEvent(input$map1_shape_click, {
    v$msg <- paste("Clicked shape", input$map1_shape_click$id)
  })
  observeEvent(input$map1_click, {
    v$msg <- paste("Clicked map at", input$map1_click$lat, "/", input$map1_click$lng)
    if (input$addMarker) {
      leafletProxy("map1") %>%
        addMarkers(lng = input$map1_click$lng, lat = input$map1_click$lat)
    }
  })
  observeEvent(input$map1_zoom, {
    v$msg <- paste("Zoom changed to", input$map1_zoom)
  })
  observeEvent(input$map1_bounds, {
    v$msg <- paste("Bounds changed to", paste(input$map1_bounds, collapse = ", "))
  })
  observeEvent(input$clearMarkers, {
    leafletProxy("map1") %>% clearMarkers()
  })

  output$message <- renderText(v$msg)
}

shinyApp(ui, server)
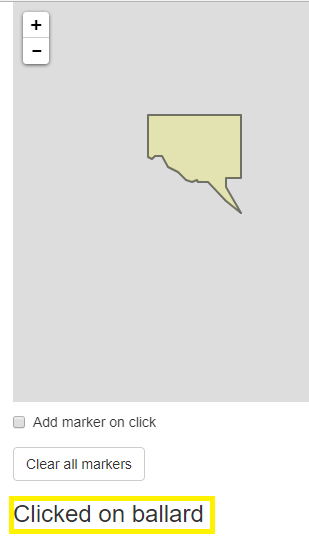
In version 1.1.0 I have the following output when clicking on the figure (which is what I want)
but in version 2.0.1 when clicking on the figure I have the following result, which is not expected.

I suppose the problem is in the next section, what is hanging me chains a series of problems :(
 observeEvent(input$map1_geojson_click, {
    v$msg <- paste("Clicked on", input$map1_geojson_click$featureId)
    cat("\n estructura",ls.str(output ))
  })
 loerasg
All 6 comments
I don't know why it was working with the previous version, actually.
Both click events are being fired when clicking on the yellow polygon. Unfortunately, the app has a race case for the click inputs.
# code removed in favor of example in comment below
 schloerke
on 18 Jun 2018
schloerke
on 18 Jun 2018
You could also rearrange the observeEvent functions to be processed in order (with the last function winning) to avoid using the flag.
Closing as this is a shinyApp issue and not a leaflet issue.
schloerke
on 18 Jun 2018
Double checked on old version as is only firing a single JS event. The latest Leaflet.js has been updated to fire all matching events. See https://github.com/Leaflet/Leaflet/issues/5313
This is a leaflet.js change to give the user more control.
schloerke
on 18 Jun 2018
To update the shiny app, we can use a mix of the observeEvent priority parameter and freezeReactiveValue(OBJ, KEY).
observeEvents with a higher priority will be executed before events with lower priority. There is no guarantee that events with matching priority (default is 0) will be executed in any particular order.
freezeReactiveValue will prevent any observeEvent expressions from evaluating if a reactive values key is frozen.
Reducing the server portion to just the click events...
server <- function(input, output, session) {

  v <- reactiveValues(msg = "")

  output$map1 <- renderLeaflet({
    leaflet() %>%
      addGeoJSON(seattle_geojson) %>%
      addCircles(-122.3, 47.65, radius = 500, layerId = "circle") %>%
      fitBounds(-122.42, 47.6126, -122.26, 47.7)
  })

  observeEvent(input$map1_geojson_click, priority = 1, {
    v$msg <- paste("Clicked on", input$map1_geojson_click$featureId)
    cat("\n estructura",ls.str(output ), "\n")
    cat("----click geo json\n", v$msg, "\n")
    cat("freezing map1_click\n")
    freezeReactiveValue(input, "map1_click")
  })
  observeEvent(input$map1_shape_click, priority = 1, {
    v$msg <- paste("Clicked shape", input$map1_shape_click$id)
    cat("----clicked shape!\n")
    cat("freezing map1_click\n")
    freezeReactiveValue(input, "map1_click")
  })
  observeEvent(input$map1_click, {
    v$msg <- paste("Clicked map at", input$map1_click$lat, "/", input$map1_click$lng)
    if (input$addMarker) {
      leafletProxy("map1") %>%
        addMarkers(lng = input$map1_click$lng, lat = input$map1_click$lat)
    }
    cat("----click\n", v$msg, "\n")
  })

  output$message <- renderText(v$msg)
}
Clicking on the polygon, the map, then the circle, I get the following output.
 estructura impl ns
----click geo json
 Clicked on ballard
freezing map1_click
----click
 Clicked map at 47.6510501279732 / -122.392455653615
----clicked shape!
freezing map1_click
closing in favor of issue #561
schloerke
on 18 Jun 2018
Thank you very much @schloerke , I thought it was an error in the update, otherwise I would not have put the issue here, it really was very useful for me.
loerasg
on 19 Jun 2018
Related issues
 rickwol
·
3Comments
rickwol
·
3Comments
 tim-salabim
·
4Comments
tim-salabim
·
4Comments
 kent37
·
3Comments
kent37
·
3Comments
 cenuno
·
4Comments
cenuno
·
4Comments
 gdmcdonald
·
4Comments
gdmcdonald
·
4Comments
Most helpful comment
To update the shiny app, we can use a mix of the
observeEventpriorityparameter andfreezeReactiveValue(OBJ, KEY).observeEvents with a higher priority will be executed before events with lower priority. There is no guarantee that events with matching priority (default is 0) will be executed in any particular order.freezeReactiveValuewill prevent anyobserveEventexpressions from evaluating if a reactive values key is frozen.Reducing the server portion to just the click events...
Clicking on the polygon, the map, then the circle, I get the following output.