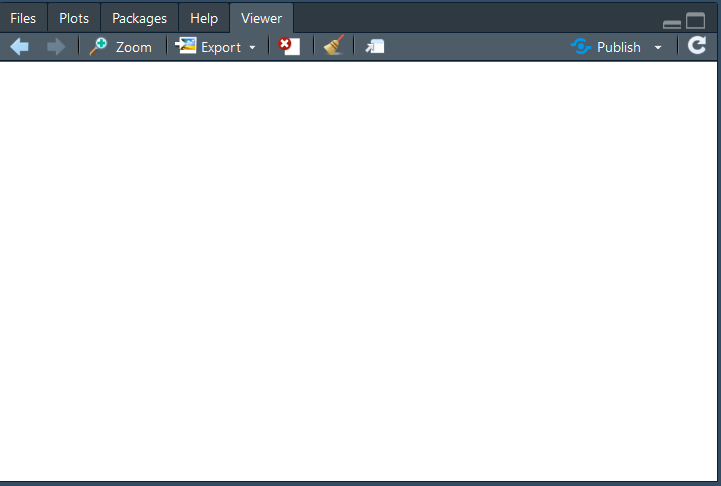
When I run the code on R leaflet tutorial, the Viewer is empty. When I click the zoom button, it is still empty. Here is the code:
library(leaflet)
m <- leaflet() %>%
  addTiles() %>%  # Add default OpenStreetMap map tiles
  addMarkers(lng=174.768, lat=-36.852, popup="The birthplace of R")
m  # Print the map
Here is the session_Info()
R version 3.3.3 (2017-03-06)
Platform: x86_64-apple-darwin13.4.0 (64-bit)
Running under: macOS Sierra 10.12.3

locale:
[1] zh_CN.UTF-8/zh_CN.UTF-8/zh_CN.UTF-8/C/zh_CN.UTF-8/zh_CN.UTF-8

attached base packages:
[1] stats     graphics  grDevices utils     datasets  methods
[7] base

other attached packages:
 [1] REmap_0.3.2        tidyr_0.6.1        RJSONIO_1.3-0
 [4] ggplot2_2.2.1      maptools_0.9-1     sp_1.2-4
 [7] dplyr_0.5.0        stringr_1.2.0      rjson_0.2.15
[10] leafletCN_0.2.2    leaflet_1.1.0.9000 RMySQL_0.10.9
[13] DBI_0.6

loaded via a namespace (and not attached):
 [1] Rcpp_0.12.10        plyr_1.8.4          git2r_0.18.0
 [4] tools_3.3.3         digest_0.6.12       jsonlite_1.3
 [7] memoise_1.0.0       tibble_1.2          gtable_0.2.0
[10] lattice_0.20-34     shiny_1.0.0         crosstalk_1.0.0
[13] curl_2.3            yaml_2.1.14         withr_1.0.2
[16] httr_1.2.1          htmlwidgets_0.8     devtools_1.12.0
[19] grid_3.3.3          R6_2.2.0            XML_3.98-1.5
[22] foreign_0.8-67      magrittr_1.5        scales_0.4.1
[25] htmltools_0.3.5     assertthat_0.1      mime_0.5
[28] xtable_1.8-2        colorspace_1.3-2    httpuv_1.3.3
[31] stringi_1.1.2       lazyeval_0.2.0.9000 munsell_0.4.3
What should I do? Thanks!
 lixinyao
All 17 comments
args(leaflet::addTiles) returns
function (map, urlTemplate = "https://{s}.tile.openstreetmap.org/{z}/{x}/{y}.png",
    attribution = NULL, layerId = NULL, group = NULL, options = tileOptions())
NULL
print(browse=TRUE, htmltools::img(src="https://www.google.com/images/logo.gif")) returns a blank pane
lixinyao
on 20 Apr 2017
I was struggling with the same thing and bugget out. Turns out you can just add the default template from args() . The map only shows when you save the Widget. Or should it show within R? @lixinyao
m <- leaflet() %>%
  addTiles(urlTemplate = "https://{s}.tile.openstreetmap.org/{z}/{x}/{y}.png") %>%
  addMarkers(lng=174.768, lat=-36.852, popup="The birthplace of R")
saveWidget(m, file = "mymap.html")
 Benrath
on 20 Jun 2017
Benrath
on 20 Jun 2017
I too have the same problem I even updated Rstudio to the latest one. which is 1.0.153
a very simple code like this
leaflet() %>%
addTiles() %>% # Add default OpenStreetMap map tiles
addMarkers(lng=174.768, lat=-36.852, popup="The birthplace of R")
Doesn't produce anything on Viewer but You have to switch to Browser to see the MAP. Which is turning out to be a Pain. Please Please plz FIX it.
 vikram-rawat
on 9 Aug 2017
vikram-rawat
on 9 Aug 2017
same issue here
following and further elaborating the above posted reproducibile example
strange enough black and white OSM is working fine where default OSM is not
RStudio Version 1.1.447
-------------------------------
leaflet() %>%
addTiles() %>%
addProviderTiles(providers$OpenStreetMap, group = "osm_default")%>%
addProviderTiles(providers$OpenStreetMap.BlackAndWhite, group = "osm_bw") %>%
addMarkers(lng=174.768, lat=-36.852, popup="The birthplace of R") %>%
addLayersControl(position='topleft',
baseGroups = c("osm_default", "osm_bw"),
options = layersControlOptions(collapsed = TRUE))
#--------------------
any hint to sort out that problem?
thank you
 maxbre
on 25 May 2018
maxbre
on 25 May 2018
@maxbre Can you please give me your devtools::session_info().
There is a known issue of RStudio and linux not working with https (See #526). This is fixed in the next version (1.2.x) of the IDE of RStudio. You can download the daily version here: https://dailies.rstudio.com/
I am seeing that OpenStreeMap is redirecting to use https (new to me).
Does it work if it is opened with the browser using
options(viewer = NULL)
leaflet() %>%
  ...
 schloerke
on 25 May 2018
schloerke
on 25 May 2018
here it is my session info
setting value
version R version 3.4.4 (2018-03-15)
system x86_64, linux-gnu
ui RStudio (1.1.447)
language (EN)
collate en_GB.UTF-8
tz UTC
date 2018-05-29
by the way I sorted out the problem by installing the github version of leaflet
maxbre
on 29 May 2018
Keep issue open until RStudio releases 1.2.x as a regular download
schloerke
on 29 May 2018
@schloerke would this issue still persist for Shiny apps? I noticed markers would not show up when I uploaded my app to shinyapps.io using leaflet 2.0.0, but would run fine in latest RStudio IDE. I resolved the issue by downgrading to leaflet 1.1.0, but ideally would like to run leaflet 2.0.0 to use leaflet extras. Here's the app on shinyapps.io (https://aaguilargonzalez.shinyapps.io/Dashboard_V2/)
 aaguilargonzalez
on 1 Jun 2018
aaguilargonzalez
on 1 Jun 2018
@aaguilargonzalez
This is due to a bad cdn choice on my part. It is fixed in https://github.com/rstudio/leaflet/pull/544 (merged into github master).
I expect a release to CRAN this week.
schloerke
on 3 Jun 2018
@schloerke awesome, will keep an eye out for it thanks!
aaguilargonzalez
on 3 Jun 2018
@aaguilargonzalez Leaflet 2.0.1 is on cran. This should solve the marker issue.
Still keeping issue open until RStudio IDE 1.2.x is released.
schloerke
on 5 Jun 2018
Hi,
I have similar issue here but not sure if they are related.
My map won't show (either on viewer or browser) when the popup includes specific Chinese character.
Here's a example:
df <- read.csv(textConnection("
Name,Lat,Long
成功,23.02086,121.3315
成,23.02086,121.3315
"))

# not working
leaflet(df[1,]) %>% addTiles() %>%
    addMarkers(~Long, ~Lat, popup=~Name)

# working
leaflet(df[2,]) %>% addTiles() %>%
    addMarkers(~Long, ~Lat, popup=~Name)

As you can see, the only difference between df[1,] and df[2,] is the value of the column Name.
As long as the character vector include the Chinese character "功", the map won't render in Viewer nor Browser.
here's the sessionInfo():
R version 3.5.1 (2018-07-02)
Platform: x86_64-w64-mingw32/x64 (64-bit)
Running under: Windows 7 x64 (build 7601) Service Pack 1

Matrix products: default

locale:
[1] LC_COLLATE=Chinese (Traditional)_Taiwan.950
[2] LC_CTYPE=Chinese (Traditional)_Taiwan.950
[3] LC_MONETARY=Chinese (Traditional)_Taiwan.950
[4] LC_NUMERIC=C
[5] LC_TIME=Chinese (Traditional)_Taiwan.950

attached base packages:
[1] stats     graphics  grDevices utils     datasets  methods
[7] base

other attached packages:
[1] sf_0.7-2      leaflet_2.0.2 sp_1.3-1

loaded via a namespace (and not attached):
 [1] Rcpp_1.0.0       rstudioapi_0.9.0 magrittr_1.5
 [4] units_0.6-2      xtable_1.8-3     lattice_0.20-35
 [7] R6_2.4.0         rlang_0.3.1      tools_3.5.1
[10] grid_3.5.1       e1071_1.7-0.1    DBI_1.0.0
[13] htmltools_0.3.6  crosstalk_1.0.0  class_7.3-14
[16] yaml_2.2.0       digest_0.6.18    tibble_2.0.1
[19] crayon_1.3.4     shiny_1.2.0      later_0.8.0
[22] htmlwidgets_1.3  promises_1.0.1   mime_0.6
[25] pillar_1.3.1     compiler_3.5.1   classInt_0.3-1
[28] jsonlite_1.6     httpuv_1.4.5.1   pkgconfig_2.0.2
Any known issue about it?
Thanks in advance.
 yenzichun
on 25 Feb 2019
yenzichun
on 25 Feb 2019
Morning All,
for me if i explicit to add a tiles with the function [addProviderTiles(providers$OpenStreetMap)](https://www.rdocumentation.org/packages/leaflet/versions/2.0.2/topics/addProviderTiles) show the map without problems.
Code example:
exe1 <- leaflet(DF) %>%
    addCircles() %>%
    # add layer to see map
    addProviderTiles(providers$OpenStreetMap)
exe1

have nice day
MC
 martinocrippa
on 19 Jun 2019
martinocrippa
on 19 Jun 2019
openstreetmap 'black and white' not showing up whilst openstreetmap 'default' it does
any hint to sort out the problem?
-----------------------------------------
leaflet() %>%
addTiles() %>%
#addProviderTiles(providers$OpenStreetMap)%>%
addProviderTiles(providers$OpenStreetMap.BlackAndWhite) %>%
addMarkers(lng=174.768, lat=-36.852, popup="The birthplace of R")
------------------------------------------
here my session info
RStudio Version 1.2.5019
version R version 3.6.1 (2019-07-05)
os Debian GNU/Linux 9 (stretch)
system x86_64, linux-gnu
ui RStudio
language (EN)
collate en_GB.UTF-8
ctype en_GB.UTF-8
tz UTC
date 2019-12-05
leaflet * 2.0.3.9000 2019-11-29 [1] Github (rstudio/leaflet@c19b0fb)
maxbre
on 5 Dec 2019
No map shown in viewer
r version: 4.0.0 (2020-04-24)
RStudio version: 1.2.5042
Code:
library(leaflet)
m <- leaflet() %>% addTiles()
m <- m %>% setView(7, 51, zoom = 11)
m
 christophGeoHealthCentre
on 3 May 2020
christophGeoHealthCentre
on 3 May 2020
There’s an issue specifically with R 4.0.0 on RStudio for Windows that we’re tracking here: https://github.com/rstudio/rstudio/issues/6737
 jcheng5
on 3 May 2020
jcheng5
on 3 May 2020
I am having the same problem. Running the code below in R 4.0.0 only produces a white viewer pane and the cooling fan starts going wild, but running the same code in R 3.6.3 works!
library(leaflet)
m <- leaflet() %>%
addTiles() %>% # Add default OpenStreetMap map tiles
addMarkers(lng=174.768, lat=-36.852, popup="The birthplace of R")
m # Print the map
 Renngurke731
on 12 Jun 2020
Renngurke731
on 12 Jun 2020
Related issues
 cenuno
·
4Comments
cenuno
·
4Comments
 tim-salabim
·
4Comments
tim-salabim
·
4Comments
 behrman
·
4Comments
behrman
·
4Comments
 yyz1989
·
7Comments
yyz1989
·
7Comments
 ideamotor
·
7Comments
ideamotor
·
7Comments
Most helpful comment
I too have the same problem I even updated Rstudio to the latest one. which is 1.0.153
a very simple code like this
leaflet() %>%
addTiles() %>% # Add default OpenStreetMap map tiles
addMarkers(lng=174.768, lat=-36.852, popup="The birthplace of R")
Doesn't produce anything on Viewer but You have to switch to Browser to see the MAP. Which is turning out to be a Pain. Please Please plz FIX it.