Kuma: Web page code examples from prism are broken on last production build


 dgesteves
All 50 comments
@schalkneethling I've seen that too. Do you know what it could be?
By the way:
Firefox Nightly

Chrome 79

Safari

 peterbe
on 2 Jan 2020
peterbe
on 2 Jan 2020
@tobinmori this looks like a platform issue rather than a docs issue. See also https://github.com/mdn/kuma/issues/6307.
 chrisdavidmills
on 7 Jan 2020
chrisdavidmills
on 7 Jan 2020
thanks @chrisdavidmills, sorry for the mis-assignment!
 tobinmori
on 7 Jan 2020
tobinmori
on 7 Jan 2020
@atopal can you let me know the priority of this one?
tobinmori
on 7 Jan 2020
What the heck. Now it works! 🙃

I'm confident that there hasn't been a Kuma release since. And my Chrome is still version 79.
peterbe
on 7 Jan 2020
@EstevesDiogo - is this working for you?
Thanks!
tobinmori
on 7 Jan 2020
I can also confirm that this works for me in Fx-Dev, Fx, Chrome and Safari
 schalkneethling
on 8 Jan 2020
schalkneethling
on 8 Jan 2020
I've seen that before when we were experimenting with inline CSS. It seems like some CSS is missing. @tobinmori this is the top priority, if anyone can reproduce. It's the most visible feature on MDN.
 atopal
on 8 Jan 2020
atopal
on 8 Jan 2020
I wanted to check when this broke and the page load waterfall on Speedcurve, but it seems like the last recorded deployment was on December 19. Is that correct?
atopal
on 8 Jan 2020
Weird thing is that this doesn't show up in Speedcurve tests over the last few days (only testing in Chrome though). It seems to be an intermittent issue, so it could still be happening. Do we have any error logging that would help to see if anything has spiked?
atopal
on 8 Jan 2020
Weird thing is that this doesn't show up in Speedcurve tests over the last few days (only testing in Chrome though). It seems to be an intermittent issue, so it could still be happening. Do we have any error logging that would help to see if anything has spiked?
If it is some CSS not loading, which is surely what it looks like, then it is happening on the sub-domain(interactive-examples.mdn.mozilla.net) and not the main d.m.o domain so, not sure what logging we have there.
schalkneethling
on 8 Jan 2020
The only CSS that matters is editor-js.css and codemirror.css. If you block those URLs in the dev tools, it doesn't reproduce. It just goes horribly wrong. So wrong that it's not what happened.
What's so baffling is that the last release was: https://github.com/mdn/kuma/commit/fb2d23f6af3c4fadd4085822aa0c171fd78d4773 which was 3 weeks ago. What it introduced has virtually nothing to do with CSS or .css files or anything like that.
Even after months on the team I still don't really understand how interactive examples really works but someone more familiar with how it's released and deployed and hosted. For one thing, the static .css files aren't aggressive cached so what might happen if one changes in the CDN and thee other doesn't or something like that?
peterbe
on 8 Jan 2020
@tobinmori It works and then it does not, it is

dgesteves
on 9 Jan 2020
Thank you!! Do you see anything interesting in the Web Console when that happens?
And does it go away when you refresh the page?
peterbe
on 9 Jan 2020
Hey, @peterbe yes some times when you refresh it corrects and some times when you refresh it breaks again as you can see on this gif ---->


dgesteves
on 10 Jan 2020
It's extremely hard to see but all that yellow text appears to be the same block of yellow text on the renders when it actually does work.
peterbe
on 10 Jan 2020
Yes, they are the same warnings.
Just updated the prev. comment with the console output.
dgesteves
on 10 Jan 2020
Yes, they are the same warnings.
Just updated the prev. comment with the console output.
Interestingly I see all of those, except for the first, mentioned Codota.com. Is there perhaps a browser extension from this website/service that you have installed?
If so, could you try disabling it, or accessing the site in a private window and see whether the problem goes away? Thanks so much for your help in debugging this.
schalkneethling
on 12 Jan 2020
@schalkneethling private browser still has the same issue but with a new error.
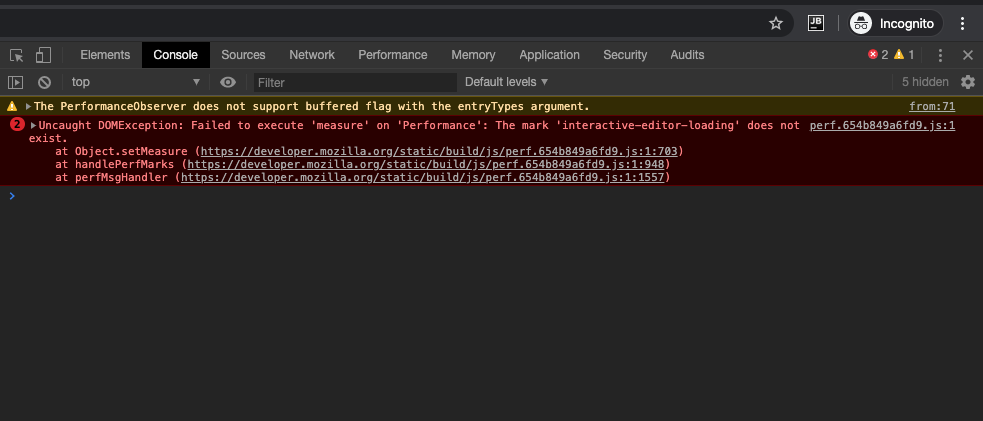
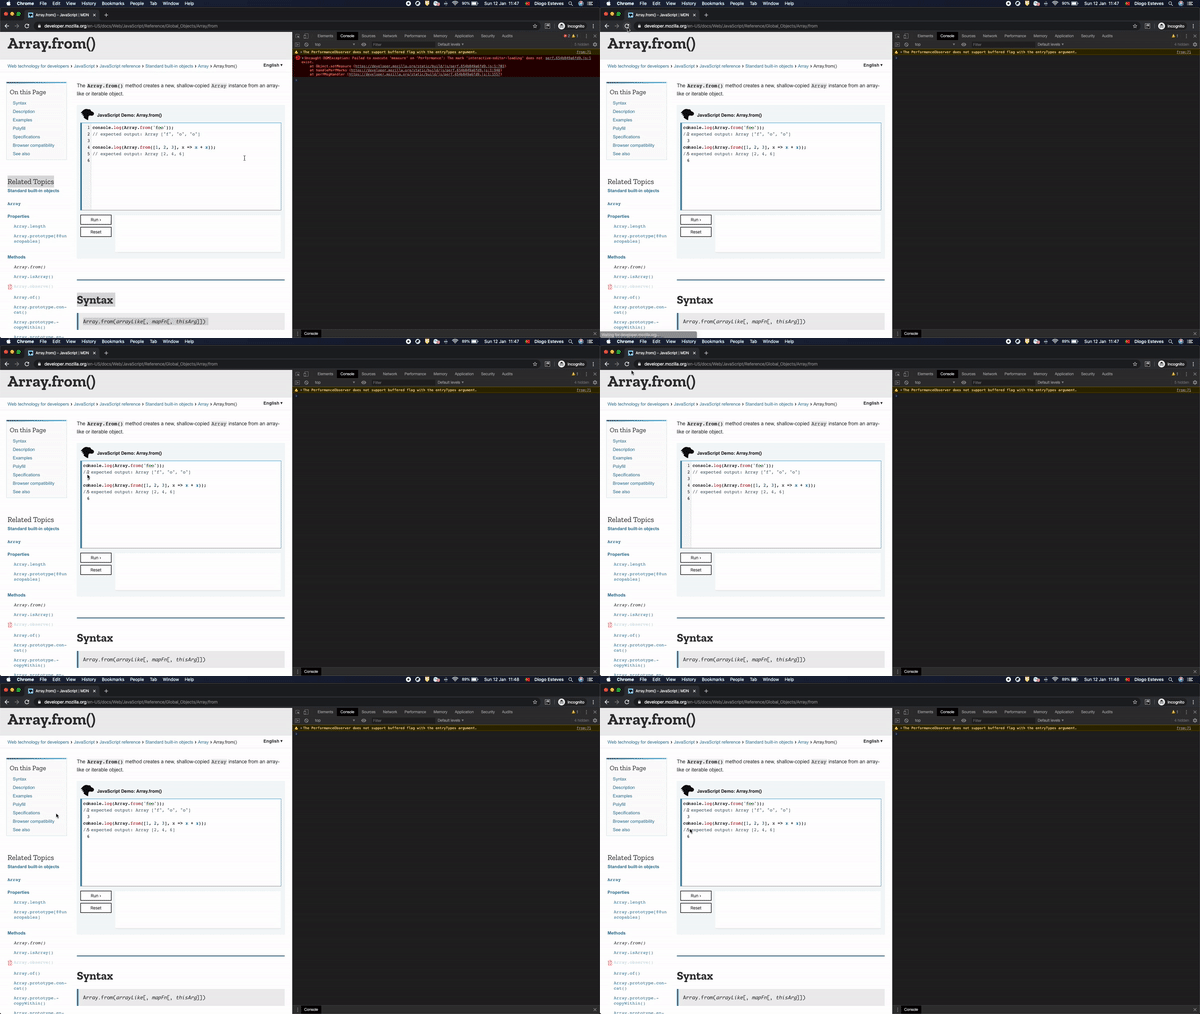
dgesteves
on 12 Jan 2020
Thank you @dgesteves for the additional info. Unfortunately, it seems like the error you highlighted is not related as shown in your screen recordings. I will take a look here as well and see whether I can reproduce the problem.
schalkneethling
on 13 Jan 2020
@schalkneethling this issue only happens on chrome, I tried firefox, safari and they are working fine.
Chrome V: Version 79.0.3945.117 (Official Build) (64-bit)
dgesteves
on 13 Jan 2020
Ah, that narrows it down. Thanks, @dgesteves
schalkneethling
on 13 Jan 2020
I don't know if this helps @schalkneethling but I reproduced it, in Chrome, and right-clicked to inspect the <div id="editor"> element. Then I dumped that (and pretty printed) to disk. Then I did the same with the <div id="editor"> element when things worked.
https://gist.github.com/peterbe/a9823299a3c9773e36a366ad6a59a804
peterbe
on 13 Jan 2020
I still don't know how to get that Uncaught DOMException in Chrome. But that seems pretty serious. We have a snippet of code that uses Performance and perhaps it's not protected with try{...}catch(...} enough.
peterbe
on 13 Jan 2020
This is the highest priority in the sprint. Please let's get this done, before we move on to other things.
atopal
on 13 Jan 2020
Btw, @schalkneethling - @atopal and I could reliably reproduce this upon opening a new tab in Chrome and loading the page from scratch. (if you reload an existing instance of the page in a tab, the err goes away).
A hypothesis - some sort of Chrome-specific race condition regarding CSS loading/rendering related to caching?
I could not reproduce this in FF or Safari.
tobinmori
on 13 Jan 2020
We have updated CodeMirror and there is a new release of Bob:
https://github.com/mdn/interactive-examples/pull/1525
I will do some testing locally to ensure nothing broke but I have also asked @wbamberg to kick the tyres.
schalkneethling
on 14 Jan 2020
Ok, https://github.com/mdn/interactive-examples/pull/1525 has been merged. In ~30min the new builds of interactive examples will be on production. 🤞
schalkneethling
on 14 Jan 2020
The new version of CodeMirror is live, and seems to work fine, but I still see the overlapping-line-numbers problem in Chrome :(.
 wbamberg
on 14 Jan 2020
wbamberg
on 14 Jan 2020
The new version of CodeMirror is live, and seems to work fine, but I still see the overlapping-line-numbers problem in Chrome :(.
Can you please verify the network (JS files) used inside the iframe?
As of 1min ago I see /js/codemirror-5-50-2.js which is the new CodeMirror build.
peterbe
on 14 Jan 2020

:(
I'm not 100% sure if I'm using Chrome right.
I was definitely able to reproduce it, as you can see, but when you "Open in a new Tab" it won't start with the Web Console open. And refreshing would solve it which makes it impossible to know if it solved or not solved it.
peterbe
on 14 Jan 2020
The new version of CodeMirror is live, and seems to work fine, but I still see the overlapping-line-numbers problem in Chrome :(.
Can you please verify the network (JS files) used inside the iframe?

when you "Open in a new Tab" it won't start with the Web Console open. And refreshing would solve it which makes it impossible to know if it solved or not solved it.
wbamberg
on 14 Jan 2020
+1 Confirming that the err still occurs, unfortunately; I'm using codemirror build 5-50-2. (Chrome)
tobinmori
on 14 Jan 2020
SOME PROGRESS! Hang on this is messy.
So, I manually edited the compiled browser JS (used prettier to make it slightly easier) so that when the e = CodeMirror(document.querySelector('#editor'), ...) gets created I injected something like this: e = window.CODEMIRROR = CodeMirror(document.querySelector('#editor'), ...). Now, after some crazy cache invalidation, and eventual reproduce in Chrome, I can change the context (in Chrome's dev tools) to the context of the iframe and have access to window.CODEMIRROR. Calling window.CODEMIRROR.refresh() fixes the gutter!!
Repro

Fix

That fixes it!
See https://github.com/codemirror/CodeMirror/issues/4412#issuecomment-263991409 for the root of the clue.
According to https://codemirror.net/doc/manual.html
cm.refresh()
If your code does something to change the size of the editor element (window resizes are already listened for), or unhides it, you should probably follow up by calling this method to ensure CodeMirror is still looking as intended. See also the autorefresh addon.
I have a feeling that https://codemirror.net/doc/manual.html#addon_autorefresh might be the ticket. It's kinda hard to know exactly how our iframe works but clearly there's something weird going on exclusively in some browsers (looking at you Chrome).
peterbe
on 14 Jan 2020
Turns out we are already doing that for the tabbed interface:
https://github.com/mdn/bob/blob/master/editor/js/editor-libs/tabby.js#L167
Definitely looks like autorefresh will make this easier by taking care of that automatically. Thanks, @peterbe
schalkneethling
on 15 Jan 2020
Great find Peter! \o/
atopal
on 15 Jan 2020
Turns out we are already doing that for the tabbed interface:
https://github.com/mdn/bob/blob/master/editor/js/editor-libs/tabby.js#L167
That's a bit worrying, because I see this problem with the HTML examples, too:

wbamberg
on 15 Jan 2020
That means that how we're doing .refresh() in tabby.js isn't working. Anyway. The change I introduced only fixed the JS editor. I guess we need to re-evaluate and try to add that addon to all editors.
peterbe
on 15 Jan 2020
Turns out we are already doing that for the tabbed interface:
https://github.com/mdn/bob/blob/master/editor/js/editor-libs/tabby.js#L167That's a bit worrying, because I see this problem with the HTML examples, too:
So, we are not doing that for the initial load. If you switch between the tabs does it fix itself?
schalkneethling
on 15 Jan 2020
I can unfortunately still reproduce this on production in Chrome. While it does not happen on the first load, refreshing the page in the new tab a couple of times(4-5) reproduces the issues. 😿
schalkneethling
on 20 Jan 2020
@schalkneethling on which page are you seeing that behavior? I was able to reproduce it reliably, but can't reproduce it at all anymore in the latest release version of Chrome (79)
atopal
on 20 Jan 2020
@schalkneethling on which page are you seeing that behavior? I was able to reproduce it reliably, but can't reproduce it at all anymore in the latest release version of Chrome (79)
I followed the steps outlined by Will on the related issue:
- Visit a page, say: https://developer.mozilla.org/en-US/docs/Web/JavaScript/Reference/Global_Objects/BigInt
- Right-click a link to a docs page from the sidebar, say https://developer.mozilla.org/en-US/docs/Web/JavaScript/Reference/Global_Objects/BigInt/asIntN, and select "Open Link in New Tab"
- Switch to the new tab.
schalkneethling
on 20 Jan 2020
Ah, alright. I thought this was the "open new tab" > "open MDN page" steps. Which wasn't reproducing for me anymore.
That said, even the steps you just outlined, I can't reproduce it.
atopal
on 20 Jan 2020
Unfortunately, I can reproduce this; initial load is fine, but the gutter bug appears after I hit reload on the right-clicked new tab. Chrome 79.
tobinmori
on 21 Jan 2020
Almost definitely a race condition. I can now reproduce again in about 20% of the reloads. I think this is fine for now, but I'd like to know if there is any way we can instrument this. I'd really like to know how often this is happening. Any ideas?
atopal
on 21 Jan 2020
I and @peterbe chatted about this briefly. The other option is to not use the plugin, and instead do something like:
onload = function() {
  setTimeout(() => {
      editor.refresh();
  }, 60);
}
The problem I see with instrumenting this is to know what to use as an event to send a GA event. There is no error that correlates with this happening so, it is hard to know when exactly it happened.
Perhaps there is a class or DOM element that is not injected and one can check for the presence/absence of it. At the same time, perhaps it is overkill and the times this does happen would be very rare now?
schalkneethling
on 21 Jan 2020
Well, the whole point is that we don't know whether it's rare or not, because we have no idea what triggers it. Maybe we should add a small feedback option, and ask users to report broken examples. We don't have a baseline to measure it against, but at least we could get a hint for the magnitude.
atopal
on 26 Jan 2020
There might be a way to tell, after a second or so, if the refresh didn’t
work. But if that’s the case we could just trigger the refresh.
I’d be happy to fix interactive examples but not sure where to find the
time :)
On Sun, Jan 26, 2020 at 7:40 AM Kadir Topal notifications@github.com
wrote:
Well, the whole point is that we don't know whether it's rare or not,
because we have no idea what triggers it. Maybe we should add a small
feedback option, and ask users to report broken examples. We don't have a
baseline to measure it against, but at least we could get a hint for the
magnitude.—
You are receiving this because you were mentioned.Reply to this email directly, view it on GitHub
https://github.com/mdn/kuma/issues/6310?email_source=notifications&email_token=AAAGQ4YAXOYNVZNLIKWATZTQ7WAFDA5CNFSM4KD2QKVKYY3PNVWWK3TUL52HS4DFVREXG43VMVBW63LNMVXHJKTDN5WW2ZLOORPWSZGOEJ5S5LY#issuecomment-578498223,
or unsubscribe
https://github.com/notifications/unsubscribe-auth/AAAGQ462IJTS6HNFO7ZG6RDQ7WAFDANCNFSM4KD2QKVA
.>
Peter Bengtsson
Mozilla MDN Web Docs
https://www.peterbe.com
peterbe
on 26 Jan 2020
@atopal can we close or table this for now?
tobinmori
on 3 Feb 2020
yeah, let's close this :(
atopal
on 3 Feb 2020
Related issues
 groovecoder
·
10Comments
peterbe
·
12Comments
schalkneethling
·
5Comments
groovecoder
·
10Comments
peterbe
·
12Comments
schalkneethling
·
5Comments
 yakshaG
·
3Comments
peterbe
·
7Comments
yakshaG
·
3Comments
peterbe
·
7Comments
Most helpful comment
@tobinmori It works and then it does not, it is
