Kubernetes: `delete pods` API call latencies shot up on large cluster tests
Updated issue description with latest findings:
50350 introduced a change to kubelet pod deletion that results in delete pod API calls from kubelets being concentrated immediately after container garbage collection.
When performing a deletion of large numbers (thousands) of pods across large numbers (hundreds) of nodes, the resulting concentrated delete calls from the kubelets cause increased latency of delete pods API calls above the target threshold:
Sep 27 14:34:14.484: INFO: WARNING Top latency metric: {Resource:pods Subresource: Verb:DELETE Latency:{Perc50:4.551ms Perc90:10.216ms Perc99:1.403002s Perc100:0s} Count:122966}
Not seen on https://k8s-gubernator.appspot.com/builds/kubernetes-jenkins/logs/ci-kubernetes-kubemark-gce-scale/
hoisted details from https://github.com/kubernetes/kubernetes/issues/51899#issuecomment-332868313 into description:
Graphs over a three minute window (both latency in ms and distribution of delete calls per second):
the delete calls from the gc controller merely set deletionTimestamp on the pod (which the kubelets observe and start shutting down the pods). the delete calls from the kubelet actually delete from etcd.


there were multiple spikes throughout the run (corresponding to deletions of 3000-pod replication controllers). here's a graph of delete calls that took more than one second throughout the whole run:

Seems like a kubelet-induced thundering herd, when deleting massive numbers of pods across massive numbers of nodes. kubemark's gc is stubbed since there are no real containers, so this isn't observed there
Original issue description follows:
From 5k-node density test run (no. 26) on last friday:
I0901 10:11:29.395] Sep  1 10:11:29.395: INFO: WARNING Top latency metric: {Resource:pods Subresource: Verb:LIST Latency:{Perc50:66.805ms Perc90:375.804ms Perc99:8.111217s Perc100:0s} Count:11911}
I0901 10:11:29.396] Sep  1 10:11:29.395: INFO: Top latency metric: {Resource:nodes Subresource: Verb:LIST Latency:{Perc50:417.103ms Perc90:1.090847s Perc99:2.336106s Perc100:0s} Count:1261}
I0901 10:11:29.396] Sep  1 10:11:29.395: INFO: WARNING Top latency metric: {Resource:nodes Subresource:status Verb:PATCH Latency:{Perc50:5.633ms Perc90:279.15ms Perc99:1.04109s Perc100:0s} Count:5543730}
I0901 10:11:29.396] Sep  1 10:11:29.395: INFO: Top latency metric: {Resource:pods Subresource:binding Verb:POST Latency:{Perc50:1.442ms Perc90:15.171ms Perc99:921.523ms Perc100:0s} Count:155096}
I0901 10:11:29.396] Sep  1 10:11:29.395: INFO: Top latency metric: {Resource:replicationcontrollers Subresource: Verb:POST Latency:{Perc50:3.13ms Perc90:218.472ms Perc99:886.065ms Perc100:0s} Count:5049}
And from the last healthy run (no. 23) of the test:
I0826 03:49:44.301] Aug 26 03:49:44.301: INFO: Top latency metric: {Resource:pods Subresource: Verb:LIST Latency:{Perc50:830.411ms Perc90:1.468316s Perc99:2.627309s Perc100:0s} Count:10615}
I0826 03:49:44.302] Aug 26 03:49:44.301: INFO: Top latency metric: {Resource:nodes Subresource: Verb:LIST Latency:{Perc50:337.423ms Perc90:427.443ms Perc99:998.426ms Perc100:0s} Count:1800}
I0826 03:49:44.302] Aug 26 03:49:44.301: INFO: Top latency metric: {Resource:apiservices Subresource: Verb:PUT Latency:{Perc50:954µs Perc90:5.726ms Perc99:138.528ms Perc100:0s} Count:840}
I0826 03:49:44.302] Aug 26 03:49:44.301: INFO: Top latency metric: {Resource:namespaces Subresource: Verb:GET Latency:{Perc50:445µs Perc90:2.641ms Perc99:83.57ms Perc100:0s} Count:1608}
I0826 03:49:44.302] Aug 26 03:49:44.301: INFO: Top latency metric: {Resource:nodes Subresource:status Verb:PATCH Latency:{Perc50:3.22ms Perc90:9.449ms Perc99:55.588ms Perc100:0s} Count:7033941}
This is a huge increase we're seeing:
LIST pods : 2.6s -> 8.1s
LIST nodes: 1s -> 2.3s
PATCH node-status: 56ms -> 1s
...
cc @kubernetes/sig-api-machinery-bugs @kubernetes/sig-scalability-misc @smarterclayton @wojtek-t @gmarek
 shyamjvs
All 142 comments
I'm trying to find the offending PR(s). The diff is too huge across those runs.
Luckily this is even seen on relatively smaller clusters for e.g kubemark-500 - https://k8s-testgrid.appspot.com/sig-scalability#kubemark-500
shyamjvs
on 4 Sep 2017
My strong feeling is that it may be related to pagination.
If I'm right, https://github.com/kubernetes/kubernetes/pull/51876 should hopefully fix the problem.
@smarterclayton
 wojtek-t
on 4 Sep 2017
wojtek-t
on 4 Sep 2017
But this is mostly a guess and it may also be something different.
wojtek-t
on 4 Sep 2017
@kubernetes/test-infra-maintainers We don't have any logs (except the build-log from jenkins) for run-26 of ci-kubernetes-e2e-gce-scale-performance because jenkins crashed midway in the test:
ERROR: Connection was broken: java.io.IOException: Unexpected termination of the channel
    at hudson.remoting.SynchronousCommandTransport$ReaderThread.run(SynchronousCommandTransport.java:50)
Caused by: java.io.EOFException
    at java.io.ObjectInputStream$PeekInputStream.readFully(ObjectInputStream.java:2351)
    at java.io.ObjectInputStream$BlockDataInputStream.readShort(ObjectInputStream.java:2820)
Such failures (that too right at the end of the run) can hit us really hard wrt debugging.
shyamjvs
on 4 Sep 2017
@wojtek-t We're also seeing increase in the patch latencies. So there probably is another regression too?
shyamjvs
on 4 Sep 2017
Till run 8132, kubemark-500 seemed fine:
    {
      "data": {
        "Perc50": 31.303,
        "Perc90": 39.326,
        "Perc99": 59.415
      },
      "unit": "ms",
      "labels": {
        "Count": "43",
        "Resource": "nodes",
        "Subresource": "",
        "Verb": "LIST"
      }
    },
We had some startup failures in b/w and it seems to shot up starting from run 8141:
    {
      "data": {
        "Perc50": 213.34,
        "Perc90": 608.223,
        "Perc99": 1014.937
      },
      "unit": "ms",
      "labels": {
        "Count": "53",
        "Resource": "nodes",
        "Subresource": "",
        "Verb": "LIST"
      }
    },
Looking at the diff right now.
shyamjvs
on 4 Sep 2017
Another possiblity (that you mentioned to me offline) is:
https://github.com/kubernetes/kubernetes/pull/48287
I initially doubted about it, but now when I think about it, maybe it's about memory allocations (I didn't look carefully, but maybe it's much higher with json-iter)?
@thockin - FYI (still just my guess)
wojtek-t
on 4 Sep 2017
Anyway - @shyamjvs we need more data about what other metrics has changed (cpu usage, allocations, number of API calls, ...)
wojtek-t
on 4 Sep 2017
After eliminating trivial and unrelated PRs, the following are left:
- Revert "CPU manager wiring and
nonepolicy" #51804 (I think this one is only affecting kubelet, so unlikely) - Split APIVersion into APIGroup and APIVersion in audit events #50007 (this one's just affecting audit events)
- Use json-iterator instead of ugorji for JSON. #48287 (I'm most suspicious about this)
- add information for subresource kind determination #49971 (This one is adding group and version fields to the APIResource)
shyamjvs
on 4 Sep 2017
Anyway - @shyamjvs we need more data about what other metrics has changed (cpu usage, allocations, number of API calls, ...)
Yup.. I'm doing some local experiments to verify this. Also merged https://github.com/kubernetes/kubernetes/pull/51892 to start getting kubemark master logs.
shyamjvs
on 4 Sep 2017
Can you grab CPU profile from the master when running test? It should help you with figuring out the cause.
 gmarek
on 4 Sep 2017
gmarek
on 4 Sep 2017
Adding release team: @jdumars @calebamiles @spiffxp
gmarek
on 4 Sep 2017
So I fetched the CPU & memory usage for the load test from the last > 200 runs of kubemark-500, and I don't see any noticeable increase. Actually it appears like it improved:


shyamjvs
on 4 Sep 2017
There are some consecutive failed runs (due to testinfra bugs / regressions) leading to missing points or temporary spikes... Neglect the noise
shyamjvs
on 4 Sep 2017
I ran the tests locally on kubemark-500 against head (commit ffed1d340843ed) and it went through fine with low latency values like before. Re-running again to see if it's flaky. I'll continue digging into it tomorrow.
shyamjvs
on 4 Sep 2017
Unless you've turned on all alpha features on kubemark you shouldn't have
seen an increase with pagination (which is sounds like further
investigation eliminated). If you did turn on alpha features on kubemark
that's exactly the validation I was looking for with chunking (that no
regression occurred), which is good. Chunking would increase average
latency but should decrease tail latency in most cases (naive chunking
would increase error rates).
On Mon, Sep 4, 2017 at 5:23 PM, Shyam JVS notifications@github.com wrote:
I ran the tests locally on kubemark-500 against head (commit ffed1d3
https://github.com/kubernetes/kubernetes/commit/ffed1d340843ed5617a4bdfe5b16a9490476843a)
and it went through fine with low latency values like before. Re-running
again to see if it's flaky. I'll continue digging into it tomorrow.—
You are receiving this because you were mentioned.
Reply to this email directly, view it on GitHub
https://github.com/kubernetes/kubernetes/issues/51899#issuecomment-327029719,
or mute the thread
https://github.com/notifications/unsubscribe-auth/ABG_p_ODR8S6ycmF1ppTOEZ8Bub3aVsaks5sfGpSgaJpZM4PL3gt
.
 smarterclayton
on 5 Sep 2017
smarterclayton
on 5 Sep 2017
Ok... So the reason for kubemark failing is different. As @wojtek-t pointed out, the kubemark master is not rightly sized.
I recently made some changes in test-infra around auto-calculation of kubemark master-size and seems like it didn't take effect.
shyamjvs
on 5 Sep 2017
Btw - that also explains why the failure wasn't reproducing locally for me. Because I bypassed all the testinfra logic by manually starting the clusters, it got rightly calculated.
shyamjvs
on 5 Sep 2017
@smarterclayton Thanks for the explanation. I checked that neither of kubemark nor our real cluster tests are using pagination (as ?limit=1 is still returning all the results).
So the real 5k-node test failures seems unrelated to it.
shyamjvs
on 5 Sep 2017
shyamjvs
on 7 Sep 2017
@wojtek-t @shyamjvs : how bad is the situation here? Still a release blocker?
What's the next theory to test? ( json-iterator vs ugorji )
Thanks,
Dims
 dims
on 14 Sep 2017
dims
on 14 Sep 2017
It's not too bad (we're seeing a couple of high-latency requests), but there definitely seems to be a regression. It is a release-blocker.
The following are the api calls failing to satisfy our 1s SLO for 99th %ile latency (from last run i.e run no. 34 - https://k8s-gubernator.appspot.com/build/kubernetes-jenkins/logs/ci-kubernetes-e2e-gce-scale-performance/34):
I0914 00:49:55.355] Sep 14 00:49:55.354: INFO: WARNING Top latency metric: {Resource:pods Subresource: Verb:DELETE Latency:{Perc50:4.894ms Perc90:1.485486s Perc99:5.108352s Perc100:0s} Count:311825}
I0914 00:49:55.356] Sep 14 00:49:55.354: INFO: WARNING Top latency metric: {Resource:configmaps Subresource: Verb:POST Latency:{Perc50:4.018ms Perc90:757.506ms Perc99:1.924344s Perc100:0s} Count:342}
I looked into the apiserver logs and I'm seeing the following trace for a large no. of delete pod calls:
I0914 00:06:54.479459       8 trace.go:76] Trace[539192665]: "Delete /api/v1/namespaces/e2e-tests-density-30-32-wqj9b/pods/density150000-31-e5cb99f6-98b6-11e7-aeb5-0242ac110009-4mw6l" (started: 2017-09-14 00:06:48.217160315 +0000 UTC) (total time: 6.262275566s):
Trace[539192665]: [6.256412547s] [6.256412547s] About to delete object from database
That trace corresponds to the time taken from that start of the delete resource handler function to the point just before calling the delete on storage, more specifically this piece of code - https://github.com/kubernetes/kubernetes/blob/9aef242a4c1e423270488206670d3d1f23eaab52/staging/src/k8s.io/apiserver/pkg/endpoints/handlers/rest.go#L931-L994.
The most suspicious parts to me look like the auditing step and the admission control step. I'll send a PR adding traces for those steps too.
shyamjvs
on 15 Sep 2017
@shyamjvs So we can move this out of 1.8 milestone?
dims
on 18 Sep 2017
In case the issues you see are caused by the json-iterator merge at #48287
FYI: See ugorji/go@54210f4e076c57f351166f0ed60e67d3fca57a36
Substantial performance updates that bring the performance without code-generation in line with what you get from json-iterator. we did this while only using 'unsafe' in very targeted places, with a build tag to switch to 'no unsafe' mode. See helper_unsafe.go to see the only functions where we used unsafe, with the equivalent 'safe' versions, to give you some peace of mind.
Results are attached, but I will reproduce the benchcmp output comparing results without codecgen and then with codecgen, here for convenience. These were done using the benchmark suite in https://github.com/ugorji/go-codec-bench , which uses a recursive embedding of a large detailed struct. The numbers speak for themselves. It might be worth going reverting sooner than later.
   go test -bench "_(Json|Cbor)" -benchmem -bd 2 -tags "x" > no-codecgen.bench.out.txt
   go test -bench "_(Json|Cbor)" -benchmem -bd 2 -tags "x codecgen" > with-codecgen.bench.out.txt
   benchcmp no-codecgen.bench.out.txt with-codecgen.bench.out.txt > benchcmp.out.txt
Results:
benchmark                          old ns/op     new ns/op     delta
Benchmark__Cbor_______Encode-8     69672         37051         -46.82%
Benchmark__Json_______Encode-8     115274        87775         -23.86%
Benchmark__JsonIter___Encode-8     133558        133635        +0.06%
Benchmark__Std_Json___Encode-8     165240        157007        -4.98%
Benchmark__Cbor_______Decode-8     164396        131192        -20.20%
Benchmark__Json_______Decode-8     207014        156589        -24.36%
Benchmark__JsonIter___Decode-8     209418        208993        -0.20%
Benchmark__Std_Json___Decode-8     553650        557783        +0.75%

benchmark                          old allocs     new allocs     delta
Benchmark__Cbor_______Encode-8     32             7              -78.12%
Benchmark__Json_______Encode-8     45             20             -55.56%
Benchmark__JsonIter___Encode-8     1013           1013           +0.00%
Benchmark__Std_Json___Encode-8     560            560            +0.00%
Benchmark__Cbor_______Decode-8     713            697            -2.24%
Benchmark__Json_______Decode-8     756            736            -2.65%
Benchmark__JsonIter___Decode-8     2244           2244           +0.00%
Benchmark__Std_Json___Decode-8     1967           1967           +0.00%

benchmark                          old bytes     new bytes     delta
Benchmark__Cbor_______Encode-8     5529          2320          -58.04%
Benchmark__Json_______Encode-8     6290          3072          -51.16%
Benchmark__JsonIter___Encode-8     40496         40496         +0.00%
Benchmark__Std_Json___Encode-8     65248         65248         +0.00%
Benchmark__Cbor_______Decode-8     34384         34104         -0.81%
Benchmark__Json_______Decode-8     42976         42608         -0.86%
Benchmark__JsonIter___Decode-8     60128         60128         +0.00%
Benchmark__Std_Json___Decode-8     58320         58320         +0.00%
benchcmp.out.txt
no-codecgen.bench.out.txt
with-codecgen.bench.out.txt
 ugorji
on 19 Sep 2017
ugorji
on 19 Sep 2017
Note that there should be no JSON in use in these suites, and if it is
that itself is a bug.
We should be using protobuf for all intracluster calls except garbage
collection on CRD and extension resources.
smarterclayton
on 19 Sep 2017
@smarterclayton - I believe we do patches though JSON, aren't we?
gmarek
on 19 Sep 2017
Patches were never decoded using ugorji, so the json-iterator switch wouldn’t have affected it, and application of strategic merge patches is done on intermediate map[string]interface{} objects, and doesn’t round trip out to JSON
 liggitt
on 19 Sep 2017
liggitt
on 19 Sep 2017
I don't think it's the ugorji change causing the regression (though I was originally suspecting it) - for e.g consider patch node-status calls (which is the main one showing regression) and those calls are made by kubelet and npd, both of which are using protobufs to talk to the apiserver. Further as @smarterclayton and @liggitt confirmed, these are normal intracluster calls (no CRD/extension involved) used with strategic merge patching.
shyamjvs
on 19 Sep 2017
I looked into it further today and here's what I found:
- We've started noticing increased latencies since run-27 of our 5k performance job (https://k8s-testgrid.appspot.com/google-gce-scale#gce-scale-performance). The last healthy run was run-23 (which had normal latencies). Here's the diff of the commits across the runs (a bit huge) - https://github.com/kubernetes/kubernetes/compare/11299e363c538c...034c40be6f465d
- In each run since 27, the api calls violating the SLO have been changing (once it's
POST configmaps, once it'sPOST replicationcontrollers, etc). HoweverPATCH node statuslatency seems to be consistently bad across all the runs.
In run-23 it's 99th %ile was 55ms (in run-18 it was ~200ms which is still not much):
INFO: Top latency metric: {Resource:nodes Subresource:status Verb:PATCH Latency:{Perc50:3.22ms Perc90:9.449ms Perc99:55.588ms Perc100:0s} Count:7033941}
and in run-27 (the next useful run) it's 99th %ile shot up to more than 1s (order of magnitude increase):
INFO: WARNING Top latency metric: {Resource:nodes Subresource:status Verb:PATCH Latency:{Perc50:4.186ms Perc90:83.292ms Perc99:1.061816s Perc100:0s} Count:7063581}
and it stayed that high since then. From the apiserver logs, I find many such traces for those calls:
I0918 20:24:52.548401       7 trace.go:76] Trace[176777519]: "GuaranteedUpdate etcd3: *api.Node" (started: 2017-09-18 20:24:51.709667942 +0000 UTC) (total time: 838.710254ms):
Trace[176777519]: [838.643838ms] [837.934826ms] Transaction committed
And from the code that seems to be the time taken b/w when the transaction was prepared and when it got committed. More precisely this piece of code:
https://github.com/kubernetes/kubernetes/blob/a238fbd2539addc525bb740ae801a42524e5b706/staging/src/k8s.io/apiserver/pkg/storage/etcd3/store.go#L350-L362
@liggitt @smarterclayton @sttts @deads2k - Has anything around patch node-status change recently? More specifically, have we started using guaranteed etcd3 updates for them or you think it's sth else? Any pointers here would be greatly appreciated :)
shyamjvs
on 19 Sep 2017
cc @kubernetes/kubernetes-release-managers @jdumars @dims - This is a clear regression we're seeing here and should definitely be blocking the release on this (as discussed in the burndown meeting today).
shyamjvs
on 19 Sep 2017
Has anything around patch node-status change recently? More specifically, have we started using guaranteed etcd3 updates for them or you think it's sth else?
all updates (patch, update, graceful delete, etc) use GuaranteedUpdate under the covers. That has not changed. Are we not able to narrow the commit range down further? Did we change etcd versions in that range?
liggitt
on 19 Sep 2017
I think @wojtek-t was doing some optimization in Patch path.
gmarek
on 20 Sep 2017
@shyamjvs did you mention there was some data you wanted to share in the meeting yesterday? Are we any closer to figuring out what we need to do for this?
dims
on 20 Sep 2017
483ee1853b is a minor one that would be called during a number of flows.
On Wed, Sep 20, 2017 at 10:45 AM, Davanum Srinivas <[email protected]
wrote:
@shyamjvs https://github.com/shyamjvs did you mention there was some
data you wanted to share in the meeting yesterday? Are we any closer to
figuring out what we need to do for this?—
You are receiving this because you were mentioned.
Reply to this email directly, view it on GitHub
https://github.com/kubernetes/kubernetes/issues/51899#issuecomment-330874607,
or mute the thread
https://github.com/notifications/unsubscribe-auth/ABG_p-zsFvKci3NlSZ2tAn92JgN5xrg-ks5skSUHgaJpZM4PL3gt
.
smarterclayton
on 21 Sep 2017
We didn't enable a4542ae528 by default, right?
On Thu, Sep 21, 2017 at 12:24 AM, Clayton Coleman ccoleman@redhat.com
wrote:
483ee1853b is a minor one that would be called during a number of flows.
On Wed, Sep 20, 2017 at 10:45 AM, Davanum Srinivas <
[email protected]> wrote:@shyamjvs https://github.com/shyamjvs did you mention there was some
data you wanted to share in the meeting yesterday? Are we any closer to
figuring out what we need to do for this?—
You are receiving this because you were mentioned.
Reply to this email directly, view it on GitHub
https://github.com/kubernetes/kubernetes/issues/51899#issuecomment-330874607,
or mute the thread
https://github.com/notifications/unsubscribe-auth/ABG_p-zsFvKci3NlSZ2tAn92JgN5xrg-ks5skSUHgaJpZM4PL3gt
.
smarterclayton
on 21 Sep 2017
9002dfcd0a I have trouble believing would lead to tail latency (more like
base latency)
On Thu, Sep 21, 2017 at 12:25 AM, Clayton Coleman ccoleman@redhat.com
wrote:
We didn't enable a4542ae528 by default, right?
On Thu, Sep 21, 2017 at 12:24 AM, Clayton Coleman ccoleman@redhat.com
wrote:483ee1853b is a minor one that would be called during a number of flows.
On Wed, Sep 20, 2017 at 10:45 AM, Davanum Srinivas <
[email protected]> wrote:@shyamjvs https://github.com/shyamjvs did you mention there was some
data you wanted to share in the meeting yesterday? Are we any closer to
figuring out what we need to do for this?—
You are receiving this because you were mentioned.
Reply to this email directly, view it on GitHub
https://github.com/kubernetes/kubernetes/issues/51899#issuecomment-330874607,
or mute the thread
https://github.com/notifications/unsubscribe-auth/ABG_p-zsFvKci3NlSZ2tAn92JgN5xrg-ks5skSUHgaJpZM4PL3gt
.
smarterclayton
on 21 Sep 2017
Easy way to verify the json-iter stuff is turn it off completely (go back
to json.Unmarshal) and see if latency numbers get worse.
On Thu, Sep 21, 2017 at 12:27 AM, Clayton Coleman ccoleman@redhat.com
wrote:
9002dfcd0a I have trouble believing would lead to tail latency (more like
base latency)On Thu, Sep 21, 2017 at 12:25 AM, Clayton Coleman ccoleman@redhat.com
wrote:We didn't enable a4542ae528 by default, right?
On Thu, Sep 21, 2017 at 12:24 AM, Clayton Coleman ccoleman@redhat.com
wrote:483ee1853b is a minor one that would be called during a number of flows.
On Wed, Sep 20, 2017 at 10:45 AM, Davanum Srinivas <
[email protected]> wrote:@shyamjvs https://github.com/shyamjvs did you mention there was some
data you wanted to share in the meeting yesterday? Are we any closer to
figuring out what we need to do for this?—
You are receiving this because you were mentioned.
Reply to this email directly, view it on GitHub
https://github.com/kubernetes/kubernetes/issues/51899#issuecomment-330874607,
or mute the thread
https://github.com/notifications/unsubscribe-auth/ABG_p-zsFvKci3NlSZ2tAn92JgN5xrg-ks5skSUHgaJpZM4PL3gt
.
smarterclayton
on 21 Sep 2017
Are we getting mutex contention on d3546434b7?
On Thu, Sep 21, 2017 at 12:28 AM, Clayton Coleman ccoleman@redhat.com
wrote:
Easy way to verify the json-iter stuff is turn it off completely (go back
to json.Unmarshal) and see if latency numbers get worse.On Thu, Sep 21, 2017 at 12:27 AM, Clayton Coleman ccoleman@redhat.com
wrote:9002dfcd0a I have trouble believing would lead to tail latency (more like
base latency)On Thu, Sep 21, 2017 at 12:25 AM, Clayton Coleman ccoleman@redhat.com
wrote:We didn't enable a4542ae528 by default, right?
On Thu, Sep 21, 2017 at 12:24 AM, Clayton Coleman ccoleman@redhat.com
wrote:483ee1853b is a minor one that would be called during a number of flows.
On Wed, Sep 20, 2017 at 10:45 AM, Davanum Srinivas <
[email protected]> wrote:@shyamjvs https://github.com/shyamjvs did you mention there was
some data you wanted to share in the meeting yesterday? Are we any closer
to figuring out what we need to do for this?—
You are receiving this because you were mentioned.
Reply to this email directly, view it on GitHub
https://github.com/kubernetes/kubernetes/issues/51899#issuecomment-330874607,
or mute the thread
https://github.com/notifications/unsubscribe-auth/ABG_p-zsFvKci3NlSZ2tAn92JgN5xrg-ks5skSUHgaJpZM4PL3gt
.
smarterclayton
on 21 Sep 2017
There's also the client-go changes a804d440c3 - I don't remember how well
those are scoped but possible it's impacting other calls.
On Thu, Sep 21, 2017 at 12:29 AM, Clayton Coleman ccoleman@redhat.com
wrote:
Are we getting mutex contention on d3546434b7?
On Thu, Sep 21, 2017 at 12:28 AM, Clayton Coleman ccoleman@redhat.com
wrote:Easy way to verify the json-iter stuff is turn it off completely (go back
to json.Unmarshal) and see if latency numbers get worse.On Thu, Sep 21, 2017 at 12:27 AM, Clayton Coleman ccoleman@redhat.com
wrote:9002dfcd0a I have trouble believing would lead to tail latency (more
like base latency)On Thu, Sep 21, 2017 at 12:25 AM, Clayton Coleman ccoleman@redhat.com
wrote:We didn't enable a4542ae528 by default, right?
On Thu, Sep 21, 2017 at 12:24 AM, Clayton Coleman ccoleman@redhat.com
wrote:483ee1853b is a minor one that would be called during a number of
flows.On Wed, Sep 20, 2017 at 10:45 AM, Davanum Srinivas <
[email protected]> wrote:@shyamjvs https://github.com/shyamjvs did you mention there was
some data you wanted to share in the meeting yesterday? Are we any closer
to figuring out what we need to do for this?—
You are receiving this because you were mentioned.
Reply to this email directly, view it on GitHub
https://github.com/kubernetes/kubernetes/issues/51899#issuecomment-330874607,
or mute the thread
https://github.com/notifications/unsubscribe-auth/ABG_p-zsFvKci3NlSZ2tAn92JgN5xrg-ks5skSUHgaJpZM4PL3gt
.
smarterclayton
on 21 Sep 2017
02281898f8 is unlikely to add a lot of work to the api server, but would be
a few of the resources mentioned and only create spot.
On Thu, Sep 21, 2017 at 12:31 AM, Clayton Coleman ccoleman@redhat.com
wrote:
There's also the client-go changes a804d440c3 - I don't remember how well
those are scoped but possible it's impacting other calls.On Thu, Sep 21, 2017 at 12:29 AM, Clayton Coleman ccoleman@redhat.com
wrote:Are we getting mutex contention on d3546434b7?
On Thu, Sep 21, 2017 at 12:28 AM, Clayton Coleman ccoleman@redhat.com
wrote:Easy way to verify the json-iter stuff is turn it off completely (go
back to json.Unmarshal) and see if latency numbers get worse.On Thu, Sep 21, 2017 at 12:27 AM, Clayton Coleman ccoleman@redhat.com
wrote:9002dfcd0a I have trouble believing would lead to tail latency (more
like base latency)On Thu, Sep 21, 2017 at 12:25 AM, Clayton Coleman ccoleman@redhat.com
wrote:We didn't enable a4542ae528 by default, right?
On Thu, Sep 21, 2017 at 12:24 AM, Clayton Coleman <[email protected]
wrote:
483ee1853b is a minor one that would be called during a number of
flows.On Wed, Sep 20, 2017 at 10:45 AM, Davanum Srinivas <
[email protected]> wrote:@shyamjvs https://github.com/shyamjvs did you mention there was
some data you wanted to share in the meeting yesterday? Are we any closer
to figuring out what we need to do for this?—
You are receiving this because you were mentioned.
Reply to this email directly, view it on GitHub
https://github.com/kubernetes/kubernetes/issues/51899#issuecomment-330874607,
or mute the thread
https://github.com/notifications/unsubscribe-auth/ABG_p-zsFvKci3NlSZ2tAn92JgN5xrg-ks5skSUHgaJpZM4PL3gt
.
smarterclayton
on 21 Sep 2017
@shyamjvs @gmarek @smarterclayton FYI, this looks like the most probable reason for delaying 1.8.0. How can I or the release team help you out?
 jdumars
on 21 Sep 2017
jdumars
on 21 Sep 2017
Agree this should probably block the release. What can I do to help?
 thockin
on 21 Sep 2017
thockin
on 21 Sep 2017
Even someone who can help do some mechanical bisecting would probably
help. I don't think we have a minimal reproducer though which is
complicating this.
On Thu, Sep 21, 2017 at 11:24 AM, Tim Hockin notifications@github.com
wrote:
Agree this should probably block the release. What can I do to help?
—
You are receiving this because you were mentioned.
Reply to this email directly, view it on GitHub
https://github.com/kubernetes/kubernetes/issues/51899#issuecomment-331191088,
or mute the thread
https://github.com/notifications/unsubscribe-auth/ABG_p2O2uX8YFJCns2lq0lKJcACCJG9hks5skn_IgaJpZM4PL3gt
.
smarterclayton
on 21 Sep 2017
@smarterclayton Thanks a lot for spotting those PRs - I'll try running the tests with those PRs reverted as a last resort.
I'm suspecting that it's because we're testing with increased qps for apiserver (--max-requests-inflight=3000 --max-mutating-requests-inflight=1000) which is double of what we're using for kubemark (where the latency seems fine, though the test itself is failing due to a different reason). I'm experimenting with lower qps now.
shyamjvs
on 21 Sep 2017
@smarterclayton / @lavalamp Could one of you lgtm https://github.com/kubernetes/kubernetes/pull/52732 to at least remove the fake violations?
shyamjvs
on 21 Sep 2017
Are we getting mutex contention on d354643?
I don't think so, but if read contention ends up being the issue, I made a lock-free version at https://github.com/kubernetes/kubernetes/pull/52860
liggitt
on 21 Sep 2017
Ok.. I checked with reduced qps and I'm still seeing high latency calls in the density test:
I0921 21:43:02.755] Sep 21 21:43:02.754: INFO: WARNING Top latency metric: {Resource:pods Subresource: Verb:DELETE Scope:namespace Latency:{Perc50:5.572ms Perc90:1.529239s Perc99:7.868101s Perc100:0s} Count:338819}
I0921 21:43:02.755] Sep 21 21:43:02.754: INFO: WARNING Top latency metric: {Resource:configmaps Subresource: Verb:POST Scope:namespace Latency:{Perc50:3.852ms Perc90:1.152249s Perc99:3.848893s Perc100:0s} Count:340}
I'll switch back to the original qps and will start to manually bisect and test. Would run only the density test to save time.
shyamjvs
on 22 Sep 2017
@kubernetes/test-infra-maintainers I'm getting the following error while running go run hack/e2e.go -v -test:
Running Suite: Kubernetes e2e suite
===================================
Random Seed: 1506095473 - Will randomize all specs
Will run 1 of 678 specs

Sep 22 17:51:14.149: INFO: Fetching cloud provider for "gce"

I0922 17:51:14.201332   22354 gce.go:584] Using DefaultTokenSource <nil>
Sep 22 17:51:14.201: INFO: Failed to setup provider config: Error building GCE/GKE provider: google: could not find default credentials. See https://developers.google.com/accounts/docs/application-default-credentials for more information.
Failure [0.057 seconds]
[BeforeSuite] BeforeSuite
/go/src/k8s.io/kubernetes/_output/dockerized/go/src/k8s.io/kubernetes/test/e2e/e2e.go:240

  Sep 22 17:51:14.201: Failed to setup provider config: Error building GCE/GKE provider: google: could not find default credentials. See https://developers.google.com/accounts/docs/application-default-credentials for more information.

  /go/src/k8s.io/kubernetes/_output/dockerized/go/src/k8s.io/kubernetes/test/e2e/e2e.go:141
Any idea why I'm seeing this? My k8s has been built against commit 11299e363.
shyamjvs
on 22 Sep 2017
fyi - go run hack/e2e.go -v -up works fine.
shyamjvs
on 22 Sep 2017
Has anyone looked at the PUT calls? The most obvious thing that could be wrong (I think) is something new/changed on the nodes that is modifying the node status via PUT and consistently winning the race with kubelet's PATCHes.
 lavalamp
on 22 Sep 2017
lavalamp
on 22 Sep 2017
The hypothetical extra PUT calls would not have high latency (as they'd just get conflicts if they lose the race). They also wouldn't happen in kubemark, assuming it's a non-kubelet entity that is the offender. That seems consistent with everything stated in this bug, although it's a bit hard to follow.
lavalamp
on 22 Sep 2017
Can someone link to a test run containing the problem, so I can read the apiserver log?
lavalamp
on 22 Sep 2017
@shyamjvs I think you might need to run gcloud auth application-default login.
 ixdy
on 22 Sep 2017
ixdy
on 22 Sep 2017
(you have to run both gcloud auth login and gcloud auth application-default login, because reasons.)
ixdy
on 22 Sep 2017
Another similar hypothesis is that now node problem detector and kubelet are trying to modify the same field, so there's new contention even though it's the same number of patch calls.
lavalamp
on 22 Sep 2017
Grepping through logs, indeed, I see the node controller is getting a bunch of conflicts on puts:
I0922 09:02:23.479636 7 wrap.go:42] PUT /api/v1/nodes/gce-scale-cluster-minion-group-3-dpvj/status: (1.235319ms) 409 [[kube-controller-manager/v1.9.0 (linux/amd64) kubernetes/158f6b7/system:serviceaccount:kube-system:node-controller] [::1]:54918]
Here are some PRs that touched NodeController and/or controller_utils.go, from most recent to least
https://github.com/kubernetes/kubernetes/pull/51603 (merged Sep 6)
https://github.com/kubernetes/kubernetes/pull/49257 (merged Aug 31)
https://github.com/kubernetes/kubernetes/pull/50738 (merged Aug 29)
https://github.com/kubernetes/kubernetes/pull/49524 (merged Aug 7)
https://github.com/kubernetes/kubernetes/pull/49870 (merged Aug 1)
https://github.com/kubernetes/kubernetes/pull/47952 (merged Jul 12)
In theory all of this stuff is supposed to be disabled by default (except the first one, which is a bugfix), see
https://github.com/kubernetes/kubernetes/pull/49547
However, I did not review any of these PRs.
/cc @gmarek @k82cn
 davidopp
on 22 Sep 2017
davidopp
on 22 Sep 2017
@ixdy Thanks a lot for the suggestion, that worked. Running the test against the last commit which seemed healthy to confirm.
Has anyone looked at the PUT calls?
@lavalamp I'm supposing you mean PUT calls for etcd (because from the apiserver logs I'm seeing only patches). Could you tell me how can I check for PUT calls?
something new/changed on the nodes that is modifying the node status via PUT and consistently winning the race with kubelet's PATCHes.
I'm not seeing any PUTs for node status from the apiserver logs. It's npd and kubelet which are updating them (almost all the time) and they're both using PATCHs:
I0918 17:05:58.357710       7 wrap.go:42] PATCH /api/v1/nodes/gce-scale-cluster-minion-group-554x/status: (2.195508ms) 200 [[node-problem-detector/v1.4.0 (linux/amd64) kubernetes/$Format] 35.190.133.106:55912]
I0918 17:06:01.312183       7 wrap.go:42] PATCH /api/v1/nodes/gce-scale-cluster-minion-group-2-7sbx/status: (67.75199ms) 200 [[kubelet/v1.9.0 (linux/amd64) kubernetes/8ca1d9f] 35.196.121.123:51702]
I0918 17:05:58.359507       7 wrap.go:42] PATCH /api/v1/nodes/gce-scale-cluster-minion-group-1-j446/status: (3.796612ms) 200 [[node-problem-detector/v1.4.0 (linux/amd64) kubernetes/$Format] 35.185.60.137:43894]
I0918 17:06:01.312296       7 wrap.go:42] PATCH /api/v1/nodes/gce-scale-cluster-minion-group-1-b113/status: (67.888708ms) 200 [[kubelet/v1.9.0 (linux/amd64) kubernetes/8ca1d9f] 35.196.142.250:35162]
Can someone link to a test run containing the problem, so I can read the apiserver log?
Pretty much all the last few runs which ran the test contain the problem. For e.g, you can take a look at https://storage.googleapis.com/kubernetes-jenkins/logs/ci-kubernetes-e2e-gce-scale-performance/36/artifacts/gce-scale-cluster-master/kube-apiserver.log which is a good sample (from run-36)
Another similar hypothesis is that now node problem detector and kubelet are trying to modify the same field, so there's new contention even though it's the same number of patch calls.
I think this was the case even before. For e.g we were seeing this even for the last release - https://github.com/kubernetes/node-problem-detector/issues/124. Did you mean sth else?
.
shyamjvs
on 22 Sep 2017
@jpbetz suggested (on another thread) to turn on pprof for etcd to know more about the operations from etcd side. Does someone know if there's an easy way to add test arguments to etcd (I'm finding KUBE_APISERVER_TEST_ARGS, KUBE_SCHEDULER_TEST_ARGS, etc.. but nothing like ETCD_TEST_ARGS in config-test.sh).
shyamjvs
on 22 Sep 2017
@shyamjvs Just to help you eliminate some possibilities. :)
We didn't update NPD version this release, it means that NPD itself doesn't change from 1.7 to 1.8. As for the start-up script, the only notable change I see is to use preloaded NPD tarball instead of downloading in-flight, which I don't think could cause this problem.
 Random-Liu
on 23 Sep 2017
Random-Liu
on 23 Sep 2017
@shyamjvs I quoted a PUT entry in my last update. I haven't had time to verify it is the cause though.
If NPD didn't change anything, perhaps the kubelet status update now includes a conflicting field? We could consider including a debug line to print out the contents of a slow request.
lavalamp
on 23 Sep 2017
Yup.. Saw that. But those calls from controller-manager are super rare compared to the PATCHs from kubelet and npd. I checked for one of the runs it was something like 4000 PUTs compared to 6 million PATCHs and that too happening just for a couple of minutes twice during the test which should hardly effect the 99th %ile.
shyamjvs
on 23 Sep 2017
Update: I confirmed that commit 11299e3 was healthy with the following top latencies (which all seem normal):
Sep 23 02:00:18.611: INFO: Top latency metric: {Resource:pods Subresource: Verb:LIST Latency:{Perc50:154.43ms Perc90:1.527089s Perc99:3.977228s Perc100:0s} Count:11429}
Sep 23 02:00:18.611: INFO: Top latency metric: {Resource:nodes Subresource: Verb:LIST Latency:{Perc50:330.336ms Perc90:372.868ms Perc99:865.299ms Perc100:0s} Count:1642}
Sep 23 02:00:18.611: INFO: Top latency metric: {Resource:configmaps Subresource: Verb:PATCH Latency:{Perc50:1.541ms Perc90:6.507ms Perc99:180.346ms Perc100:0s} Count:184}
Sep 23 02:00:18.611: INFO: Top latency metric: {Resource:nodes Subresource:status Verb:PATCH Latency:{Perc50:3.344ms Perc90:9.737ms Perc99:78.242ms Perc100:0s} Count:6521257}
Sep 23 02:00:18.611: INFO: Top latency metric: {Resource:configmaps Subresource: Verb:POST Latency:{Perc50:3.861ms Perc90:5.871ms Perc99:28.857ms Perc100:0s} Count:184}
Run-27 (commit 034c40be6f46) was unhealthy. So we now are sure about the range.
shyamjvs
on 23 Sep 2017
51603 (merged Sep 6) - no op (fixes initialization order)
49257 (merged Aug 31) - no op on normal clusters (flag gated)
50738 (merged Aug 29) - no op (I guess - replaces old deepCopy with new deepCopy)
49524 (merged Aug 7) - no op (adds ability to add/remove multiple taints in helper functions)
49870 (merged Aug 1) - no op (variable rename)
47952 (merged Jul 12) - no op (doesn't change any API calls directly, indirectly it can change only Pod deletes)
In short words I don't believe that NC changed it's non-flag gated behavior in this release.
gmarek
on 23 Sep 2017
OTOH we were seeing NC-originated update conflicts when Nodes were dying because of OOMs (the collisions are with NPD/Kubelet).
gmarek
on 23 Sep 2017
Commit 99a9ee5a3c is unhealthy:
Sep 23 18:14:04.314: INFO: WARNING Top latency metric: {Resource:pods Subresource: Verb:LIST Latency:{Perc50:1.1407s Perc90:3.400196s Perc99:5.078185s Perc100:0s} Count:14832}
Sep 23 18:14:04.314: INFO: Top latency metric: {Resource:nodes Subresource: Verb:LIST Latency:{Perc50:408.691ms Perc90:793.079ms Perc99:1.831115s Perc100:0s} Count:1703}
Sep 23 18:14:04.314: INFO: WARNING Top latency metric: {Resource:nodes Subresource:status Verb:PATCH Latency:{Perc50:4.134ms Perc90:103.428ms Perc99:1.139633s Perc100:0s} Count:7396342}
Sep 23 18:14:04.314: INFO: Top latency metric: {Resource:services Subresource: Verb:LIST Latency:{Perc50:1.057ms Perc90:5.84ms Perc99:474.047ms Perc100:0s} Count:511}
Sep 23 18:14:04.314: INFO: Top latency metric: {Resource:replicationcontrollers Subresource: Verb:LIST Latency:{Perc50:869µs Perc90:14.563ms Perc99:436.187ms Perc100:0s} Count:405}
New range - https://github.com/kubernetes/kubernetes/compare/11299e363c538c...99a9ee5a3c52
shyamjvs
on 24 Sep 2017
Commit cbe5f38ed2 is unhealthy:
Sep 24 06:03:04.941: INFO: Top latency metric: {Resource:pods Subresource: Verb:LIST Latency:{Perc50:929.743ms Perc90:3.064274s Perc99:4.745392s Perc100:0s} Count:15353}
Sep 24 06:03:04.941: INFO: Top latency metric: {Resource:nodes Subresource: Verb:LIST Latency:{Perc50:393.741ms Perc90:774.697ms Perc99:2.335875s Perc100:0s} Count:1859}
Sep 24 06:03:04.941: INFO: WARNING Top latency metric: {Resource:nodes Subresource:status Verb:PATCH Latency:{Perc50:3.742ms Perc90:93.829ms Perc99:1.108202s Perc100:0s} Count:8252670}
Sep 24 06:03:04.941: INFO: Top latency metric: {Resource:configmaps Subresource: Verb:POST Latency:{Perc50:3.778ms Perc90:123.878ms Perc99:650.641ms Perc100:0s} Count:210}
Sep 24 06:03:04.941: INFO: Top latency metric: {Resource:endpoints Subresource: Verb:GET Latency:{Perc50:476µs Perc90:37.661ms Perc99:365.414ms Perc100:0s} Count:13008}
New range - https://github.com/kubernetes/kubernetes/compare/11299e363c538c...cbe5f38ed21
shyamjvs
on 24 Sep 2017
Notable things in that range:
- GCI version changed - https://github.com/kubernetes/kubernetes/commit/9fb015987b70ca84eff5694660f1dba701d10e92
- audit format changed to JSON - https://github.com/kubernetes/kubernetes/commit/130f5d10adf13492f3435ab85a50d357a6831f6e
- flex volume plugin probing became dynamic - https://github.com/kubernetes/kubernetes/commit/396c3c7c6fd008663d2d30369c8e33a58cde5ee2
liggitt
on 24 Sep 2017
Commit a235ba4e49 is unhealthy:
Sep 24 17:19:21.433: INFO: WARNING Top latency metric: {Resource:pods Subresource: Verb:LIST Latency:{Perc50:61.762ms Perc90:737.617ms Perc99:7.748733s Perc100:0s} Count:7430}
Sep 24 17:19:21.434: INFO: Top latency metric: {Resource:nodes Subresource: Verb:LIST Latency:{Perc50:401.766ms Perc90:913.101ms Perc99:2.586065s Perc100:0s} Count:1151}
Sep 24 17:19:21.434: INFO: WARNING Top latency metric: {Resource:replicationcontrollers Subresource: Verb:POST Latency:{Perc50:3.072ms Perc90:378.118ms Perc99:1.277634s Perc100:0s} Count:5050}
Sep 24 17:19:21.434: INFO: WARNING Top latency metric: {Resource:nodes Subresource:status Verb:PATCH Latency:{Perc50:3.946ms Perc90:175.392ms Perc99:1.05636s Perc100:0s} Count:5239031}
Sep 24 17:19:21.434: INFO: Top latency metric: {Resource:resourcequotas Subresource: Verb:LIST Latency:{Perc50:924µs Perc90:287.15ms Perc99:960.978ms Perc100:0s} Count:3003}
New range - https://github.com/kubernetes/kubernetes/compare/11299e363c538c...a235ba4e49451c779b8328378addf0d7bd7b84fd
shyamjvs
on 24 Sep 2017
/me places a bet on 130f5d1
dims
on 24 Sep 2017
The audit policy should be skipping logging the response contents for those:
looks like log capture wasn't saving the audit log, so I'm not sure what was actually being logged there... opened https://github.com/kubernetes/kubernetes/pull/52960 to save it
liggitt
on 24 Sep 2017
looked through the audit log captured by kubemark on https://github.com/kubernetes/kubernetes/pull/52960
looks like the only unexpectedly large audit lines getting logged are deletecollection calls for objects, which are logging the entire returned set of deleted objects... I could see a case for logging those, since it's a mutation of those objects and lets you trace the object lifecycle. but those weren't even the calls showing up with latency issues
liggitt
on 25 Sep 2017
Commit c04e516373 is healthy:
Sep 25 03:47:20.967: INFO: Top latency metric: {Resource:pods Subresource: Verb:LIST Latency:{Perc50:178.225ms Perc90:1.455523s Perc99:3.071804s Perc100:0s} Count:11585}
Sep 25 03:47:20.967: INFO: Top latency metric: {Resource:nodes Subresource: Verb:LIST Latency:{Perc50:351.796ms Perc90:393.656ms Perc99:778.841ms Perc100:0s} Count:1754}
Sep 25 03:47:20.967: INFO: Top latency metric: {Resource:nodes Subresource:status Verb:PATCH Latency:{Perc50:3.218ms Perc90:10.25ms Perc99:62.412ms Perc100:0s} Count:6976580}
Sep 25 03:47:20.967: INFO: Top latency metric: {Resource:pods Subresource: Verb:DELETE Latency:{Perc50:896µs Perc90:6.393ms Perc99:26.436ms Perc100:0s} Count:764169}
Sep 25 03:47:20.967: INFO: Top latency metric: {Resource:pods Subresource: Verb:GET Latency:{Perc50:485µs Perc90:992µs Perc99:18.87ms Perc100:0s} Count:1255153}
New range - https://github.com/kubernetes/kubernetes/compare/c04e516373...a235ba4e49451c779b8328378addf0d7bd7b84fd
shyamjvs
on 25 Sep 2017
Guess it's the audit json change - will confirm.
I remember from one of the traces (delete pods iirc) that auditing was part of the code block which took almost all the time. Maybe that also explains why we are seeing the increase for mutating calls.
shyamjvs
on 25 Sep 2017
The audit change wasn’t in the range https://github.com/kubernetes/kubernetes/compare/11299e363c538c...c04e516373 ?
liggitt
on 25 Sep 2017
It's the other half which has the bug.
shyamjvs
on 25 Sep 2017
My original comment had the wrong range, I corrected it immediately - sorry.
shyamjvs
on 25 Sep 2017
Update:
- From the above range, the suspicious PRs are:
- set --audit-log-format default to json #50971
- Update cos image to cos-stable-60-9592-84-0 #51207
- Most likely it's the first one as mutating requests are the ones which've been affected (and they go through audit-logging code path). Also audit-logging doesn't seem to be turned on in kubemark (where we're not seeing this issue) which further reinforces it.
- I'm currently verifying locally that reverting the PR fixes stuff - should know the result in 2-3 hours
shyamjvs
on 25 Sep 2017
@shyamjvs , that COS image upgrade also upgraded docker (from 1.11 to 1.13), which had some performance impacts - @yguo0905 can assess how relevant this is. If that looks suspicious, then you can try running the test against the newer COS image (cos-stable-61-9765-66-0) which has docker 17.03, which had more favorable performance.
 abgworrall
on 25 Sep 2017
abgworrall
on 25 Sep 2017
that COS image upgrade also upgraded docker (from 1.11 to 1.13), which had some performance impacts
docker perf probably wouldn't affect API server latency
liggitt
on 25 Sep 2017
Yes.. Like I mentioned on the slack channel, the issue we're seeing here is on the apiserver side. Besides we're using the new COS image in kubemark (which is running fine).
shyamjvs
on 25 Sep 2017
@shyamjvs You can turn off audit logging for large GCE scale tests until https://github.com/kubernetes/kubernetes/issues/53006 is fixed. This is done by changing the cluster/gce/config-test.sh file: switching ENABLE_APISERVER_ADVANCED_AUDIT to false or completely unsetting it.
 crassirostris
on 25 Sep 2017
crassirostris
on 25 Sep 2017
A couple thoughts on the performance regressions from auditing:
- Audit logging is not enabled by default, it must be explicitly configured (which we do in the testing environment)
- AdavncedAuditing is still in beta
- The specific output format causing the regression is configurable.
With these in mind, I'm inclined to say we should just document this as a known issue and fix it in 1.9 (e.g. https://github.com/kubernetes/kubernetes/issues/53006)
 tallclair
on 25 Sep 2017
tallclair
on 25 Sep 2017
@shyamjvs You can turn off audit logging for large GCE scale tests until #53006 is fixed
(As discussed on slack with @liggitt) Not sure if that's the best approach. The purpose of scale-testing is to validate the release and turning it off means we're not really validating it. We're trying to keep the config with which we're scale-testing as close as possible to the release defaults.
That said, I can live with the idea. However, it would be preferable then to also have it disabled by default in the config-*.sh files.
shyamjvs
on 25 Sep 2017
We're trying to keep the config with which we're scale-testing as close as possible to the release defaults.
it defaults off in the non-test config-default.sh file
you can set the env in the test job env as well. we already do this for the performance tests to make them match production, or to tune them the way we'd tune large clusters.
I opened https://github.com/kubernetes/kubernetes/pull/52998 (1.8 pick in https://github.com/kubernetes/kubernetes/pull/53012) to reduce the amount of data sent to the audit log.
I also opened https://github.com/kubernetes/test-infra/pull/4720 to make the performance tests match production (by disabling auditing completely) and we can revisit this in 1.9
liggitt
on 25 Sep 2017
Update:
- Prod configs don't have audit logging enabled by default for 1.8, so we're going to skip scale-testing it for the release
- We're not cherrypicking @liggitt 's audit policy change to 1.8 as we're not scale-testing it anyway
- The scalability issue would be solved in 1.9 which is when we'll enable it for our testing (@tallclair / @crassirostris - Could one of you file an issue or add a TODO to enable it later?)
shyamjvs
on 25 Sep 2017
Filed an issue: https://github.com/kubernetes/kubernetes/issues/53020
crassirostris
on 25 Sep 2017
Kicked the 5k-performance job on CI with audit disabled. Expecting to have a green run (hopefully) by tomorrow.
shyamjvs
on 25 Sep 2017
for those following along at home, the test runs are at https://k8s-gubernator.appspot.com/builds/kubernetes-jenkins/logs/ci-kubernetes-e2e-gce-scale-performance/
liggitt
on 26 Sep 2017
Ok.. so the patch node status issue has been resolved with turning off audit-logging and the situation looks much better. However the delete pods showed trouble in the latest run:
I0926 14:31:48.470] Sep 26 14:31:48.469: INFO: WARNING Top latency metric: {Resource:pods Subresource: Verb:DELETE Scope:namespace Latency:{Perc50:4.633ms Perc90:791.553ms Perc99:3.54603s Perc100:0s} Count:310018}
I0926 14:31:48.470] Sep 26 14:31:48.469: INFO: Top latency metric: {Resource:pods Subresource: Verb:LIST Scope:namespace Latency:{Perc50:57.306ms Perc90:72.234ms Perc99:1.255s Perc100:0s} Count:10819}
I0926 14:31:48.470] Sep 26 14:31:48.469: INFO: Top latency metric: {Resource:nodes Subresource: Verb:LIST Scope:cluster Latency:{Perc50:409.094ms Perc90:544.723ms Perc99:1.016102s Perc100:0s} Count:2955}
I0926 14:31:48.471] Sep 26 14:31:48.469: INFO: Top latency metric: {Resource:pods Subresource: Verb:LIST Scope:cluster Latency:{Perc50:211.299ms Perc90:385.941ms Perc99:726.57ms Perc100:0s} Count:1216}
I0926 14:31:48.471] Sep 26 14:31:48.469: INFO: Top latency metric: {Resource:pods Subresource:binding Verb:POST Scope:namespace Latency:{Perc50:1.151ms Perc90:6.838ms Perc99:404.557ms Perc100:0s} Count:155009}
The logs are now being uploaded to GCS.. need to wait for a few minutes.
shyamjvs
on 26 Sep 2017
what was delete pods at in the last healthy run (no. 23)?
liggitt
on 26 Sep 2017
For run-23 it was 47.057ms from the api-responsiveness logs. For run-27 it was 558ms (taken from build-log as the api-responsiveness logs was missing):
INFO: Top latency metric: {Resource:pods Subresource: Verb:DELETE Latency:{Perc50:5.11ms Perc90:33.011ms Perc99:558.028ms Perc100:0s} Count:314894}
We knew commit c04e516 was healthy from https://github.com/kubernetes/kubernetes/issues/51899#issuecomment-331759561. So it must be in https://github.com/kubernetes/kubernetes/compare/c04e516373...a235ba4e49451c779b8328378addf0d7bd7b84fd (maybe the cos image change?).
Also does ENABLE_ADVANCED_AUDIT_LOGGING=false still do some basic audit-logging?
shyamjvs
on 26 Sep 2017
So it must be in c04e516...a235ba4 (maybe the cos image change?).
The API call to delete a pod doesn't block on docker. I could see it taking longer for the node to shut down a pod, but not increase latency on the actual API calls.
Also does ENABLE_ADVANCED_AUDIT_LOGGING=false still do some basic audit-logging?
No. That's controlled by ENABLE_APISERVER_BASIC_AUDIT, which defaults false.
liggitt
on 26 Sep 2017
Makes sense. Unfortunately we missed the master logs due to some test-infra issue (cc @kubernetes/test-infra-maintainers @krzyzacy), which are supposed to be copied from the jenkins worker to GCS. I don't see the following calls for the build-log (which usually happen):
I0922 10:02:12.439] Call:  gsutil ls gs://kubernetes-jenkins/logs/ci-kubernetes-e2e-gce-scale-performance/39/artifacts
I0922 10:02:14.951] process 31483 exited with code 0 after 0.0m
I0922 10:02:14.953] Call:  gsutil -m -q -o GSUtil:use_magicfile=True cp -r -c -z log,txt,xml artifacts gs://kubernetes-jenkins/logs/ci-kubernetes-e2e-gce-scale-performance/39
I0922 10:05:21.167] process 31618 exited with code 0 after 3.1m
@liggitt One reason why I suspect this happened is because you enabled audit logs to also be copied (which are quite huge).
shyamjvs
on 26 Sep 2017
@liggitt One reason why I suspect this happened is because you enabled audit logs to also be copied (which are quite huge).
auditing is disabled in this env :)
liggitt
on 26 Sep 2017
Oh yeah.. there's absolutely no audit logs at all - sorry.
shyamjvs
on 26 Sep 2017
I'll change the CI job to run just the density test and rekick it. We should have sth in 3-4 hrs.
shyamjvs
on 26 Sep 2017
Seems like the current run is also going to likely fail, as I see the following latency for delete pod calls (in μs):
apiserver_request_latencies_summary{resource="pods",scope="namespace",subresource="",verb="DELETE",quantile="0.99"} 4.462881e+06
From the traces, the only step printed (taking almost all the time) is:
I0926 21:32:57.199705       7 trace.go:76] Trace[1024874778]: "Delete /api/v1/namespaces/e2e-tests-density-30-21-8gvt2/pods/density150000-20-3b9db35a-a2dd-11e7-b671-0242ac110004-bzsjl" (started: 2017-09-26 21:32:56.246437691 +0000 UTC) (total time: 953.24642ms):
Trace[1024874778]: [949.787883ms] [949.73031ms] About to delete object from database
And that trace seems to correspond to this part of code:
https://github.com/kubernetes/kubernetes/blob/a3ab97b7f395e1abd2d954cd9ada0386629d0411/staging/src/k8s.io/apiserver/pkg/endpoints/handlers/rest.go#L944-L1009
shyamjvs
on 27 Sep 2017
I've added some extra traces in https://github.com/kubernetes/kubernetes/pull/52543 - but I guess I should've added them for after the step instead of before the step (as we're not getting enough info from the current trace of which sub-part above it took maximum time).
shyamjvs
on 27 Sep 2017
Starting a second round of bisection (with audit-logging disabled) to catch the second regression. Hopefully this one's faster.
shyamjvs
on 27 Sep 2017
Commit 150a560eed is unhealthy (I'm testing against 2k-node cluster):
Sep 27 14:34:14.484: INFO: WARNING Top latency metric: {Resource:pods Subresource: Verb:DELETE Latency:{Perc50:4.551ms Perc90:10.216ms Perc99:1.403002s Perc100:0s} Count:122966}
From my previous bisection commit c04e516 was the latest healthy one we know of.
shyamjvs
on 27 Sep 2017
Snippet of one of the delete spikes from https://k8s-gubernator.appspot.com/build/kubernetes-jenkins/logs/ci-kubernetes-e2e-gce-scale-performance/41/ (y is milliseconds, x is time of API call)
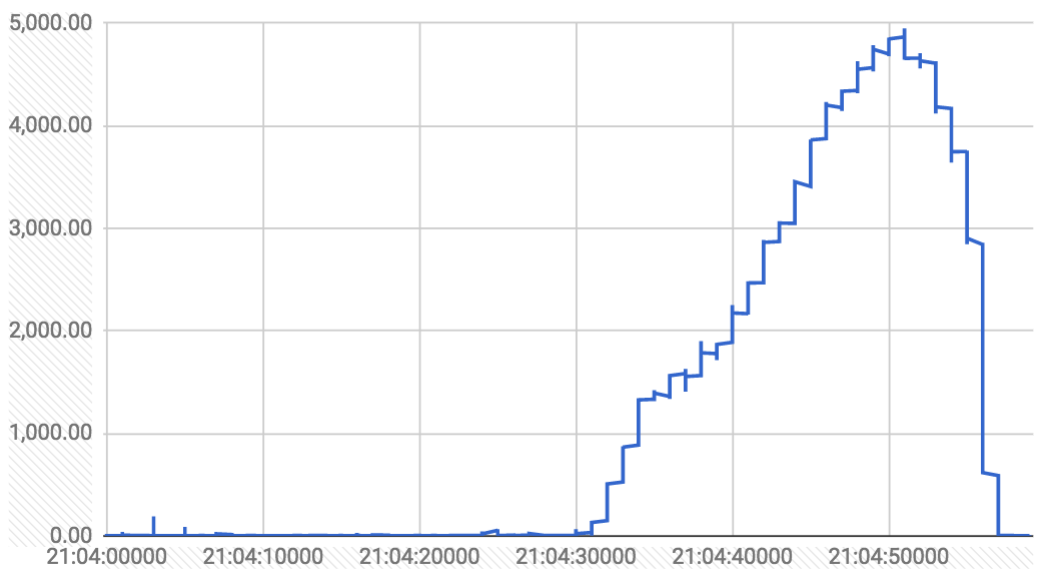
I'm checking for changes to delete handling/storage/admission/garbage collection in the unhealthy range. Nothing is jumping out so far.
What's interesting is the distribution of delete pod API calls during that minute:
- First 30 seconds:
- 63k total API calls
- 2146
delete podAPI calls - 1166 by
kube-controller-manager/v1.8.0 (linux/amd64) kubernetes/a3ab97b/system:serviceaccount:kube-system:generic-garbage-collector - 980 by
kubelet/v1.8.0 (linux/amd64) kubernetes/a3ab97b
- Second 30 seconds:
- 55k total API calls
- 1371
delete podAPI calls - 1371 by
kubelet/v1.8.0 (linux/amd64) kubernetes/a3ab97b
the garbage collector calls trigger graceful deletion, the kubelet calls actually delete the pods. the first 30 seconds, there is negligable latency on delete calls (1-100ms), the second 30 seconds, the latency grows steadily.
The overall number of delete calls is higher in the first 30 seconds, and the number that actually resulted in etcd deletions was comparable to the second 30 seconds (980 vs 1371).
liggitt
on 27 Sep 2017
completed the sweep, no obvious issues related to pods, deletion, admission, etcd, or storage in the range aa50c0f...150a560
does kubemark 5k have a similar "create a lot of pods"/"delete a lot of scheduled pods in parallel" pattern for pods? wondering why we're not seeing latency issues there
liggitt
on 27 Sep 2017
FYI all, we already have a verbal approval from Google via @abgworrall to have this as a known issue in 1.8.0 with caveats provided. I need some help adding this to #53004 so it's described properly for inclusion in the release notes. In 2 hours I am going to lift the release-blocking label unless more information comes to light and we need to keep it blocking.
jdumars
on 27 Sep 2017
@liggitt Yes, kubemark also runs the same test, creating a similar pattern. For those curious- in short we're doing the following in the density test:
- Saturating the cluster with 30 pods/node i.e. we're creating some RCs adding up to a total of
30 * #nodespods - We're then creating an additional
#nodespods (on the saturated cluster) to measure their startup latencies - We then delete those additional pods and the saturation pods and capture the api call latency metrics
wondering why we're not seeing latency issues there
Could be sth around mismatching master configs (https://github.com/kubernetes/kubernetes/issues/53021) or different qps composition (sth creating extra qps on real clusters) or ..? Need to dig deeper into it (https://github.com/kubernetes/kubernetes/issues/47544 and https://github.com/kubernetes/kubernetes/issues/47540 are relevant).
@jdumars Verified that commit aa50c0f54c3 is healthy:
Sep 27 16:34:11.638: INFO: Top latency metric: {Resource:pods Subresource: Verb:DELETE Latency:{Perc50:3.669ms Perc90:6.723ms Perc99:19.735ms Perc100:0s} Count:124000}
This clearly is a regression and I'm not sure if we should remove release-blocking. Though I can live with documenting it and fixing in a patch release.
@thockin @smarterclayton Comments?
shyamjvs
on 27 Sep 2017
@abgworrall discussed this internally at Google, and based on the limited circumstances of impact, it can be addressed in 1.8.x.
jdumars
on 27 Sep 2017
@jdumars can we move this out of the milestone then.
 grodrigues3
on 27 Sep 2017
grodrigues3
on 27 Sep 2017
Sounds good. As agreed on slack - once know the fix, we'll backport it to 1.8.
shyamjvs
on 27 Sep 2017
Continuing with the bisect ftw... commit 6b9ce5ba110 is healthy:
Sep 27 20:11:35.950: INFO: Top latency metric: {Resource:pods Subresource: Verb:DELETE Latency:{Perc50:4.404ms Perc90:6.688ms Perc99:20.853ms Perc100:0s} Count:131492}
Commit 57c3c2c0b is healthy:
Sep 27 22:09:19.792: INFO: Top latency metric: {Resource:pods Subresource: Verb:DELETE Latency:{Perc50:3.792ms Perc90:6.777ms Perc99:19.745ms Perc100:0s} Count:124000}
New range: https://github.com/kubernetes/kubernetes/compare/57c3c2c0bc3b24905ecab52b7b8a50d4b0e6bae2...150a560eed43a1e1dac47ee9b73af89226827565
I'm suspecting the following PR (yet to take a closer look):
- Wait for container cleanup before deletion #50350
shyamjvs
on 27 Sep 2017
To be clear: my verbal OK was based on: a perf regression that only manifested when audit logging was enabled, and configured a certain way.
It isn't clear to me what the scope of the delete-pods regression, which has now become visible, is; does it affect all large clusters by default ? And what is the impact - an average 25% increase, or a 2500% increase at 99%ile, or what ?
(Apologies if this is made clear earlier in this thread; but I'd really appreciate a summary)
abgworrall
on 27 Sep 2017
- kubemark does not encounter this issue, even though it runs similar create/delete patterns
- the impact is best seen in https://github.com/kubernetes/kubernetes/issues/51899#issuecomment-332515008
liggitt
on 27 Sep 2017
@abgworrall There are 2 issues:
- Increased latencies for
patch node-statuscalls (and a few other calls flakily) which was caused by the audit log change to json. We went about it by disabling audit-logging in our scale-testing (see - https://github.com/kubernetes/kubernetes/issues/51899#issuecomment-331973754) and it's resolved now - Increased latencies for
delete podscalls (20ms -> 1.4s) and I'm currently bisecting it using 2k-node cluster. I narrowed down the commit range to as much as https://github.com/kubernetes/kubernetes/compare/57c3c2c0bc3b24905ecab52b7b8a50d4b0e6bae2...150a560eed43a1e1dac47ee9b73af89226827565. Need to confirm if the issue is flaky.
shyamjvs
on 27 Sep 2017
Ok.. It doesn't seem like a flake. Failed for the second time against 150a560:
Sep 28 01:54:50.933: INFO: WARNING Top latency metric: {Resource:pods Subresource: Verb:DELETE Latency:{Perc50:5.031ms Perc90:2.082021s Perc99:6.116367s Perc100:0s} Count:124000}
@dashpole @liggitt @smarterclayton could it be https://github.com/kubernetes/kubernetes/pull/50350? (based on the last range posted by shyam)
dims
on 28 Sep 2017
Fyi - I ran two more rounds of bisection after that and found:
Commit 78c82080 is unhealthy:
Sep 28 06:25:03.471: INFO: WARNING Top latency metric: {Resource:pods Subresource: Verb:DELETE Latency:{Perc50:3.995ms Perc90:209.142ms Perc99:3.174665s Perc100:0s} Count:124000}
and commit 6a314ce3a9cb is healthy:
Sep 28 13:51:29.705: INFO: Top latency metric: {Resource:pods Subresource: Verb:DELETE Latency:{Perc50:3.647ms Perc90:6.901ms Perc99:19.541ms Perc100:0s} Count:124000}
The new range is: https://github.com/kubernetes/kubernetes/compare/6a314ce3a9cb...78c82080
shyamjvs
on 28 Sep 2017
/me increases his stakes on https://github.com/kubernetes/kubernetes/pull/50350/commits/9ac30e2c280f61a9629f3334f7e6e6424b7fb5f8
dims
on 28 Sep 2017
/me increases his stakes on 9ac30e2
the commit title certainly seems related, but I've been over that commit a dozen times and don't see anything that crosses a boundary outside the kubelet that would affect API server latency. We'll see, I suppose.
liggitt
on 28 Sep 2017
Actually one hypothesis I have is because that change (iiuc) makes kubelet send delete pod request only after container has been deleted, maybe the rate/distribution of those calls has changed. While in kubemark, the kubelets are not running any real containers, so they can just immediately delete the pod object (which might be leading to a uniform distribution of those calls). Wdyt?
shyamjvs
on 28 Sep 2017
@kubernetes/sig-node-bugs Does kubelet container GC happen periodically? As in that case, all the containers that are deleted in one batch might lead to a bulk of delete pods request at once. Or maybe sth else I'm missing?
shyamjvs
on 28 Sep 2017
see the analysis of the delete call distribution in https://github.com/kubernetes/kubernetes/issues/51899#issuecomment-332515008
the first half of the graph and the second have almost identical numbers of delete calls, yet the first half remains perfectly responsive and the second accumulates dramatic latency. I don't think it's as simple as a thundering herd.
liggitt
on 28 Sep 2017
Just finished checking.. commit bcf22bcf6 is also healthy:
Sep 28 16:09:14.084: INFO: Top latency metric: {Resource:pods Subresource: Verb:DELETE Latency:{Perc50:4.114ms Perc90:6.221ms Perc99:17.737ms Perc100:0s} Count:124000}
And in the 3 commits left (https://github.com/kubernetes/kubernetes/compare/bcf22bcf6...78c82080), this one is most likely the cause. There's another one touching pod deletion (#51186), but that's some change on the kubectl side and kubectl shouldn't be used in our test nor in any major control-plane component iiuc.
shyamjvs
on 28 Sep 2017
@liggitt Could you obtain the graph for an x-range a bit longer than 60s (the deletion phase for the test lasts longer than 30 mins)? Was it just a single spike or there are multiple of them? And are they periodic? Maybe those spikes occur when multiple nodes have their gc phase coinciding?
shyamjvs
on 28 Sep 2017
cc @dashpole @dchen1107
shyamjvs
on 28 Sep 2017
here are graphs over a three minute window (both latency in ms and distribution of delete calls per second)
the delete calls from GC merely set deletionTimestamp on the pod (which the kubelets observe and start shutting down the pods). the delete calls from the kubelet actually delete from etcd.
Was it just a single spike or there are multiple of them? And are they periodic? Maybe those spikes occur when multiple nodes have their gc phase coinciding?
there were multiple spikes throughout the run. here's a graph of delete calls that took more than one second throughout the whole run:
the spikes appear to come in sets of three, at ~2 minute intervals, lasting 20-30 seconds
liggitt
on 28 Sep 2017
Beautiful! Thanks a ton for the graphs.
So it indeed seems quite periodic.. Btw - I think the 2 minutes pattern is related to how we're deleting the saturation pods (that I explained in https://github.com/kubernetes/kubernetes/issues/51899#issuecomment-332577238) towards the end of the density test. We're deleting those RCs (each has 3000 replicas) at approx 2 mins interval:
I0928 03:52:02.643] [1mSTEP[0m: Cleaning up only the { ReplicationController}, garbage collector will clean up the pods
I0928 03:52:02.643] [1mSTEP[0m: deleting { ReplicationController} density150000-47-dc6c4af2-a3d1-11e7-9201-0242ac110008 in namespace e2e-tests-density-30-48-pbmpd, will wait for the garbage collector to delete the pods
I0928 03:52:03.048] Sep 28 03:52:03.047: INFO: Deleting { ReplicationController} density150000-47-dc6c4af2-a3d1-11e7-9201-0242ac110008 took: 39.093401ms
I0928 03:53:03.050] Sep 28 03:53:03.049: INFO: Terminating { ReplicationController} density150000-47-dc6c4af2-a3d1-11e7-9201-0242ac110008 pods took: 1m0.001823124s
I0928 03:54:13.051] [1mSTEP[0m: Cleaning up only the { ReplicationController}, garbage collector will clean up the pods
I0928 03:54:13.051] [1mSTEP[0m: deleting { ReplicationController} density150000-48-dc6c4af2-a3d1-11e7-9201-0242ac110008 in namespace e2e-tests-density-30-49-g5qvv, will wait for the garbage collector to delete the pods
I0928 03:54:13.438] Sep 28 03:54:13.437: INFO: Deleting { ReplicationController} density150000-48-dc6c4af2-a3d1-11e7-9201-0242ac110008 took: 40.001908ms
I0928 03:55:13.440] Sep 28 03:55:13.439: INFO: Terminating { ReplicationController} density150000-48-dc6c4af2-a3d1-11e7-9201-0242ac110008 pods took: 1m0.001894987s
I0928 03:56:23.440] [1mSTEP[0m: Cleaning up only the { ReplicationController}, garbage collector will clean up the pods
I0928 03:56:23.441] [1mSTEP[0m: deleting { ReplicationController} density150000-49-dc6c4af2-a3d1-11e7-9201-0242ac110008 in namespace e2e-tests-density-30-50-s62ds, will wait for the garbage collector to delete the pods
I0928 03:56:23.829] Sep 28 03:56:23.829: INFO: Deleting { ReplicationController} density150000-49-dc6c4af2-a3d1-11e7-9201-0242ac110008 took: 50.423057ms
I0928 03:57:23.831] Sep 28 03:57:23.830: INFO: Terminating { ReplicationController} density150000-49-dc6c4af2-a3d1-11e7-9201-0242ac110008 pods took: 1m0.0014941s
The no. of those calls from your earlier comment was also close to 3000 - though that was within 1 minute range (but we have two delete calls per pod iiuc - one from gc and one from kubelet).
shyamjvs
on 28 Sep 2017
fyi - I confirmed that it is this PR that's causing the issue. The commit just before it is healthy:
Sep 28 18:05:27.337: INFO: Top latency metric: {Resource:pods Subresource: Verb:DELETE Latency:{Perc50:4.106ms Perc90:6.308ms Perc99:19.561ms Perc100:0s} Count:124000}
Options we have:
- revert the commit and then fix the issue in 1.9 (I prefer this, unless the fix is trivial enough to go into 1.8)
- fix it - potentially pushing the release further behind (if we also want to have enough confidence on release quality)
- let it be and document this as a known issue in the release (I'm not much in favor of this)
shyamjvs
on 28 Sep 2017
I can see how waiting for container gc on the kubelet side before issuing the delete API call would batch the delete calls. Seems like a kubelet-induced thundering herd, when deleting massive numbers of pods across massive numbers of nodes. kubemark's gc is stubbed since there are no real containers, so this isn't observed there
liggitt
on 28 Sep 2017
Yup.. what I was thinking too - https://github.com/kubernetes/kubernetes/issues/51899#issuecomment-332847171
shyamjvs
on 28 Sep 2017
cc @dashpole @vishh @dchen1107
from introducing PR (https://github.com/kubernetes/kubernetes/pull/50350)
liggitt
on 28 Sep 2017
I can post a PR to revert the key portion of #50350.
 dashpole
on 28 Sep 2017
dashpole
on 28 Sep 2017
@dashpole thank you!
jdumars
on 28 Sep 2017
I guess we should also wait until the fix is tested too (add ~2 more hours for it).
shyamjvs
on 28 Sep 2017
PR posted: #53210
dashpole
on 28 Sep 2017
@dashpole and I had an offline discussion, and plan to revert portion of #50350. The original pr was introduced because without that change, Kubelet disk eviction manager might delete more containers unnecessarily.
We should improve disk management with more intelligence to take proactive action, instead of relying on the periodical gc.
 dchen1107
on 28 Sep 2017
dchen1107
on 28 Sep 2017
While this is in the 1.9 milestone, there is every expectation that this will be resolved at the earliest responsible moment in a 1.8 patch release. The full decision-making process around this can be viewed at https://youtu.be/r6D5DNel2l8
jdumars
on 28 Sep 2017
Any updates on this?
 jpbetz
on 2 Oct 2017
jpbetz
on 2 Oct 2017
We already have a victim PR - the PR that is fixing that is #53233
wojtek-t
on 2 Oct 2017
53233 is merged to master. pick for 1.8.1 open at https://github.com/kubernetes/kubernetes/pull/53422
liggitt
on 4 Oct 2017
[MILESTONENOTIFIER] Milestone Issue Needs Approval
@dashpole @shyamjvs @kubernetes/sig-api-machinery-bugs @kubernetes/sig-node-bugs @kubernetes/sig-scalability-bugs
Action required: This issue must have the status/approved-for-milestone label applied by a SIG maintainer.
Issue Labels
sig/api-machinerysig/nodesig/scalability: Issue will be escalated to these SIGs if needed.priority/critical-urgent: Never automatically move out of a release milestone; continually escalate to contributor and SIG through all available channels.kind/bug: Fixes a bug discovered during the current release.
Help
 k8s-github-robot
on 6 Oct 2017
k8s-github-robot
on 6 Oct 2017
/close
Closed via #53422. The fix be in 1.8.1.
dashpole
on 6 Oct 2017
Related issues
 igorleao
·
181Comments
igorleao
·
181Comments
 deitch
·
225Comments
deitch
·
225Comments
 gjcarneiro
·
142Comments
gjcarneiro
·
142Comments
 verult
·
116Comments
verult
·
116Comments
 mrrandrade
·
123Comments
mrrandrade
·
123Comments
Most helpful comment
Kicked the 5k-performance job on CI with audit disabled. Expecting to have a green run (hopefully) by tomorrow.