Kubernetes: Node flapping between Ready/NotReady with PLEG issues
Is this a request for help? No
What keywords did you search in Kubernetes issues before filing this one? (If you have found any duplicates, you should instead reply there.): PLEG NotReady kubelet
Is this a BUG REPORT or FEATURE REQUEST? Bug
Kubernetes version (use kubectl version): 1.6.2
Environment:
- Cloud provider or hardware configuration: CoreOS on AWS
- OS (e.g. from /etc/os-release):CoreOS 1353.7.0
- Kernel (e.g.
uname -a): 4.9.24-coreos - Install tools:
- Others:
What happened:
I have a 3-worker cluster. Two and sometimes all three nodes keep dropping into NotReadywith the following messages in journalctl -u kubelet:
May 05 13:59:56 ip-10-50-20-208.ec2.internal kubelet[2858]: I0505 13:59:56.872880    2858 kubelet_node_status.go:379] Recording NodeNotReady event message for node ip-10-50-20-208.ec2.internal
May 05 13:59:56 ip-10-50-20-208.ec2.internal kubelet[2858]: I0505 13:59:56.872908    2858 kubelet_node_status.go:682] Node became not ready: {Type:Ready Status:False LastHeartbeatTime:2017-05-05 13:59:56.872865742 +0000 UTC LastTransitionTime:2017-05-05 13:59:56.872865742 +0000 UTC Reason:KubeletNotReady Message:PLEG is not healthy: pleg was last seen active 3m7.629592089s ago; threshold is 3m0s}
May 05 14:07:57 ip-10-50-20-208.ec2.internal kubelet[2858]: I0505 14:07:57.598132    2858 kubelet_node_status.go:379] Recording NodeNotReady event message for node ip-10-50-20-208.ec2.internal
May 05 14:07:57 ip-10-50-20-208.ec2.internal kubelet[2858]: I0505 14:07:57.598162    2858 kubelet_node_status.go:682] Node became not ready: {Type:Ready Status:False LastHeartbeatTime:2017-05-05 14:07:57.598117026 +0000 UTC LastTransitionTime:2017-05-05 14:07:57.598117026 +0000 UTC Reason:KubeletNotReady Message:PLEG is not healthy: pleg was last seen active 3m7.346983738s ago; threshold is 3m0s}
May 05 14:17:58 ip-10-50-20-208.ec2.internal kubelet[2858]: I0505 14:17:58.536101    2858 kubelet_node_status.go:379] Recording NodeNotReady event message for node ip-10-50-20-208.ec2.internal
May 05 14:17:58 ip-10-50-20-208.ec2.internal kubelet[2858]: I0505 14:17:58.536134    2858 kubelet_node_status.go:682] Node became not ready: {Type:Ready Status:False LastHeartbeatTime:2017-05-05 14:17:58.536086605 +0000 UTC LastTransitionTime:2017-05-05 14:17:58.536086605 +0000 UTC Reason:KubeletNotReady Message:PLEG is not healthy: pleg was last seen active 3m7.275467289s ago; threshold is 3m0s}
May 05 14:29:59 ip-10-50-20-208.ec2.internal kubelet[2858]: I0505 14:29:59.648922    2858 kubelet_node_status.go:379] Recording NodeNotReady event message for node ip-10-50-20-208.ec2.internal
May 05 14:29:59 ip-10-50-20-208.ec2.internal kubelet[2858]: I0505 14:29:59.648952    2858 kubelet_node_status.go:682] Node became not ready: {Type:Ready Status:False LastHeartbeatTime:2017-05-05 14:29:59.648910669 +0000 UTC LastTransitionTime:2017-05-05 14:29:59.648910669 +0000 UTC Reason:KubeletNotReady Message:PLEG is not healthy: pleg was last seen active 3m7.377520804s ago; threshold is 3m0s}
May 05 14:44:00 ip-10-50-20-208.ec2.internal kubelet[2858]: I0505 14:44:00.938266    2858 kubelet_node_status.go:379] Recording NodeNotReady event message for node ip-10-50-20-208.ec2.internal
May 05 14:44:00 ip-10-50-20-208.ec2.internal kubelet[2858]: I0505 14:44:00.938297    2858 kubelet_node_status.go:682] Node became not ready: {Type:Ready Status:False LastHeartbeatTime:2017-05-05 14:44:00.938251338 +0000 UTC LastTransitionTime:2017-05-05 14:44:00.938251338 +0000 UTC Reason:KubeletNotReady Message:PLEG is not healthy: pleg was last seen active 3m7.654775919s ago; threshold is 3m0s}
docker daemon is fine (local docker ps, docker images, etc. all work and respond immediately).
using weave networking installed via kubectl apply -f https://git.io/weave-kube-1.6
What you expected to happen:
Nodes to be ready.
How to reproduce it (as minimally and precisely as possible):
Wish I knew how!
Anything else we need to know:
All of the nodes (workers and masters) on same private subnet with NAT gateway to Internet. Workers in security group that allows unlimited access (all ports) from masters security group; masters allow all ports from same subnet. proxy is running on workers; apiserver, controller-manager, scheduler on masters.
kubectl logs and kubectl exec always hang, even when run from the master itself (or from outside).
 deitch
All 225 comments
@deitch, how many containers were running on the node? What's the overall cpu utilization of your nodes?
 yujuhong
on 5 May 2017
yujuhong
on 5 May 2017
Basically none. kube-dns, weave-net, weave-npc, and 3 template sample services. Actually only one, because two had no image and were going to be cleaned up. AWS m4.2xlarge. Not a resource issue.
I ended up having to destroy the nodes and recreate. No PLEG messages since destroy/recreate, and they seem 50% ok. They stay Ready, although they still refuse to allow kubectl exec or kubectl logs.
I really struggled to find any documentation on what PLEG really is, but more importantly how to check its own logs and state and debug it.
deitch
on 5 May 2017
Hmm... to add to the mystery, no container can resolve any hostnames, and kubedns gives:
E0505 17:30:49.412272       1 reflector.go:199] pkg/dns/config/sync.go:114: Failed to list *api.ConfigMap: Get https://10.200.0.1:443/api/v1/namespaces/kube-system/configmaps?fieldSelector=metadata.name%3Dkube-dns&resourceVersion=0: dial tcp 10.200.0.1:443: getsockopt: no route to host
E0505 17:30:49.412285       1 reflector.go:199] pkg/dns/dns.go:148: Failed to list *api.Service: Get https://10.200.0.1:443/api/v1/services?resourceVersion=0: dial tcp 10.200.0.1:443: getsockopt: no route to host
E0505 17:30:49.412272       1 reflector.go:199] pkg/dns/dns.go:145: Failed to list *api.Endpoints: Get https://10.200.0.1:443/api/v1/endpoints?resourceVersion=0: dial tcp 10.200.0.1:443: getsockopt: no route to host
I0505 17:30:51.855370       1 logs.go:41] skydns: failure to forward request "read udp 10.100.0.3:60364->10.50.0.2:53: i/o timeout"
FWIW, 10.200.0.1 is the kube api service internally, 10.200.0.5 is DNS, 10.50.20.0/24 and 10.50.21.0/24 are the subnets (2 separate AZs) on which masters and workers run.
Something just really fubar in the networking?
deitch
on 5 May 2017
Something just really fubar in the networking?
@bboreham could this be related to weave and not kube (or at least misconfigured weave)? Standard weave with the IPALLOC_RANGE=10.100.0.0/16 added as discussed at https://github.com/weaveworks/weave/issues/2736
deitch
on 5 May 2017
@deitch pleg is for kubelet to periodically list pods in the node to check healthy and update cache. If you see pleg timeout log, it may not be related to dns, but because kubelet's call to docker is timeout.
 qiujian16
on 11 May 2017
qiujian16
on 11 May 2017
Thanks @qiujian16 . The issue appears to have gone away, but I have no idea how to check it. Docker itself appeared healthy. I was wondering if it could be networking plugin, but that should not affect the kubelet itself.
Can you give me some pointers here on checking pleg healthiness and status? Then we can close this out until I see the issue recur.
deitch
on 11 May 2017
@deitch pleg is the short for "pod lifecycle event generator", it is an internal component of kubelet and i do not think you can directly check its status, see (https://github.com/kubernetes/community/blob/master/contributors/design-proposals/pod-lifecycle-event-generator.md)
qiujian16
on 11 May 2017
Is it an internal module in the kubelet binary? Is it another standalone container (docker, runc, cotnainerd)? It is just a standalone binary?
Basically, if kubelet reports PLEG errors, it is very helpful to find out what those errors are, and then check its status, try and replicate.
deitch
on 11 May 2017
it is an internal module
qiujian16
on 11 May 2017
@deitch most likely docker was not as responsive at times, causing PLEG to miss its threshold.
yujuhong
on 11 May 2017
I am having a similar issue on all nodes but one a cluster I just created,
logs:
kube-worker03.foo.bar.com kubelet[3213]: E0511 19:00:59.139374    3213 remote_runtime.go:109] StopPodSandbox "12c6a5c6833a190f531797ee26abe06297678820385b402371e196c69b67a136" from runtime service failed: rpc error: code = 4 desc = context deadline exceeded
May 11 19:00:59 kube-worker03.foo.bar.com kubelet[3213]: E0511 19:00:59.139401    3213 kuberuntime_gc.go:138] Failed to stop sandbox "12c6a5c6833a190f531797ee26abe06297678820385b402371e196c69b67a136" before removing: rpc error: code = 4 desc = context deadline exceeded
May 11 19:01:04 kube-worker03.foo.bar.com kubelet[3213]: E0511 19:01:04.627954    3213 pod_workers.go:182] Error syncing pod 1c43d9b6-3672-11e7-a6da-00163e041106
("kube-dns-4240821577-1wswn_kube-system(1c43d9b6-3672-11e7-a6da-00163e041106)"), skipping: rpc error: code = 4 desc = context deadline exceeded
May 11 19:01:18 kube-worker03.foo.bar.com kubelet[3213]: E0511 19:01:18.627819    3213 pod_workers.go:182] Error syncing pod 1c43d9b6-3672-11e7-a6da-00163e041106
("kube-dns-4240821577-1wswn_kube-system(1c43d9b6-3672-11e7-a6da-00163e041106)"),
skipping: rpc error: code = 4 desc = context deadline exceeded
May 11 19:01:21 kube-worker03.foo.bar.com kubelet[3213]: I0511 19:01:21.627670    3213 kubelet.go:1752] skipping pod synchronization - [PLEG is not healthy: pleg was last seen active 3m0.339074625s ago; threshold is 3m0s]
I have downgraded docker and also restarted virtually everything to no avail, the nodes are all managed via puppet, so I expect them to be completely identical, I have no clue what is wrong. Docker logs in debug mode shows it's getting these requests
 bjhaid
on 11 May 2017
bjhaid
on 11 May 2017
@bjhaid what are you using for networking? I was seeing some interesting networking issues at the time.
deitch
on 11 May 2017
@deitch weave, but I don't think this is a networking related problem, since it seems to be a communication problem between kubelet and docker. I can confirm docker is getting these requests from kubelet via debug logging of docker
bjhaid
on 11 May 2017
My Pleg issues appear to be gone, although I won't feel confident until next time I set up these clusters afresh (all via terraform modules I built).
Weave issues appear to exist, or possibly k8s/docker.
deitch
on 11 May 2017
@deitch did you do anything to make the Pleg issues go away or they magic happened?
bjhaid
on 11 May 2017
Actually it's hostname resolution, the controllers could not resolve the hostname for the newly created nodes, sorry for the noise
bjhaid
on 11 May 2017
I was quick to report things being fine, problem still exists, I'll keep looking and report back if I find anything
bjhaid
on 11 May 2017
I guess this issue is related to weave-kube I had the same issue and this time in order to solve it without recreating the cluster I had to remove weave and re-apply it (with a reboot of node in order to propagate the remove order)... And it's back
So I have no clue why or how by I'm pretty sure it's due to weave-kube-1.6
 gbergere
on 19 May 2017
gbergere
on 19 May 2017
Forgot to return here, my problem was due to the weave interface not coming up so the containers didn't have networking, however this was due to our firewall blocking weave data and vxlan ports, once I opened this ports things were fine
bjhaid
on 19 May 2017
There were two sets of issues I had, possibly related.
- PLEG. I believe they have gone away, but I have not recreated enough clusters to be completely confident. I do not believe I changed very much (i.e. anything) _directly_ to make that happen.
- Weave issues wherein containers were unable to connect to anything.
Suspiciously, all of the issues with pleg happened at exactly the same time as the weave network issues.
Bryan @ weaveworks, pointed me to the coreos issues. CoreOS has a rather aggressive tendency to try and manage bridges, veths, basically everything. Once I disabled CoreOS from doing it except on lo and actually physical interfaces on the host, all of my problems left.
Are the people still with problems running coreos?
deitch
on 19 May 2017
We've been plagued by these issues for the last month or so, (I want to say after upgrading the clusters to 1.6.x from 1.5.x) and its just as mysterious.
we're running weave, debian jessie AMIs in aws, and every once in a while a cluster will decide that PLEG is not healthy.
Weave seems okay in this case, because pods are coming up fine up util a point.
One thing we noted is if scale ALL our replicas down, the issue seems to go away, but as we start scaling deployments and statefulsets back up, around a certain number of containers, this happens. (at least this time).
docker ps; docker info seem fine on the node.
resource utilization is nominal: 5% cpu util, 1.5/8gb of RAM used (according to root htop), total node resource provisioning sits around 30% with everything that's supposed to be scheduled on it, scheduled.
We cannot get our head around this at all.
I really wish PLEG check was a little more verbose, and we had some actual detailed docu about what the beep its doing, because there seem to be a HUGE number of issues open about it, no one really knows what it is, and for such a critical module, i would love ot be able to reproduce the checks that it sees as failing.
 hollowimage
on 26 May 2017
hollowimage
on 26 May 2017
I second the thoughts on pleg mysteriousness. On my end though, after much work for my client, stabilizing coreos and its misbehaviour with networks helped a lot.
deitch
on 26 May 2017
The PLEG health check does very little. In every iteration, it calls docker ps to detect container states changes, and call docker ps and inspect to get the details of those containers.
After finishing each iteration, it updates a timestamp. If the timestamp hasn't been updated for a while (i.e., 3 minutes), the health check fails.
Unless your node is loaded with huge number of pods that PLEG can't finish doing all these in 3 minutes (which should not happen), the most probable cause would be that docker is slow. You may not observe that in your occasional docker ps check, but that doesn't mean it's not there.
If we don't expose the "unhealthy" status, it'd hide many problems from the users and potentially cause more issue. For example, kubelet'd silently not reacting to changes in a timely manner and cause even more confusion.
Suggestions on how to make this more debuggable are welcome...
yujuhong
on 27 May 2017
Running into PLEG unhealthy warnings and flapping node health status : k8s 1.6.4 with weave. Only appears on a subset of (otherwise identical) nodes.
 anurag
on 27 May 2017
anurag
on 27 May 2017
Just a quick heads up, in our case the flapping workers and pods stuck in ContainerCreating was a problem with the security groups of our EC2 instances not allowing weave traffic between master and workers and among the workers. Therefore the node could not properly come up and got stuck in NotReady.
kuberrnetes 1.6.4
with proper security group it works now.
 agabert
on 1 Jun 2017
agabert
on 1 Jun 2017
I am experiencing something like this issue with this config...
Kubernetes version (use kubectl version): 1.6.4
Environment:
Cloud provider or hardware configuration: single System76 server
OS (e.g. from /etc/os-release): Ubuntu 16.04.2 LTS
Kernel (e.g. uname -a): Linux system76-server 4.4.0-78-generic #99-Ubuntu SMP Thu Apr 27 15:29:09 UTC 2017 x86_64 x86_64 x86_64 GNU/Linux
Install tools: kubeadm + weave.works
Since this is a single-node cluster, I don't think my version of this issue is related to security groups or firewalls.
 wirehead
on 1 Jun 2017
wirehead
on 1 Jun 2017
The issue with security groups would make sense if you're just starting up the cluster. But these issues we're seeing are on clusters that have been running for months, with security groups in place.
hollowimage
on 2 Jun 2017
I had something similar just happen to me running kubelet version 1.6.2 on GKE.
One of our nodes got shifted into a not ready state, the kubelet logs on that node had two complaints, one that the PLEG status check failed, and two interestingly, that the image listing operations failed.
Some examples of which image function calls failed.
image_gc_manager.go:176
kuberuntime_image.go:106
remote_image.go:61
Which I'm assuming are calls to the the docker daemon.
As this was happening I saw disk IO spike a lot, especially the read operations. From ~50kb/s mark to 8mb/s mark.
It corrected itself after about 30-45 minutes, but maybe it was a image GC sweep causing the increased IO?
As has been said, PLEG monitors the pods through the docker daemon, if that's doing a lot of operations art once could the PLEG checks be queued?
 zoltrain
on 2 Jun 2017
zoltrain
on 2 Jun 2017
I'm seeing this problem in 1.6.4 and 1.6.6 (on GKE) with flapping NotReady as the result. Since this is the latest version available on GKE I'd love to have any fixes backported to the next 1.6 release.
One interesting thing is that the time that PLEG was last seen active doesn't change and is always a _huge_ number (perhaps it's at some limit of whatever type it's stored in).
[container runtime is down PLEG is not healthy: pleg was last seen active 2562047h47m16.854775807s ago; threshold is 3m0s]
 bergman
on 26 Jun 2017
bergman
on 26 Jun 2017
[container runtime is down PLEG is not healthy: pleg was last seen active 2562047h47m16.854775807s ago; threshold is 3m0s]
@bergman I haven't seen this but if this is the case, your node would have never been ready. Feel free to report this through the GKE channel so that the GKE team can investigate more.
It corrected itself after about 30-45 minutes, but maybe it was a image GC sweep causing the increased IO?
This is certainly possible. Image GC could sometimes cause docker daemon to respond extremely slowly. 30-45 minutes sounds quite long. @zoltrain, was images getting removed throughout the entire duration.
To reiterate my previous statement, PLEG does very little and it only fails the health check because the docker daemon is unresponsive. We surface this information through the PLEG health check to let the control plane know that the node is not getting the container stats (and react to them) properly. Blindly removing this check may mask more serious issues.
yujuhong
on 26 Jun 2017
TO update: we found the issue on our end as was related to weave and ip-slice provisioning. as we terminate nodes often in AWS, weave originally did not account for the destruction of nodes in a cluster permanently, with new IPs taht follow. as a result networking would not setup correctly, so anything that had to do with internal ranges would not come up correctly.
https://github.com/weaveworks/weave/issues/2970
for those who use weave.
hollowimage
on 26 Jun 2017
[container runtime is down PLEG is not healthy: pleg was last seen active 2562047h47m16.854775807s ago; threshold is 3m0s]
@bergman I haven't seen this but if this is the case, your node would have never been ready. Feel free to report this through the GKE channel so that the GKE team can investigate more.
The node is Ready most of the time. I believe kubelet is either restarted due to this check or some other check is signalling the Ready event. We see about 10 seconds of NotReady for every 60 seconds. The rest of the time the node is Ready.
bergman
on 27 Jun 2017
@yujuhong I think the PLEG logging can be improved, saying PLEG is not healthy is super confusing to the end user and it doesn't help diagnosing problems, maybe including why the container runtime failed, or some details about the container runtime not responding will be more useful
bjhaid
on 27 Jun 2017
I do not see flapping but consistently not ready state for the node with 1.6.4 and calico, not weave.
 chenww
on 21 Jul 2017
chenww
on 21 Jul 2017
@yujuhong I think the PLEG logging can be improved, saying PLEG is not healthy is super confusing to the end user and it doesn't help diagnosing problems, maybe including why the container runtime failed, or some details about the container runtime not responding will be more useful
Sure. Feel free to send a PR.
yujuhong
on 21 Jul 2017
I was having this issue while doing docker image clean up. I guess docker was too busy. After images are removed, it's back to normal.
 xcompass
on 19 Aug 2017
xcompass
on 19 Aug 2017
I hit a same issue. I suspect the reason is that ntpd correct current time.
I has saw that the ntpd correct time in v1.6.9
Sep 12 19:05:08 node-6 systemd: Started logagt.
Sep 12 19:05:08 node-6 systemd: Starting logagt...
Sep 12 19:05:09 node-6 cnrm: "Log":"2017-09-12 19:05:09.197083#011ERROR#011node-6#011knitter.cnrm.mod-init#011TransactionID=1#011InstanceID=1174#011[ObjectType=null,ObjectID=null]#011registerOir: k8s.GetK8sClientSingleton().RegisterOir(oirName: hugepage, qty: 2048) FAIL, error: dial tcp 120.0.0.250:8080: getsockopt: no route to host, retry#011[init.go]#011[68]"
Sep 12 11:04:53 node-6 ntpd[902]: 0.0.0.0 c61c 0c clock_step -28818.771869 s
Sep 12 11:04:53 node-6 ntpd[902]: 0.0.0.0 c614 04 freq_mode
Sep 12 11:04:53 node-6 systemd: Time has been changed
Sep 12 11:04:54 node-6 ntpd[902]: 0.0.0.0 c618 08 no_sys_peer
Sep 12 11:05:04 node-6 systemd: Reloading.
Sep 12 11:05:04 node-6 systemd: Configuration file /usr/lib/systemd/system/auditd.service is marked world-inaccessible. This has no effect as configuration data is accessible via APIs without restrictions. Proceeding anyway.
Sep 12 11:05:04 node-6 systemd: Started opslet.
Sep 12 11:05:04 node-6 systemd: Starting opslet...
Sep 12 11:05:13 node-6 systemd: Reloading.
Sep 12 11:05:22 node-6 kubelet: E0912 11:05:22.425676    2429 event.go:259] Could not construct reference to: '&v1.Node{TypeMeta:v1.TypeMeta{Kind:"", APIVersion:""}, ObjectMeta:v1.ObjectMeta{Name:"120.0.0.251", GenerateName:"", Namespace:"", SelfLink:"", UID:"", ResourceVersion:"", Generation:0, CreationTimestamp:v1.Time{Time:time.Time{sec:0, nsec:0, loc:(*time.Location)(nil)}}, DeletionTimestamp:(*v1.Time)(nil), DeletionGracePeriodSeconds:(*int64)(nil), Labels:map[string]string{"beta.kubernetes.io/os":"linux", "beta.kubernetes.io/arch":"amd64", "kubernetes.io/hostname":"120.0.0.251"}, Annotations:map[string]string{"volumes.kubernetes.io/controller-managed-attach-detach":"true"}, OwnerReferences:[]v1.OwnerReference(nil), Finalizers:[]string(nil), ClusterName:""}, Spec:v1.NodeSpec{PodCIDR:"", ExternalID:"120.0.0.251", ProviderID:"", Unschedulable:false, Taints:[]v1.Taint(nil)}, Status:v1.NodeStatus{Capacity:v1.ResourceList{"cpu":resource.Quantity{i:resource.int64Amount{value:4000, scale:-3}, d:resource.infDecAmount{Dec:(*inf.Dec)(nil)}, l:[]int64(nil), s:"", Format:"DecimalSI"}, "memory":resource.Quantity{i:resource.int64Amount{value:3974811648, scale:0}, d:resource.infDecAmount{Dec:(*inf.Dec)(nil)}, l:[]int64(nil), s:"", Format:"BinarySI"}, "hugePages":resource.Quantity{i:resource.int64Amount{value:1024, scale:0}, d:resource.infDecAmount{Dec:(*inf.Dec)(nil)}, l:[]int64(nil), s:"", Format:"DecimalSI"}, "pods":resource.Quantity{i:resource.int64Amount{value:110, scale:0}, d:resource.infDecAmount{Dec:(*inf.Dec)(nil)}, l:[]int64(nil), s:"", Format:"DecimalSI"}}, Allocatable:v1.ResourceList{"cpu":resource.Quantity{i:resource.int64Amount{value:3500, scale:-3}, d:resource.infDecAmount{Dec:(*inf.Dec)(nil)}, l:[]int64(nil), s:"", Format:"DecimalSI"}, "memory":resource.Quantity{i:resource.int64Amount{value:1345666048, scale:0}, d:resource.infDecAmount{Dec:(*inf.Dec)(nil)}, l:[]int64(nil), s:"", Format:"BinarySI"}, "hugePages":resource.Quantity{i:resource.int64Amount{value:1024, scale:0}, d:resource.infDecAmount{Dec:(*inf.Dec)(nil)}, l:[]int64(nil), s:"",
Sep 12 11:05:22 node-6 kubelet: Format:"DecimalSI"}, "pods":resource.Quantity{i:resource.int64Amount{value:110, scale:0}, d:resource.infDecAmount{Dec:(*inf.Dec)(nil)}, l:[]int64(nil), s:"", Format:"DecimalSI"}}, Phase:"", Conditions:[]v1.NodeCondition{v1.NodeCondition{Type:"OutOfDisk", Status:"False", LastHeartbeatTime:v1.Time{Time:time.Time{sec:63640811081, nsec:196025689, loc:(*time.Location)(0x4e8e3a0)}}, LastTransitionTime:v1.Time{Time:time.Time{sec:63640811081, nsec:196025689, loc:(*time.Location)(0x4e8e3a0)}}, Reason:"KubeletHasSufficientDisk", Message:"kubelet has sufficient disk space available"}, v1.NodeCondition{Type:"MemoryPressure", Status:"False", LastHeartbeatTime:v1.Time{Time:time.Time{sec:63640811081, nsec:196099492, loc:(*time.Location)(0x4e8e3a0)}}, LastTransitionTime:v1.Time{Time:time.Time{sec:63640811081, nsec:196099492, loc:(*time.Location)(0x4e8e3a0)}}, Reason:"KubeletHasSufficientMemory", Message:"kubelet has sufficient memory available"}, v1.NodeCondition{Type:"DiskPressure", Status:"False", LastHeartbeatTime:v1.Time{Time:time.Time{sec:63640811081, nsec:196107935, loc:(*time.Location)(0x4e8e3a0)}}, LastTransitionTime:v1.Time{Time:time.Time{sec:63640811081, nsec:196107935, loc:(*time.Location)(0x4e8e3a0)}}, Reason:"KubeletHasNoDiskPressure", Message:"kubelet has no disk pressure"}, v1.NodeCondition{Type:"Ready", Status:"False", LastHeartbeatTime:v1.Time{Time:time.Time{sec:63640811081, nsec:196114314, loc:(*time.Location)(0x4e8e3a0)}}, LastTransitionTime:v1.Time{Time:time.Time{sec:63640811081, nsec:196114314, loc:(*time.Location)(0x4e8e3a0)}}, Reason:"KubeletNotReady", Message:"container runtime is down,PLEG is not healthy: pleg was last seen active 2562047h47m16.854775807s ago; threshold is 3m0s,network state unknown"}}, Addresses:[]v1.NodeAddress{v1.NodeAddress{Type:"LegacyHostIP", Address:"120.0.0.251"}, v1.NodeAddress{Type:"InternalIP", Address:"120.0.0.251"}, v1.NodeAddress{Type:"Hostname", Address:"120.0.0.251"}}, DaemonEndpoints:v1.NodeDaemonEndpoints{KubeletEndpoint:v1.DaemonEndpoint{Port:10250}}, NodeInfo:v1.NodeS
 yanxuean
on 14 Sep 2017
yanxuean
on 14 Sep 2017
mark.
 warmchang
on 14 Sep 2017
warmchang
on 14 Sep 2017
Same issue here.
It appears when pod killing but stuck in killing state Normal Killing Killing container with docker id 472802bf1dba: Need to kill pod.
and kubelet logs like this:
skipping pod synchronization - [PLEG is not healthy: pleg was last seen active
k8s cluste version: 1.6.4
@xcompass Do you using --image-gc-high-threshold and --image-gc-low-threshold flags for kubelet config? I suspect kubelet gc keep busy docker deamon.
 alirezaDavid
on 19 Sep 2017
alirezaDavid
on 19 Sep 2017
@alirezaDavid I encountered the same issue just like yours, pod start and terminate very slow, and node became notReady every now and then, restart kubelet on node or restart docker looks solve the problem, but this is not the right way.
 yangyuw
on 19 Sep 2017
yangyuw
on 19 Sep 2017
@yu-yang2 Yap exactly, I restart kubelet
But before restart kubelet i checked out docker ps and systemctl -u docker and everything seems working.
alirezaDavid
on 19 Sep 2017
We had this issue on kubernetes with weave and autoscalers. It turned out to be that weave had no more ip addresses to assign out. This was detected by running. weave status ipam from this issue: https://github.com/weaveworks/weave/issues/2970
The root cause is here: https://github.com/weaveworks/weave/issues/2797
The documentation warns about autoscalers and weave: https://www.weave.works/docs/net/latest/operational-guide/tasks/
When we ran weave --local status ipam there were hundreds of unavailable nodes with large numbers of ip addresses assigned to them. This happens because the autoscaler terminates the instances without letting weave know. This left only a handful for the actually connected nodes. I used weave rmpeer to clear out some of the unavailable peers. This then gave the node i was running on a group of ip addresses. I then went to other running weave nodes and ran a few rmpeer commands from them as well (i'm not sure if that's necessary).
I terminated some of the ec2 instances, and new ones were brought up by the autoscaler and were immediately assigned ip addresses.
 mattthelee
on 29 Sep 2017
mattthelee
on 29 Sep 2017
Hi folks. In my case I had the PLEG problem with a deletion of sandboxes, because they didn't have a network namespace. That situation described in https://github.com/kubernetes/kubernetes/issues/44307
My problem was:
- Pod deployed.
- Pod deleted. Container of application deleted without problems. Sandbox of application wasn't deleted.
- PLEG tries to commit/delete/finish the sandbox, PLEG cannot do this and marks node as unhealthy.
As I can see, all people in this bug use 1.6.* of Kubernetes, it should be fixed in 1.7.
PS. Saw this situation with origin 3.6 (kubernetes 1.6).
 livelace
on 2 Oct 2017
livelace
on 2 Oct 2017
Hi,
I've got a PLEG issue myself (Azure, k8s 1.7.7) :
Oct  5 08:13:27 k8s-agent-27569017-1 docker[1978]: E1005 08:13:27.386295    2209 remote_runtime.go:168] ListPodSandbox with filter "nil" from runtime service failed: rpc error: code = 4 desc = context deadline exceeded
Oct  5 08:13:27 k8s-agent-27569017-1 docker[1978]: E1005 08:13:27.386351    2209 kuberuntime_sandbox.go:197] ListPodSandbox failed: rpc error: code = 4 desc = context deadline exceeded
Oct  5 08:13:27 k8s-agent-27569017-1 docker[1978]: E1005 08:13:27.386360    2209 generic.go:196] GenericPLEG: Unable to retrieve pods: rpc error: code = 4 desc = context deadline exceeded
Oct  5 08:13:30 k8s-agent-27569017-1 docker[1978]: I1005 08:13:30.953599    2209 helpers.go:102] Unable to get network stats from pid 60677: couldn't read network stats: failure opening /proc/60677/net/dev: open /proc/60677/net/dev: no such file or directory
Oct  5 08:13:30 k8s-agent-27569017-1 docker[1978]: I1005 08:13:30.953634    2209 helpers.go:125] Unable to get udp stats from pid 60677: failure opening /proc/60677/net/udp: open /proc/60677/net/udp: no such file or directory
Oct  5 08:13:30 k8s-agent-27569017-1 docker[1978]: I1005 08:13:30.953642    2209 helpers.go:132] Unable to get udp6 stats from pid 60677: failure opening /proc/60677/net/udp6: open /proc/60677/net/udp6: no such file or directory
Oct  5 08:13:31 k8s-agent-27569017-1 docker[1978]: I1005 08:13:31.763914    2209 kubelet.go:1820] skipping pod synchronization - [PLEG is not healthy: pleg was last seen active 13h42m52.628402637s ago; threshold is 3m0s]
Oct  5 08:13:35 k8s-agent-27569017-1 docker[1978]: I1005 08:13:35.977487    2209 kubelet_node_status.go:467] Using Node Hostname from cloudprovider: "k8s-agent-27569017-1"
Oct  5 08:13:36 k8s-agent-27569017-1 docker[1978]: I1005 08:13:36.764105    2209 kubelet.go:1820] skipping pod synchronization - [PLEG is not healthy: pleg was last seen active 13h42m57.628610126s ago; threshold is 3m0s]
Oct  5 08:13:39 k8s-agent-27569017-1 docker[1275]: time="2017-10-05T08:13:39.185111999Z" level=warning msg="Health check error: rpc error: code = 4 desc = context deadline exceeded"
Oct  5 08:13:41 k8s-agent-27569017-1 docker[1978]: I1005 08:13:41.764235    2209 kubelet.go:1820] skipping pod synchronization - [PLEG is not healthy: pleg was last seen active 13h43m2.628732806s ago; threshold is 3m0s]
Oct  5 08:13:41 k8s-agent-27569017-1 docker[1978]: I1005 08:13:41.875074    2209 helpers.go:102] Unable to get network stats from pid 60677: couldn't read network stats: failure opening /proc/60677/net/dev: open /proc/60677/net/dev: no such file or directory
Oct  5 08:13:41 k8s-agent-27569017-1 docker[1978]: I1005 08:13:41.875102    2209 helpers.go:125] Unable to get udp stats from pid 60677: failure opening /proc/60677/net/udp: open /proc/60677/net/udp: no such file or directory
Oct  5 08:13:41 k8s-agent-27569017-1 docker[1978]: I1005 08:13:41.875113    2209 helpers.go:132] Unable to get udp6 stats from pid 60677: failure opening /proc/60677/net/udp6: open /proc/60677/net/udp6: no such file or directory
 sylr
on 5 Oct 2017
sylr
on 5 Oct 2017
We're running v1.7.4+coreos.0 on stable CoreOS. We experience that our k8s nodes go down (and doesn't come up until we restart the docker and/or kubelet service) as frequent as every 8 hour because of PLEG. Containers keep running but in k8s are reported as Unknown. I should mention we deploy using Kubespray.
We've tracked down the problem to what we believe is the backoff algorithm in GRPC when communicating with docker in order to list containers. This PR https://github.com/moby/moby/pull/33483 changes the backoff to a maximum of 2 seconds and is available in 17.06 however kubernetes doesn't support 17.06 until 1.8 right?
The line in PLEG causing problems is this.
We used prometheus to inspect the PLEGRelistInterval and PLEGRelistLatency metrics and got the following result which is pretty consistent with the backoff algorithm theory.
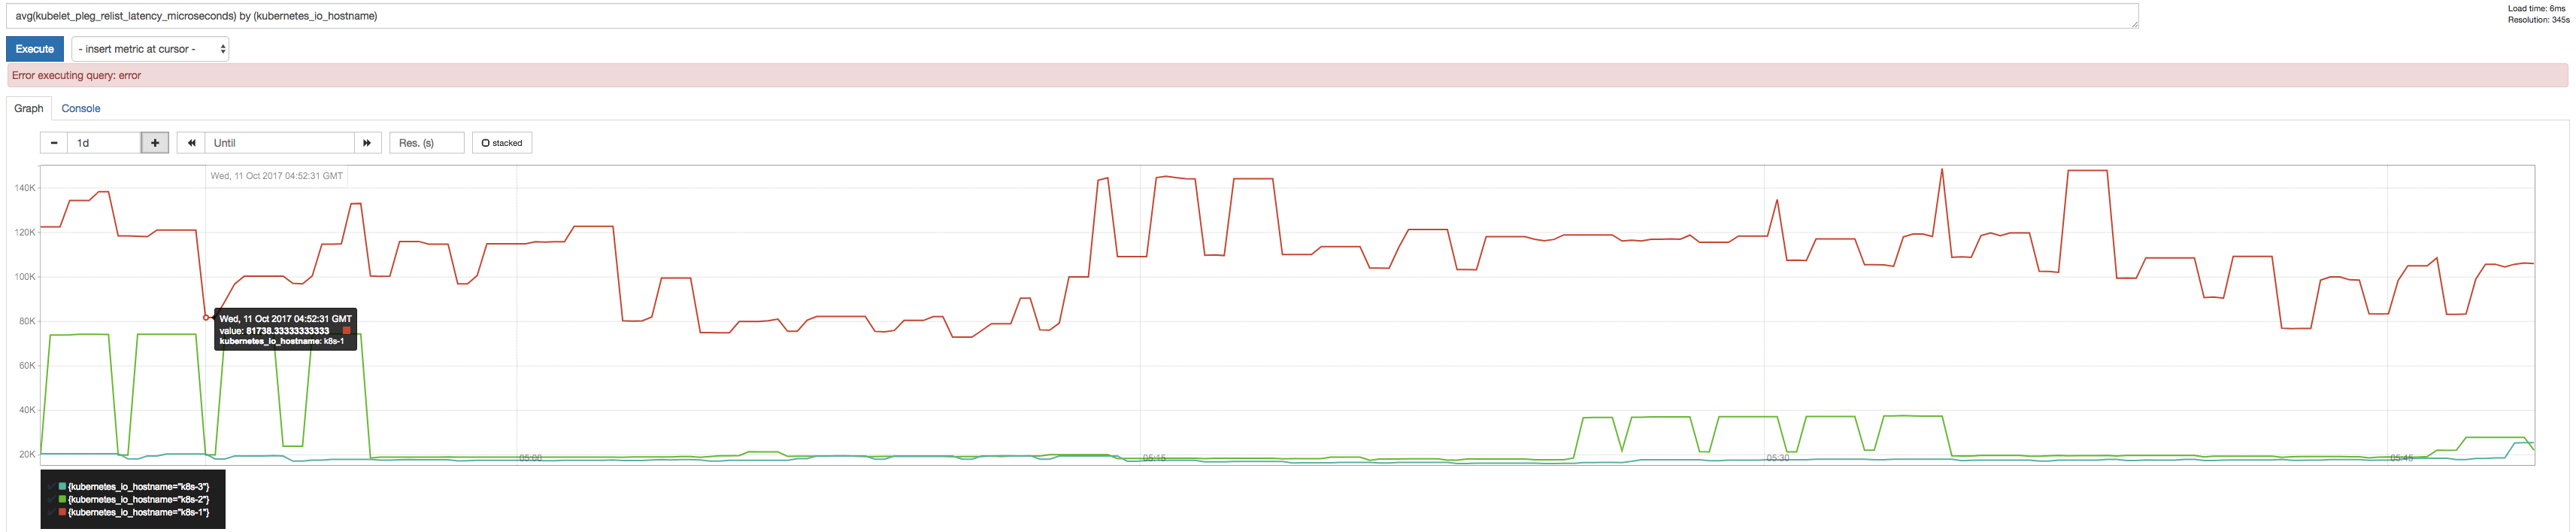


 ssboisen
on 11 Oct 2017
ssboisen
on 11 Oct 2017
@ssboisen thanks for reporting with the graphs (they do look interesting)!
We experience that our k8s nodes go down (and doesn't come up until we restart the docker and/or kubelet service) as frequent as every 8 hour because of PLEG. Containers keep running but in k8s are reported as Unknown. I should mention we deploy using Kubespray.
Some questions I have:
- Does restarting any one of docker and kubelet solve the issue?
- When the issue happens, does
docker psresponds normally?
We've tracked down the problem to what we believe is the backoff algorithm in GRPC when communicating with docker in order to list containers. This PR moby/moby#33483 changes the backoff to a maximum of 2 seconds and is available in 17.06 however kubernetes doesn't support 17.06 until 1.8 right?
I looked at the moby issues you mentioned, but in that discussion, all docker ps calls were still functioning properly (even though the dockerd <-> containerd connection was broken). This seems different from the PLEG issue you mentioned. Also, kubelet doesn't talk to dockerd using grpc. It does use grpc to communicate with the dockershim, but they are essentially the same process and should not encounter the problem of one gets killed while the other still alive (leading to a broken connection).
         grpc              http           grpc
kubelet <----> dockershim <----> dockerd <----> containerd
What's the error message you saw in the kubelet log? Most of the comments above had "context deadline exceeded" error messages,
yujuhong
on 11 Oct 2017
- Does restarting any one of docker and kubelet solve the issue?
It changes, most often it's enough to restart kubelet but we have had situations where a docker restart was necessary.
- When the issue happens, does
docker psresponds normally?
We have no problem running docker ps on the node when the PLEG is acting up. I didn't know about the dockershim, I wonder if it's the connection between kubelet and dockershim that is the problem, could the shim not be answering in time leading to climbing backoffs?
The error message in the log is a combination of the following two lines:
generic.go:196] GenericPLEG: Unable to retrieve pods: rpc error: code = 14 desc = grpc: the connection is unavailable

kubelet.go:1820] skipping pod synchronization - [container runtime is down PLEG is not healthy: pleg was last seen active 11h5m56.959313178s ago; threshold is 3m0s]
Do you have any suggestions as to how we might get more info so we can better debug this problem?
ssboisen
on 12 Oct 2017
- Does restarting any one of docker and kubelet solve the issue?
Yes, just restart docker will fix it so it is not k8s issue - When the issue happens, does docker ps responds normally?
Nope. it hangs. Docker run any container on that node will hang.
Most likely a docker issue for me, not k8s, which is doing the right thing. However, could not find why docker is misbehaving here. All CPU/memory/disk resources is great.
restart docker service will resume good state.
chenww
on 23 Oct 2017
Do you have any suggestions as to how we might get more info so we can better debug this problem?
I think the first step is to confirm what component (dockershim or docker/containerd) returned the error message.
You could probably figure this out by cross referencing kubelet and docker logs.
yujuhong
on 23 Oct 2017
Most likely a docker issue for me, not k8s, which is doing the right thing. However, could not find why docker is misbehaving here. All CPU/memory/disk resources is great.
Yep. In your case, it looks like docker daemon actually hangs. You could start the docker daemon in the debugging mode and get a stacktrace when it happens.
https://docs.docker.com/engine/admin/#force-a-stack-trace-to-be-logged
yujuhong
on 23 Oct 2017
@yujuhong I encountered this problem again after a load test of k8s, almost all nodes become not ready and didn't recovery after I clean the pods for several days, I opened the verbose mode in every kubelet and got the logs below, hope that these logs will help solve the problem:
Oct 24 21:16:39 docker34-91 kubelet[24165]: I1024 21:16:39.539054   24165 config.go:101] Looking for [api file], have seen map[file:{} api:{}]
Oct 24 21:16:39 docker34-91 kubelet[24165]: I1024 21:16:39.639305   24165 config.go:101] Looking for [api file], have seen map[file:{} api:{}]
Oct 24 21:16:39 docker34-91 kubelet[24165]: I1024 21:16:39.739585   24165 config.go:101] Looking for [api file], have seen map[file:{} api:{}]
Oct 24 21:16:39 docker34-91 kubelet[24165]: I1024 21:16:39.839829   24165 config.go:101] Looking for [api file], have seen map[file:{} api:{}]
Oct 24 21:16:39 docker34-91 kubelet[24165]: I1024 21:16:39.940111   24165 config.go:101] Looking for [api file], have seen map[file:{} api:{}]
Oct 24 21:16:40 docker34-91 kubelet[24165]: I1024 21:16:40.040374   24165 config.go:101] Looking for [api file], have seen map[file:{} api:{}]
Oct 24 21:16:40 docker34-91 kubelet[24165]: I1024 21:16:40.128789   24165 kubelet.go:2064] Container runtime status: Runtime Conditions: RuntimeReady=true reason: message:, NetworkReady=true reason: message:
Oct 24 21:16:40 docker34-91 kubelet[24165]: I1024 21:16:40.140634   24165 config.go:101] Looking for [api file], have seen map[file:{} api:{}]
Oct 24 21:16:40 docker34-91 kubelet[24165]: I1024 21:16:40.240851   24165 config.go:101] Looking for [api file], have seen map[file:{} api:{}]
Oct 24 21:16:40 docker34-91 kubelet[24165]: I1024 21:16:40.341125   24165 config.go:101] Looking for [api file], have seen map[file:{} api:{}]
Oct 24 21:16:40 docker34-91 kubelet[24165]: I1024 21:16:40.441471   24165 config.go:101] Looking for [api file], have seen map[api:{} file:{}]
Oct 24 21:16:40 docker34-91 kubelet[24165]: I1024 21:16:40.541781   24165 config.go:101] Looking for [api file], have seen map[api:{} file:{}]
Oct 24 21:16:40 docker34-91 kubelet[24165]: I1024 21:16:40.642070   24165 config.go:101] Looking for [api file], have seen map[file:{} api:{}]
Oct 24 21:16:40 docker34-91 kubelet[24165]: I1024 21:16:40.742347   24165 config.go:101] Looking for [api file], have seen map[file:{} api:{}]
Oct 24 21:16:40 docker34-91 kubelet[24165]: I1024 21:16:40.842562   24165 config.go:101] Looking for [api file], have seen map[file:{} api:{}]
Oct 24 21:16:40 docker34-91 kubelet[24165]: I1024 21:16:40.942867   24165 config.go:101] Looking for [api file], have seen map[api:{} file:{}]
Oct 24 21:16:41 docker34-91 kubelet[24165]: I1024 21:16:41.006656   24165 kubelet.go:1752] skipping pod synchronization - [PLEG is not healthy: pleg was last seen active 6m20.171705404s ago; threshold is 3m0s]
Oct 24 21:16:41 docker34-91 kubelet[24165]: I1024 21:16:41.043126   24165 config.go:101] Looking for [api file], have seen map[file:{} api:{}]
Oct 24 21:16:41 docker34-91 kubelet[24165]: I1024 21:16:41.143372   24165 config.go:101] Looking for [api file], have seen map[file:{} api:{}]
Oct 24 21:16:41 docker34-91 kubelet[24165]: I1024 21:16:41.243620   24165 config.go:101] Looking for [api file], have seen map[file:{} api:{}]
Oct 24 21:16:41 docker34-91 kubelet[24165]: I1024 21:16:41.343911   24165 config.go:101] Looking for [api file], have seen map[file:{} api:{}]
Oct 24 21:16:41 docker34-91 kubelet[24165]: I1024 21:16:41.444156   24165 config.go:101] Looking for [api file], have seen map[file:{} api:{}]
Oct 24 21:16:41 docker34-91 kubelet[24165]: I1024 21:16:41.544420   24165 config.go:101] Looking for [api file], have seen map[file:{} api:{}]
Oct 24 21:16:41 docker34-91 kubelet[24165]: I1024 21:16:41.644732   24165 config.go:101] Looking for [api file], have seen map[file:{} api:{}]
Oct 24 21:16:41 docker34-91 kubelet[24165]: I1024 21:16:41.745002   24165 config.go:101] Looking for [api file], have seen map[file:{} api:{}]
Oct 24 21:16:41 docker34-91 kubelet[24165]: I1024 21:16:41.845268   24165 config.go:101] Looking for [api file], have seen map[file:{} api:{}]
Oct 24 21:16:41 docker34-91 kubelet[24165]: I1024 21:16:41.945524   24165 config.go:101] Looking for [api file], have seen map[file:{} api:{}]
Oct 24 21:16:42 docker34-91 kubelet[24165]: I1024 21:16:42.045814   24165 config.go:101] Looking for [api file], have seen map[file:{} api:{}]
^C
[root@docker34-91 ~]# journalctl -u kubelet -f
-- Logs begin at Wed 2017-10-25 17:19:29 CST. --
Oct 27 10:22:35 docker34-91 kubelet[24165]: 00000000  6b 38 73 00 0a 0b 0a 02  76 31 12 05 45 76 65 6e  |k8s.....v1..Even|
Oct 27 10:22:35 docker34-91 kubelet[24165]: 00000010  74 12 d3 03 0a 4f 0a 33  6c 64 74 65 73 74 2d 37  |t....O.3ldtest-7|
Oct 27 10:22:35 docker34-91 kubelet[24165]: 00000020  33 34 33 39 39 64 67 35  39 2d 33 33 38 32 38 37  |34399dg59-338287|
Oct 27 10:22:35 docker34-91 kubelet[24165]: 00000030  31 36 38 35 2d 78 32 36  70 30 2e 31 34 66 31 34  |1685-x26p0.14f14|
Oct 27 10:22:35 docker34-91 kubelet[24165]: 00000040  63 30 39 65 62 64 32 64  66 66 34 12 00 1a 0a 6c  |c09ebd2dff4....l|
Oct 27 10:22:35 docker34-91 kubelet[24165]: 00000050  64 74 65 73 74 2d 30 30  35 22 00 2a 00 32 00 38  |dtest-005".*.2.8|
Oct 27 10:22:35 docker34-91 kubelet[24165]: 00000060  00 42 00 7a 00 12 6b 0a  03 50 6f 64 12 0a 6c 64  |.B.z..k..Pod..ld|
Oct 27 10:22:35 docker34-91 kubelet[24165]: 00000070  74 65 73 74 2d 30 30 35  1a 22 6c 64 74 65 73 74  |test-005."ldtest|
Oct 27 10:22:35 docker34-91 kubelet[24165]: 00000080  2d 37 33 34 33 39 39 64  67 35 39 2d 33 33 38 32  |-734399dg59-3382|
Oct 27 10:22:35 docker34-91 kubelet[24165]: 00000090  38 37 31 36 38 35 2d 78  32 36 70 30 22 24 61 35  |871685-x26p0"$a5|
Oct 27 10:23:02 docker34-91 kubelet[24165]: I1027 10:23:02.098922   24165 kubelet.go:2064] Container runtime status: Runtime Conditions: RuntimeReady=true reason: message:, NetworkReady=true reason: message:
Oct 27 10:23:02 docker34-91 kubelet[24165]: I1027 10:23:02.175027   24165 config.go:101] Looking for [api file], have seen map[file:{} api:{}]
Oct 27 10:23:02 docker34-91 kubelet[24165]: I1027 10:23:02.275290   24165 config.go:101] Looking for [api file], have seen map[file:{} api:{}]
Oct 27 10:23:02 docker34-91 kubelet[24165]: I1027 10:23:02.375594   24165 config.go:101] Looking for [api file], have seen map[file:{} api:{}]
Oct 27 10:23:02 docker34-91 kubelet[24165]: I1027 10:23:02.475872   24165 config.go:101] Looking for [api file], have seen map[file:{} api:{}]
Oct 27 10:23:02 docker34-91 kubelet[24165]: I1027 10:23:02.576140   24165 config.go:101] Looking for [api file], have seen map[file:{} api:{}]
Oct 27 10:23:02 docker34-91 kubelet[24165]: I1027 10:23:02.676412   24165 config.go:101] Looking for [api file], have seen map[file:{} api:{}]
Oct 27 10:23:02 docker34-91 kubelet[24165]: I1027 10:23:02.776613   24165 config.go:101] Looking for [api file], have seen map[file:{} api:{}]
Oct 27 10:23:02 docker34-91 kubelet[24165]: I1027 10:23:02.876855   24165 config.go:101] Looking for [api file], have seen map[file:{} api:{}]
Oct 27 10:23:02 docker34-91 kubelet[24165]: I1027 10:23:02.977126   24165 config.go:101] Looking for [api file], have seen map[file:{} api:{}]
Oct 27 10:23:03 docker34-91 kubelet[24165]: I1027 10:23:03.000354   24165 status_manager.go:410] Status Manager: syncPod in syncbatch. pod UID: "a052cabc-bab9-11e7-92f6-3497f60062c3"
Oct 27 10:23:03 docker34-91 kubelet[24165]: I1027 10:23:03.000509   24165 round_trippers.go:398] curl -k -v -XGET  -H "Accept: application/vnd.kubernetes.protobuf, */*" -H "User-Agent: kubelet/v1.6.4 (linux/amd64) kubernetes/d6f4332" http://172.23.48.211:8080/api/v1/namespaces/ldtest-005/pods/ldtest-276aa6023f-1106740979-hbtcv
Oct 27 10:23:03 docker34-91 kubelet[24165]: I1027 10:23:03.001753   24165 round_trippers.go:417] GET http://172.23.48.211:8080/api/v1/namespaces/ldtest-005/pods/ldtest-276aa6023f-1106740979-hbtcv 404 Not Found in 1 milliseconds
Oct 27 10:23:03 docker34-91 kubelet[24165]: I1027 10:23:03.001768   24165 round_trippers.go:423] Response Headers:
Oct 27 10:23:03 docker34-91 kubelet[24165]: I1027 10:23:03.001773   24165 round_trippers.go:426]     Content-Type: application/vnd.kubernetes.protobuf
Oct 27 10:23:03 docker34-91 kubelet[24165]: I1027 10:23:03.001776   24165 round_trippers.go:426]     Date: Fri, 27 Oct 2017 02:23:03 GMT
Oct 27 10:23:03 docker34-91 kubelet[24165]: I1027 10:23:03.001780   24165 round_trippers.go:426]     Content-Length: 154
Oct 27 10:23:03 docker34-91 kubelet[24165]: I1027 10:23:03.001838   24165 request.go:989] Response Body:
Oct 27 10:23:03 docker34-91 kubelet[24165]: 00000000  6b 38 73 00 0a 0c 0a 02  76 31 12 06 53 74 61 74  |k8s.....v1..Stat|
Oct 27 10:23:03 docker34-91 kubelet[24165]: 00000010  75 73 12 81 01 0a 04 0a  00 12 00 12 07 46 61 69  |us...........Fai|
Oct 27 10:23:03 docker34-91 kubelet[24165]: 00000020  6c 75 72 65 1a 33 70 6f  64 73 20 22 6c 64 74 65  |lure.3pods "ldte|
Oct 27 10:23:03 docker34-91 kubelet[24165]: 00000030  73 74 2d 32 37 36 61 61  36 30 32 33 66 2d 31 31  |st-276aa6023f-11|
Oct 27 10:23:03 docker34-91 kubelet[24165]: 00000040  30 36 37 34 30 39 37 39  2d 68 62 74 63 76 22 20  |06740979-hbtcv" |
Oct 27 10:23:03 docker34-91 kubelet[24165]: 00000050  6e 6f 74 20 66 6f 75 6e  64 22 08 4e 6f 74 46 6f  |not found".NotFo|
Oct 27 10:23:03 docker34-91 kubelet[24165]: 00000060  75 6e 64 2a 2e 0a 22 6c  64 74 65 73 74 2d 32 37  |und*.."ldtest-27|
Oct 27 10:23:03 docker34-91 kubelet[24165]: 00000070  36 61 61 36 30 32 33 66  2d 31 31 30 36 37 34 30  |6aa6023f-1106740|
Oct 27 10:23:03 docker34-91 kubelet[24165]: 00000080  39 37 39 2d 68 62 74 63  76 12 00 1a 04 70 6f 64  |979-hbtcv....pod|
Oct 27 10:23:03 docker34-91 kubelet[24165]: 00000090  73 28 00 30 94 03 1a 00  22 00                    |s(.0....".|
Oct 27 10:23:03 docker34-91 kubelet[24165]: I1027 10:23:03.001885   24165 status_manager.go:425] Pod "ldtest-276aa6023f-1106740979-hbtcv" (a052cabc-bab9-11e7-92f6-3497f60062c3) does not exist on the server
Oct 27 10:23:03 docker34-91 kubelet[24165]: I1027 10:23:03.001900   24165 status_manager.go:410] Status Manager: syncPod in syncbatch. pod UID: "a584c63e-bab7-11e7-92f6-3497f60062c3"
Oct 27 10:23:03 docker34-91 kubelet[24165]: I1027 10:23:03.001946   24165 round_trippers.go:398] curl -k -v -XGET  -H "Accept: application/vnd.kubernetes.protobuf, */*" -H "User-Agent: kubelet/v1.6.4 (linux/amd64) kubernetes/d6f4332" http://172.23.48.211:8080/api/v1/namespaces/ldtest-005/pods/ldtest-734399dg59-3382871685-x26p0
Oct 27 10:23:03 docker34-91 kubelet[24165]: I1027 10:23:03.002559   24165 round_trippers.go:417] GET http://172.23.48.211:8080/api/v1/namespaces/ldtest-005/pods/ldtest-734399dg59-3382871685-x26p0 404 Not Found in 0 milliseconds
Oct 27 10:23:03 docker34-91 kubelet[24165]: I1027 10:23:03.002569   24165 round_trippers.go:423] Response Headers:
Oct 27 10:23:03 docker34-91 kubelet[24165]: I1027 10:23:03.002573   24165 round_trippers.go:426]     Content-Type: application/vnd.kubernetes.protobuf
Oct 27 10:23:03 docker34-91 kubelet[24165]: I1027 10:23:03.002577   24165 round_trippers.go:426]     Date: Fri, 27 Oct 2017 02:23:03 GMT
Oct 27 10:23:03 docker34-91 kubelet[24165]: I1027 10:23:03.002580   24165 round_trippers.go:426]     Content-Length: 154
Oct 27 10:23:03 docker34-91 kubelet[24165]: I1027 10:23:03.002627   24165 request.go:989] Response Body:
Oct 27 10:23:03 docker34-91 kubelet[24165]: 00000000  6b 38 73 00 0a 0c 0a 02  76 31 12 06 53 74 61 74  |k8s.....v1..Stat|
Oct 27 10:23:03 docker34-91 kubelet[24165]: 00000010  75 73 12 81 01 0a 04 0a  00 12 00 12 07 46 61 69  |us...........Fai|
Oct 27 10:23:03 docker34-91 kubelet[24165]: 00000020  6c 75 72 65 1a 33 70 6f  64 73 20 22 6c 64 74 65  |lure.3pods "ldte|
Oct 27 10:23:03 docker34-91 kubelet[24165]: 00000030  73 74 2d 37 33 34 33 39  39 64 67 35 39 2d 33 33  |st-734399dg59-33|
Oct 27 10:23:03 docker34-91 kubelet[24165]: 00000040  38 32 38 37 31 36 38 35  2d 78 32 36 70 30 22 20  |82871685-x26p0" |
Oct 27 10:23:03 docker34-91 kubelet[24165]: 00000050  6e 6f 74 20 66 6f 75 6e  64 22 08 4e 6f 74 46 6f  |not found".NotFo|
Oct 27 10:23:03 docker34-91 kubelet[24165]: 00000060  75 6e 64 2a 2e 0a 22 6c  64 74 65 73 74 2d 37 33  |und*.."ldtest-73|
Oct 27 10:23:03 docker34-91 kubelet[24165]: 00000070  34 33 39 39 64 67 35 39  2d 33 33 38 32 38 37 31  |4399dg59-3382871|
Oct 27 10:23:03 docker34-91 kubelet[24165]: 00000080  36 38 35 2d 78 32 36 70  30 12 00 1a 04 70 6f 64  |685-x26p0....pod|
Oct 27 10:23:03 docker34-91 kubelet[24165]: 00000090  73 28 00 30 94 03 1a 00  22 00                    |s(.0....".|
Oct 27 10:23:03 docker34-91 kubelet[24165]: I1027 10:23:03.002659   24165 status_manager.go:425] Pod "ldtest-734399dg59-3382871685-x26p0" (a584c63e-bab7-11e7-92f6-3497f60062c3) does not exist on the server
Oct 27 10:23:03 docker34-91 kubelet[24165]: I1027 10:23:03.002668   24165 status_manager.go:410] Status Manager: syncPod in syncbatch. pod UID: "2727277f-bab3-11e7-92f6-3497f60062c3"
Oct 27 10:23:03 docker34-91 kubelet[24165]: I1027 10:23:03.002711   24165 round_trippers.go:398] curl -k -v -XGET  -H "User-Agent: kubelet/v1.6.4 (linux/amd64) kubernetes/d6f4332" -H "Accept: application/vnd.kubernetes.protobuf, */*" http://172.23.48.211:8080/api/v1/namespaces/ldtest-005/pods/ldtest-4bc7922c25-2238154508-xt94x
Oct 27 10:23:03 docker34-91 kubelet[24165]: I1027 10:23:03.003318   24165 round_trippers.go:417] GET http://172.23.48.211:8080/api/v1/namespaces/ldtest-005/pods/ldtest-4bc7922c25-2238154508-xt94x 404 Not Found in 0 milliseconds
Oct 27 10:23:03 docker34-91 kubelet[24165]: I1027 10:23:03.003328   24165 round_trippers.go:423] Response Headers:
Oct 27 10:23:03 docker34-91 kubelet[24165]: I1027 10:23:03.003332   24165 round_trippers.go:426]     Date: Fri, 27 Oct 2017 02:23:03 GMT
Oct 27 10:23:03 docker34-91 kubelet[24165]: I1027 10:23:03.003336   24165 round_trippers.go:426]     Content-Length: 154
Oct 27 10:23:03 docker34-91 kubelet[24165]: I1027 10:23:03.003339   24165 round_trippers.go:426]     Content-Type: application/vnd.kubernetes.protobuf
Oct 27 10:23:03 docker34-91 kubelet[24165]: I1027 10:23:03.003379   24165 request.go:989] Response Body:
Oct 27 10:23:03 docker34-91 kubelet[24165]: 00000000  6b 38 73 00 0a 0c 0a 02  76 31 12 06 53 74 61 74  |k8s.....v1..Stat|
Oct 27 10:23:03 docker34-91 kubelet[24165]: 00000010  75 73 12 81 01 0a 04 0a  00 12 00 12 07 46 61 69  |us...........Fai|
Oct 27 10:23:03 docker34-91 kubelet[24165]: 00000020  6c 75 72 65 1a 33 70 6f  64 73 20 22 6c 64 74 65  |lure.3pods "ldte|
Oct 27 10:23:03 docker34-91 kubelet[24165]: 00000030  73 74 2d 34 62 63 37 39  32 32 63 32 35 2d 32 32  |st-4bc7922c25-22|
Oct 27 10:23:03 docker34-91 kubelet[24165]: 00000040  33 38 31 35 34 35 30 38  2d 78 74 39 34 78 22 20  |38154508-xt94x" |
Oct 27 10:23:03 docker34-91 kubelet[24165]: 00000050  6e 6f 74 20 66 6f 75 6e  64 22 08 4e 6f 74 46 6f  |not found".NotFo|
Oct 27 10:23:03 docker34-91 kubelet[24165]: 00000060  75 6e 64 2a 2e 0a 22 6c  64 74 65 73 74 2d 34 62  |und*.."ldtest-4b|
Oct 27 10:23:03 docker34-91 kubelet[24165]: 00000070  63 37 39 32 32 63 32 35  2d 32 32 33 38 31 35 34  |c7922c25-2238154|
Oct 27 10:23:03 docker34-91 kubelet[24165]: 00000080  35 30 38 2d 78 74 39 34  78 12 00 1a 04 70 6f 64  |508-xt94x....pod|
Oct 27 10:23:03 docker34-91 kubelet[24165]: 00000090  73 28 00 30 94 03 1a 00  22 00                    |s(.0....".|
Oct 27 10:23:03 docker34-91 kubelet[24165]: I1027 10:23:03.003411   24165 status_manager.go:425] Pod "ldtest-4bc7922c25-2238154508-xt94x" (2727277f-bab3-11e7-92f6-3497f60062c3) does not exist on the server
Oct 27 10:23:03 docker34-91 kubelet[24165]: I1027 10:23:03.003423   24165 status_manager.go:410] Status Manager: syncPod in syncbatch. pod UID: "43dd5201-bab4-11e7-92f6-3497f60062c3"
Oct 27 10:23:03 docker34-91 kubelet[24165]: I1027 10:23:03.003482   24165 round_trippers.go:398] curl -k -v -XGET  -H "Accept: application/vnd.kubernetes.protobuf, */*" -H "User-Agent: kubelet/v1.6.4 (linux/amd64) kubernetes/d6f4332" http://172.23.48.211:8080/api/v1/namespaces/ldtest-005/pods/ldtest-g02c441308-3753936377-d6q69
Oct 27 10:23:03 docker34-91 kubelet[24165]: I1027 10:23:03.004051   24165 round_trippers.go:417] GET http://172.23.48.211:8080/api/v1/namespaces/ldtest-005/pods/ldtest-g02c441308-3753936377-d6q69 404 Not Found in 0 milliseconds
Oct 27 10:23:03 docker34-91 kubelet[24165]: I1027 10:23:03.004059   24165 round_trippers.go:423] Response Headers:
Oct 27 10:23:03 docker34-91 kubelet[24165]: I1027 10:23:03.004062   24165 round_trippers.go:426]     Content-Type: application/vnd.kubernetes.protobuf
Oct 27 10:23:03 docker34-91 kubelet[24165]: I1027 10:23:03.004066   24165 round_trippers.go:426]     Date: Fri, 27 Oct 2017 02:23:03 GMT
Oct 27 10:23:03 docker34-91 kubelet[24165]: I1027 10:23:03.004069   24165 round_trippers.go:426]     Content-Length: 154
Oct 27 10:23:03 docker34-91 kubelet[24165]: I1027 10:23:03.004115   24165 request.go:989] Response Body:
Oct 27 10:23:03 docker34-91 kubelet[24165]: 00000000  6b 38 73 00 0a 0c 0a 02  76 31 12 06 53 74 61 74  |k8s.....v1..Stat|
Oct 27 10:23:03 docker34-91 kubelet[24165]: 00000010  75 73 12 81 01 0a 04 0a  00 12 00 12 07 46 61 69  |us...........Fai|
Oct 27 10:23:03 docker34-91 kubelet[24165]: 00000020  6c 75 72 65 1a 33 70 6f  64 73 20 22 6c 64 74 65  |lure.3pods "ldte|
Oct 27 10:23:03 docker34-91 kubelet[24165]: 00000030  73 74 2d 67 30 32 63 34  34 31 33 30 38 2d 33 37  |st-g02c441308-37|
Oct 27 10:23:03 docker34-91 kubelet[24165]: 00000040  35 33 39 33 36 33 37 37  2d 64 36 71 36 39 22 20  |53936377-d6q69" |
Oct 27 10:23:03 docker34-91 kubelet[24165]: 00000050  6e 6f 74 20 66 6f 75 6e  64 22 08 4e 6f 74 46 6f  |not found".NotFo|
Oct 27 10:23:03 docker34-91 kubelet[24165]: 00000060  75 6e 64 2a 2e 0a 22 6c  64 74 65 73 74 2d 67 30  |und*.."ldtest-g0|
Oct 27 10:23:03 docker34-91 kubelet[24165]: 00000070  32 63 34 34 31 33 30 38  2d 33 37 35 33 39 33 36  |2c441308-3753936|
Oct 27 10:23:03 docker34-91 kubelet[24165]: 00000080  33 37 37 2d 64 36 71 36  39 12 00 1a 04 70 6f 64  |377-d6q69....pod|
Oct 27 10:23:03 docker34-91 kubelet[24165]: 00000090  73 28 00 30 94 03 1a 00  22 00                    |s(.0....".|
Oct 27 10:23:03 docker34-91 kubelet[24165]: I1027 10:23:03.004142   24165 status_manager.go:425] Pod "ldtest-g02c441308-3753936377-d6q69" (43dd5201-bab4-11e7-92f6-3497f60062c3) does not exist on the server
Oct 27 10:23:03 docker34-91 kubelet[24165]: I1027 10:23:03.004148   24165 status_manager.go:410] Status Manager: syncPod in syncbatch. pod UID: "8fd9d66f-bab7-11e7-92f6-3497f60062c3"
Oct 27 10:23:03 docker34-91 kubelet[24165]: I1027 10:23:03.004195   24165 round_trippers.go:398] curl -k -v -XGET  -H "Accept: application/vnd.kubernetes.protobuf, */*" -H "User-Agent: kubelet/v1.6.4 (linux/amd64) kubernetes/d6f4332" http://172.23.48.211:8080/api/v1/namespaces/ldtest-005/pods/ldtest-cf2eg79b08-3660220702-x0j2j
Oct 27 10:23:03 docker34-91 kubelet[24165]: I1027 10:23:03.004752   24165 round_trippers.go:417] GET http://172.23.48.211:8080/api/v1/namespaces/ldtest-005/pods/ldtest-cf2eg79b08-3660220702-x0j2j 404 Not Found in 0 milliseconds
Oct 27 10:23:03 docker34-91 kubelet[24165]: I1027 10:23:03.004761   24165 round_trippers.go:423] Response Headers:
Oct 27 10:23:03 docker34-91 kubelet[24165]: I1027 10:23:03.004765   24165 round_trippers.go:426]     Date: Fri, 27 Oct 2017 02:23:03 GMT
Oct 27 10:23:03 docker34-91 kubelet[24165]: I1027 10:23:03.004769   24165 round_trippers.go:426]     Content-Length: 154
Oct 27 10:23:03 docker34-91 kubelet[24165]: I1027 10:23:03.004773   24165 round_trippers.go:426]     Content-Type: application/vnd.kubernetes.protobuf
Oct 27 10:23:03 docker34-91 kubelet[24165]: I1027 10:23:03.004812   24165 request.go:989] Response Body:
Oct 27 10:23:03 docker34-91 kubelet[24165]: 00000000  6b 38 73 00 0a 0c 0a 02  76 31 12 06 53 74 61 74  |k8s.....v1..Stat|
Oct 27 10:23:03 docker34-91 kubelet[24165]: 00000010  75 73 12 81 01 0a 04 0a  00 12 00 12 07 46 61 69  |us...........Fai|
Oct 27 10:23:03 docker34-91 kubelet[24165]: 00000020  6c 75 72 65 1a 33 70 6f  64 73 20 22 6c 64 74 65  |lure.3pods "ldte|
Oct 27 10:23:03 docker34-91 kubelet[24165]: 00000030  73 74 2d 63 66 32 65 67  37 39 62 30 38 2d 33 36  |st-cf2eg79b08-36|
Oct 27 10:23:03 docker34-91 kubelet[24165]: 00000040  36 30 32 32 30 37 30 32  2d 78 30 6a 32 6a 22 20  |60220702-x0j2j" |
Oct 27 10:23:03 docker34-91 kubelet[24165]: 00000050  6e 6f 74 20 66 6f 75 6e  64 22 08 4e 6f 74 46 6f  |not found".NotFo|
Oct 27 10:23:03 docker34-91 kubelet[24165]: 00000060  75 6e 64 2a 2e 0a 22 6c  64 74 65 73 74 2d 63 66  |und*.."ldtest-cf|
Oct 27 10:23:03 docker34-91 kubelet[24165]: 00000070  32 65 67 37 39 62 30 38  2d 33 36 36 30 32 32 30  |2eg79b08-3660220|
Oct 27 10:23:03 docker34-91 kubelet[24165]: 00000080  37 30 32 2d 78 30 6a 32  6a 12 00 1a 04 70 6f 64  |702-x0j2j....pod|
Oct 27 10:23:03 docker34-91 kubelet[24165]: 00000090  73 28 00 30 94 03 1a 00  22 00                    |s(.0....".|
Oct 27 10:23:03 docker34-91 kubelet[24165]: I1027 10:23:03.004841   24165 status_manager.go:425] Pod "ldtest-cf2eg79b08-3660220702-x0j2j" (8fd9d66f-bab7-11e7-92f6-3497f60062c3) does not exist on the server
Oct 27 10:23:03 docker34-91 kubelet[24165]: I1027 10:23:03.004853   24165 status_manager.go:410] Status Manager: syncPod in syncbatch. pod UID: "eb5a5f4a-baba-11e7-92f6-3497f60062c3"
Oct 27 10:23:03 docker34-91 kubelet[24165]: I1027 10:23:03.004921   24165 round_trippers.go:398] curl -k -v -XGET  -H "Accept: application/vnd.kubernetes.protobuf, */*" -H "User-Agent: kubelet/v1.6.4 (linux/amd64) kubernetes/d6f4332" http://172.23.48.211:8080/api/v1/namespaces/ldtest-005/pods/ldtest-9b47680d12-2536408624-jhp18
Oct 27 10:23:03 docker34-91 kubelet[24165]: I1027 10:23:03.005436   24165 round_trippers.go:417] GET http://172.23.48.211:8080/api/v1/namespaces/ldtest-005/pods/ldtest-9b47680d12-2536408624-jhp18 404 Not Found in 0 milliseconds
Oct 27 10:23:03 docker34-91 kubelet[24165]: I1027 10:23:03.005446   24165 round_trippers.go:423] Response Headers:
Oct 27 10:23:03 docker34-91 kubelet[24165]: I1027 10:23:03.005450   24165 round_trippers.go:426]     Content-Type: application/vnd.kubernetes.protobuf
Oct 27 10:23:03 docker34-91 kubelet[24165]: I1027 10:23:03.005454   24165 round_trippers.go:426]     Date: Fri, 27 Oct 2017 02:23:03 GMT
Oct 27 10:23:03 docker34-91 kubelet[24165]: I1027 10:23:03.005457   24165 round_trippers.go:426]     Content-Length: 154
Oct 27 10:23:03 docker34-91 kubelet[24165]: I1027 10:23:03.005499   24165 request.go:989] Response Body:
Oct 27 10:23:03 docker34-91 kubelet[24165]: 00000000  6b 38 73 00 0a 0c 0a 02  76 31 12 06 53 74 61 74  |k8s.....v1..Stat|
Oct 27 10:23:03 docker34-91 kubelet[24165]: 00000010  75 73 12 81 01 0a 04 0a  00 12 00 12 07 46 61 69  |us...........Fai|
Oct 27 10:23:03 docker34-91 kubelet[24165]: 00000020  6c 75 72 65 1a 33 70 6f  64 73 20 22 6c 64 74 65  |lure.3pods "ldte|
Oct 27 10:23:03 docker34-91 kubelet[24165]: 00000030  73 74 2d 39 62 34 37 36  38 30 64 31 32 2d 32 35  |st-9b47680d12-25|
Oct 27 10:23:03 docker34-91 kubelet[24165]: 00000040  33 36 34 30 38 36 32 34  2d 6a 68 70 31 38 22 20  |36408624-jhp18" |
Oct 27 10:23:03 docker34-91 kubelet[24165]: 00000050  6e 6f 74 20 66 6f 75 6e  64 22 08 4e 6f 74 46 6f  |not found".NotFo|
Oct 27 10:23:03 docker34-91 kubelet[24165]: 00000060  75 6e 64 2a 2e 0a 22 6c  64 74 65 73 74 2d 39 62  |und*.."ldtest-9b|
Oct 27 10:23:03 docker34-91 kubelet[24165]: 00000070  34 37 36 38 30 64 31 32  2d 32 35 33 36 34 30 38  |47680d12-2536408|
Oct 27 10:23:03 docker34-91 kubelet[24165]: 00000080  36 32 34 2d 6a 68 70 31  38 12 00 1a 04 70 6f 64  |624-jhp18....pod|
Oct 27 10:23:03 docker34-91 kubelet[24165]: 00000090  73 28 00 30 94 03 1a 00  22 00                    |s(.0....".|
Oct 27 10:23:03 docker34-91 kubelet[24165]: I1027 10:23:03.005526   24165 status_manager.go:425] Pod "ldtest-9b47680d12-2536408624-jhp18" (eb5a5f4a-baba-11e7-92f6-3497f60062c3) does not exist on the server
Oct 27 10:23:03 docker34-91 kubelet[24165]: I1027 10:23:03.005533   24165 status_manager.go:410] Status Manager: syncPod in syncbatch. pod UID: "2db95639-bab5-11e7-92f6-3497f60062c3"
Oct 27 10:23:03 docker34-91 kubelet[24165]: I1027 10:23:03.005588   24165 round_trippers.go:398] curl -k -v -XGET  -H "Accept: application/vnd.kubernetes.protobuf, */*" -H "User-Agent: kubelet/v1.6.4 (linux/amd64) kubernetes/d6f4332" http://172.23.48.211:8080/api/v1/namespaces/ldtest-005/pods/ldtest-5f8ba1eag0-2191624653-dm374
Oct 27 10:23:03 docker34-91 kubelet[24165]: I1027 10:23:03.006150   24165 round_trippers.go:417] GET http://172.23.48.211:8080/api/v1/namespaces/ldtest-005/pods/ldtest-5f8ba1eag0-2191624653-dm374 404 Not Found in 0 milliseconds
Oct 27 10:23:03 docker34-91 kubelet[24165]: I1027 10:23:03.006176   24165 round_trippers.go:423] Response Headers:
Oct 27 10:23:03 docker34-91 kubelet[24165]: I1027 10:23:03.006182   24165 round_trippers.go:426]     Date: Fri, 27 Oct 2017 02:23:03 GMT
Oct 27 10:23:03 docker34-91 kubelet[24165]: I1027 10:23:03.006189   24165 round_trippers.go:426]     Content-Length: 154
Oct 27 10:23:03 docker34-91 kubelet[24165]: I1027 10:23:03.006195   24165 round_trippers.go:426]     Content-Type: application/vnd.kubernetes.protobuf
Oct 27 10:23:03 docker34-91 kubelet[24165]: I1027 10:23:03.006251   24165 request.go:989] Response Body:
Oct 27 10:23:03 docker34-91 kubelet[24165]: 00000000  6b 38 73 00 0a 0c 0a 02  76 31 12 06 53 74 61 74  |k8s.....v1..Stat|
Oct 27 10:23:03 docker34-91 kubelet[24165]: 00000010  75 73 12 81 01 0a 04 0a  00 12 00 12 07 46 61 69  |us...........Fai|
Oct 27 10:23:03 docker34-91 kubelet[24165]: 00000020  6c 75 72 65 1a 33 70 6f  64 73 20 22 6c 64 74 65  |lure.3pods "ldte|
Oct 27 10:23:03 docker34-91 kubelet[24165]: 00000030  73 74 2d 35 66 38 62 61  31 65 61 67 30 2d 32 31  |st-5f8ba1eag0-21|
Oct 27 10:23:03 docker34-91 kubelet[24165]: 00000040  39 31 36 32 34 36 35 33  2d 64 6d 33 37 34 22 20  |91624653-dm374" |
Oct 27 10:23:03 docker34-91 kubelet[24165]: 00000050  6e 6f 74 20 66 6f 75 6e  64 22 08 4e 6f 74 46 6f  |not found".NotFo|
Oct 27 10:23:03 docker34-91 kubelet[24165]: 00000060  75 6e 64 2a 2e 0a 22 6c  64 74 65 73 74 2d 35 66  |und*.."ldtest-5f|
Oct 27 10:23:03 docker34-91 kubelet[24165]: 00000070  38 62 61 31 65 61 67 30  2d 32 31 39 31 36 32 34  |8ba1eag0-2191624|
Oct 27 10:23:03 docker34-91 kubelet[24165]: 00000080  36 35 33 2d 64 6d 33 37  34 12 00 1a 04 70 6f 64  |653-dm374....pod|
Oct 27 10:23:03 docker34-91 kubelet[24165]: 00000090  73 28 00 30 94 03 1a 00  22 00                    |s(.0....".|
Oct 27 10:23:03 docker34-91 kubelet[24165]: I1027 10:23:03.006297   24165 status_manager.go:425] Pod "ldtest-5f8ba1eag0-2191624653-dm374" (2db95639-bab5-11e7-92f6-3497f60062c3) does not exist on the server
Oct 27 10:23:03 docker34-91 kubelet[24165]: I1027 10:23:03.006330   24165 status_manager.go:410] Status Manager: syncPod in syncbatch. pod UID: "ecf58d7f-bab2-11e7-92f6-3497f60062c3"
Oct 27 10:23:03 docker34-91 kubelet[24165]: I1027 10:23:03.006421   24165 round_trippers.go:398] curl -k -v -XGET  -H "Accept: application/vnd.kubernetes.protobuf, */*" -H "User-Agent: kubelet/v1.6.4 (linux/amd64) kubernetes/d6f4332" http://172.23.48.211:8080/api/v1/namespaces/ldtest-005/pods/ldtest-0fe4761ce1-763135991-2gv5x
Oct 27 10:23:03 docker34-91 kubelet[24165]: I1027 10:23:03.006983   24165 round_trippers.go:417] GET http://172.23.48.211:8080/api/v1/namespaces/ldtest-005/pods/ldtest-0fe4761ce1-763135991-2gv5x 404 Not Found in 0 milliseconds
Oct 27 10:23:03 docker34-91 kubelet[24165]: I1027 10:23:03.006995   24165 round_trippers.go:423] Response Headers:
Oct 27 10:23:03 docker34-91 kubelet[24165]: I1027 10:23:03.007001   24165 round_trippers.go:426]     Content-Type: application/vnd.kubernetes.protobuf
Oct 27 10:23:03 docker34-91 kubelet[24165]: I1027 10:23:03.007007   24165 round_trippers.go:426]     Date: Fri, 27 Oct 2017 02:23:03 GMT
Oct 27 10:23:03 docker34-91 kubelet[24165]: I1027 10:23:03.007014   24165 round_trippers.go:426]     Content-Length: 151
Oct 27 10:23:03 docker34-91 kubelet[24165]: I1027 10:23:03.007064   24165 request.go:989] Response Body:
Oct 27 10:23:03 docker34-91 kubelet[24165]: 00000000  6b 38 73 00 0a 0c 0a 02  76 31 12 06 53 74 61 74  |k8s.....v1..Stat|
Oct 27 10:23:03 docker34-91 kubelet[24165]: 00000010  75 73 12 7f 0a 04 0a 00  12 00 12 07 46 61 69 6c  |us..........Fail|
Oct 27 10:23:03 docker34-91 kubelet[24165]: 00000020  75 72 65 1a 32 70 6f 64  73 20 22 6c 64 74 65 73  |ure.2pods "ldtes|
Oct 27 10:23:03 docker34-91 kubelet[24165]: 00000030  74 2d 30 66 65 34 37 36  31 63 65 31 2d 37 36 33  |t-0fe4761ce1-763|
Oct 27 10:23:03 docker34-91 kubelet[24165]: 00000040  31 33 35 39 39 31 2d 32  67 76 35 78 22 20 6e 6f  |135991-2gv5x" no|
Oct 27 10:23:03 docker34-91 kubelet[24165]: 00000050  74 20 66 6f 75 6e 64 22  08 4e 6f 74 46 6f 75 6e  |t found".NotFoun|
Oct 27 10:23:03 docker34-91 kubelet[24165]: 00000060  64 2a 2d 0a 21 6c 64 74  65 73 74 2d 30 66 65 34  |d*-.!ldtest-0fe4|
Oct 27 10:23:03 docker34-91 kubelet[24165]: 00000070  37 36 31 63 65 31 2d 37  36 33 31 33 35 39 39 31  |761ce1-763135991|
Oct 27 10:23:03 docker34-91 kubelet[24165]: 00000080  2d 32 67 76 35 78 12 00  1a 04 70 6f 64 73 28 00  |-2gv5x....pods(.|
Oct 27 10:23:03 docker34-91 kubelet[24165]: 00000090  30 94 03 1a 00 22 00                              |0....".|
Oct 27 10:23:03 docker34-91 kubelet[24165]: I1027 10:23:03.007106   24165 status_manager.go:425] Pod "ldtest-0fe4761ce1-763135991-2gv5x" (ecf58d7f-bab2-11e7-92f6-3497f60062c3) does not exist on the server
Oct 27 10:23:03 docker34-91 kubelet[24165]: I1027 10:23:03.077334   24165 config.go:101] Looking for [api file], have seen map[file:{} api:{}]
Oct 27 10:23:03 docker34-91 kubelet[24165]: I1027 10:23:03.177546   24165 config.go:101] Looking for [api file], have seen map[file:{} api:{}]
Oct 27 10:23:03 docker34-91 kubelet[24165]: I1027 10:23:03.277737   24165 config.go:101] Looking for [api file], have seen map[file:{} api:{}]
Oct 27 10:23:03 docker34-91 kubelet[24165]: I1027 10:23:03.377939   24165 config.go:101] Looking for [api file], have seen map[file:{} api:{}]
Oct 27 10:23:03 docker34-91 kubelet[24165]: I1027 10:23:03.478169   24165 config.go:101] Looking for [api file], have seen map[file:{} api:{}]
Oct 27 10:23:03 docker34-91 kubelet[24165]: I1027 10:23:03.578369   24165 config.go:101] Looking for [api file], have seen map[file:{} api:{}]
Oct 27 10:23:03 docker34-91 kubelet[24165]: I1027 10:23:03.603649   24165 eviction_manager.go:197] eviction manager: synchronize housekeeping
Oct 27 10:23:03 docker34-91 kubelet[24165]: I1027 10:23:03.678573   24165 config.go:101] Looking for [api file], have seen map[file:{} api:{}]
Oct 27 10:23:03 docker34-91 kubelet[24165]: I1027 10:23:03.682080   24165 summary.go:389] Missing default interface "eth0" for node:172.23.34.91
Oct 27 10:23:03 docker34-91 kubelet[24165]: I1027 10:23:03.682132   24165 summary.go:389] Missing default interface "eth0" for pod:kube-system_kube-proxy-qcft5
Oct 27 10:23:03 docker34-91 kubelet[24165]: I1027 10:23:03.682176   24165 helpers.go:744] eviction manager: observations: signal=imagefs.available, available: 515801344Ki, capacity: 511750Mi, time: 2017-10-27 10:22:56.499173632 +0800 CST
Oct 27 10:23:03 docker34-91 kubelet[24165]: I1027 10:23:03.682197   24165 helpers.go:744] eviction manager: observations: signal=imagefs.inodesFree, available: 523222251, capacity: 500Mi, time: 2017-10-27 10:22:56.499173632 +0800 CST
Oct 27 10:23:03 docker34-91 kubelet[24165]: I1027 10:23:03.682203   24165 helpers.go:746] eviction manager: observations: signal=allocatableMemory.available, available: 65544340Ki, capacity: 65581868Ki
Oct 27 10:23:03 docker34-91 kubelet[24165]: I1027 10:23:03.682207   24165 helpers.go:744] eviction manager: observations: signal=memory.available, available: 57973412Ki, capacity: 65684268Ki, time: 2017-10-27 10:22:56.499173632 +0800 CST
Oct 27 10:23:03 docker34-91 kubelet[24165]: I1027 10:23:03.682213   24165 helpers.go:744] eviction manager: observations: signal=nodefs.available, available: 99175128Ki, capacity: 102350Mi, time: 2017-10-27 10:22:56.499173632 +0800 CST
Oct 27 10:23:03 docker34-91 kubelet[24165]: I1027 10:23:03.682218   24165 helpers.go:744] eviction manager: observations: signal=nodefs.inodesFree, available: 104818019, capacity: 100Mi, time: 2017-10-27 10:22:56.499173632 +0800 CST
Oct 27 10:23:03 docker34-91 kubelet[24165]: I1027 10:23:03.682233   24165 eviction_manager.go:292] eviction manager: no resources are starved
Oct 27 10:23:03 docker34-91 kubelet[24165]: I1027 10:23:03.778792   24165 config.go:101] Looking for [api file], have seen map[file:{} api:{}]
Oct 27 10:23:03 docker34-91 kubelet[24165]: I1027 10:23:03.879040   24165 config.go:101] Looking for [api file], have seen map[file:{} api:{}]
Oct 27 10:23:03 docker34-91 kubelet[24165]: I1027 10:23:03.979304   24165 config.go:101] Looking for [api file], have seen map[file:{} api:{}]
Oct 27 10:23:04 docker34-91 kubelet[24165]: I1027 10:23:04.079534   24165 config.go:101] Looking for [api file], have seen map[file:{} api:{}]
Oct 27 10:23:04 docker34-91 kubelet[24165]: I1027 10:23:04.179753   24165 config.go:101] Looking for [api file], have seen map[api:{} file:{}]
Oct 27 10:23:04 docker34-91 kubelet[24165]: I1027 10:23:04.280026   24165 config.go:101] Looking for [api file], have seen map[api:{} file:{}]
Oct 27 10:23:04 docker34-91 kubelet[24165]: I1027 10:23:04.380246   24165 config.go:101] Looking for [api file], have seen map[file:{} api:{}]
Oct 27 10:23:04 docker34-91 kubelet[24165]: I1027 10:23:04.480450   24165 config.go:101] Looking for [api file], have seen map[file:{} api:{}]
Oct 27 10:23:04 docker34-91 kubelet[24165]: I1027 10:23:04.580695   24165 config.go:101] Looking for [api file], have seen map[file:{} api:{}]
Oct 27 10:23:04 docker34-91 kubelet[24165]: I1027 10:23:04.680957   24165 config.go:101] Looking for [api file], have seen map[file:{} api:{}]
Oct 27 10:23:04 docker34-91 kubelet[24165]: I1027 10:23:04.781224   24165 config.go:101] Looking for [api file], have seen map[file:{} api:{}]
Oct 27 10:23:04 docker34-91 kubelet[24165]: I1027 10:23:04.881418   24165 config.go:101] Looking for [api file], have seen map[file:{} api:{}]
Oct 27 10:23:04 docker34-91 kubelet[24165]: I1027 10:23:04.981643   24165 config.go:101] Looking for [api file], have seen map[file:{} api:{}]
Oct 27 10:23:05 docker34-91 kubelet[24165]: I1027 10:23:05.081882   24165 config.go:101] Looking for [api file], have seen map[file:{} api:{}]
Oct 27 10:23:05 docker34-91 kubelet[24165]: I1027 10:23:05.182810   24165 config.go:101] Looking for [api file], have seen map[file:{} api:{}]
Oct 27 10:23:05 docker34-91 kubelet[24165]: I1027 10:23:05.283410   24165 config.go:101] Looking for [api file], have seen map[file:{} api:{}]
Oct 27 10:23:05 docker34-91 kubelet[24165]: I1027 10:23:05.383626   24165 config.go:101] Looking for [api file], have seen map[file:{} api:{}]
Oct 27 10:23:05 docker34-91 kubelet[24165]: I1027 10:23:05.483942   24165 config.go:101] Looking for [api file], have seen map[file:{} api:{}]
Oct 27 10:23:05 docker34-91 kubelet[24165]: I1027 10:23:05.584211   24165 config.go:101] Looking for [api file], have seen map[file:{} api:{}]
Oct 27 10:23:05 docker34-91 kubelet[24165]: I1027 10:23:05.684460   24165 config.go:101] Looking for [api file], have seen map[file:{} api:{}]
Oct 27 10:23:05 docker34-91 kubelet[24165]: I1027 10:23:05.784699   24165 config.go:101] Looking for [api file], have seen map[file:{} api:{}]
Oct 27 10:23:05 docker34-91 kubelet[24165]: I1027 10:23:05.884949   24165 config.go:101] Looking for [api file], have seen map[file:{} api:{}]
Oct 27 10:23:05 docker34-91 kubelet[24165]: I1027 10:23:05.960855   24165 factory.go:115] Factory "docker" was unable to handle container "/system.slice/data-docker-overlay-c0d3c4b3834cfe9f12cd5c35345cab9c8e71bb64c689c8aea7a458c119a5a54e-merged.mount"
Oct 27 10:23:05 docker34-91 kubelet[24165]: I1027 10:23:05.960885   24165 factory.go:108] Factory "systemd" can handle container "/system.slice/data-docker-overlay-c0d3c4b3834cfe9f12cd5c35345cab9c8e71bb64c689c8aea7a458c119a5a54e-merged.mount", but ignoring.
Oct 27 10:23:05 docker34-91 kubelet[24165]: I1027 10:23:05.960906   24165 manager.go:867] ignoring container "/system.slice/data-docker-overlay-c0d3c4b3834cfe9f12cd5c35345cab9c8e71bb64c689c8aea7a458c119a5a54e-merged.mount"
Oct 27 10:23:05 docker34-91 kubelet[24165]: I1027 10:23:05.960912   24165 factory.go:115] Factory "docker" was unable to handle container "/system.slice/data-docker-overlay-ce9656ff9d3cd03baaf93e42d0874377fa37bfde6c9353b3ba954c90bf4332f3-merged.mount"
Oct 27 10:23:05 docker34-91 kubelet[24165]: I1027 10:23:05.960919   24165 factory.go:108] Factory "systemd" can handle container "/system.slice/data-docker-overlay-ce9656ff9d3cd03baaf93e42d0874377fa37bfde6c9353b3ba954c90bf4332f3-merged.mount", but ignoring.
Oct 27 10:23:05 docker34-91 kubelet[24165]: I1027 10:23:05.960926   24165 manager.go:867] ignoring container "/system.slice/data-docker-overlay-ce9656ff9d3cd03baaf93e42d0874377fa37bfde6c9353b3ba954c90bf4332f3-merged.mount"
Oct 27 10:23:05 docker34-91 kubelet[24165]: I1027 10:23:05.960931   24165 factory.go:115] Factory "docker" was unable to handle container "/system.slice/data-docker-overlay-b3600c0fe81445773b9241c5d1da8b1f97612d0a235f8b32139478a5717f79e1-merged.mount"
Oct 27 10:23:05 docker34-91 kubelet[24165]: I1027 10:23:05.960937   24165 factory.go:108] Factory "systemd" can handle container "/system.slice/data-docker-overlay-b3600c0fe81445773b9241c5d1da8b1f97612d0a235f8b32139478a5717f79e1-merged.mount", but ignoring.
Oct 27 10:23:05 docker34-91 kubelet[24165]: I1027 10:23:05.960944   24165 manager.go:867] ignoring container "/system.slice/data-docker-overlay-b3600c0fe81445773b9241c5d1da8b1f97612d0a235f8b32139478a5717f79e1-merged.mount"
Oct 27 10:23:05 docker34-91 kubelet[24165]: I1027 10:23:05.960949   24165 factory.go:115] Factory "docker" was unable to handle container "/system.slice/data-docker-overlay-ed2fe0d57c56cf6b051e1bda1ca0185ceef4756b1a8f9af4c19f4e512bcc60f4-merged.mount"
Oct 27 10:23:05 docker34-91 kubelet[24165]: I1027 10:23:05.960955   24165 factory.go:108] Factory "systemd" can handle container "/system.slice/data-docker-overlay-ed2fe0d57c56cf6b051e1bda1ca0185ceef4756b1a8f9af4c19f4e512bcc60f4-merged.mount", but ignoring.
Oct 27 10:23:05 docker34-91 kubelet[24165]: I1027 10:23:05.960979   24165 manager.go:867] ignoring container "/system.slice/data-docker-overlay-ed2fe0d57c56cf6b051e1bda1ca0185ceef4756b1a8f9af4c19f4e512bcc60f4-merged.mount"
Oct 27 10:23:05 docker34-91 kubelet[24165]: I1027 10:23:05.960984   24165 factory.go:115] Factory "docker" was unable to handle container "/system.slice/data-docker-overlay-0ba6483a0117c539493cd269be9f87d31d1d61aa813e7e0381c5f5d8b0623275-merged.mount"
Oct 27 10:23:05 docker34-91 kubelet[24165]: I1027 10:23:05.960990   24165 factory.go:108] Factory "systemd" can handle container "/system.slice/data-docker-overlay-0ba6483a0117c539493cd269be9f87d31d1d61aa813e7e0381c5f5d8b0623275-merged.mount", but ignoring.
Oct 27 10:23:05 docker34-91 kubelet[24165]: I1027 10:23:05.960997   24165 manager.go:867] ignoring container "/system.slice/data-docker-overlay-0ba6483a0117c539493cd269be9f87d31d1d61aa813e7e0381c5f5d8b0623275-merged.mount"
Hit similar issue:
Oct 28 09:15:38 ip-10-72-17-119.us-west-2.compute.internal kubelet[3299]: E1028 09:15:38.711430    3299 pod_workers.go:182] Error syncing pod 7d3b94f3-afa7-11e7-aaec-06936c368d26 ("pickup-566929041-bn8t9_staging(7d3b94f3-afa7-11e7-aaec-06936c368d26)"), skipping: rpc error: code = 4 desc = context deadline exceeded
Oct 28 09:15:51 ip-10-72-17-119.us-west-2.compute.internal kubelet[3299]: E1028 09:15:51.439135    3299 kuberuntime_manager.go:843] PodSandboxStatus of sandbox "9c1c1f2d4a9d277a41a97593c330f41e00ca12f3ad858c19f61fd155d18d795e" for pod "pickup-566929041-bn8t9_staging(7d3b94f3-afa7-11e7-aaec-06936c368d26)" error: rpc error: code = 4 desc = context deadline exceeded
Oct 28 09:15:51 ip-10-72-17-119.us-west-2.compute.internal kubelet[3299]: E1028 09:15:51.439188    3299 generic.go:241] PLEG: Ignoring events for pod pickup-566929041-bn8t9/staging: rpc error: code = 4 desc = context deadline exceeded
Oct 28 09:15:51 ip-10-72-17-119.us-west-2.compute.internal kubelet[3299]: E1028 09:15:51.711168    3299 pod_workers.go:182] Error syncing pod 7d3b94f3-afa7-11e7-aaec-06936c368d26 ("pickup-566929041-bn8t9_staging(7d3b94f3-afa7-11e7-aaec-06936c368d26)"), skipping: rpc error: code = 4 desc = context deadline exceeded
Oct 28 09:16:03 ip-10-72-17-119.us-west-2.compute.internal kubelet[3299]: E1028 09:16:03.711164    3299 pod_workers.go:182] Error syncing pod 7d3b94f3-afa7-11e7-aaec-06936c368d26 ("pickup-566929041-bn8t9_staging(7d3b94f3-afa7-11e7-aaec-06936c368d26)"), skipping: rpc error: code = 4 desc = context deadline exceeded
Oct 28 09:16:18 ip-10-72-17-119.us-west-2.compute.internal kubelet[3299]: E1028 09:16:18.715381    3299 pod_workers.go:182] Error syncing pod 7d3b94f3-afa7-11e7-aaec-06936c368d26 ("pickup-566929041-bn8t9_staging(7d3b94f3-afa7-11e7-aaec-06936c368d26)"), skipping: rpc error: code = 4 desc = context deadline exceeded
Oct 28 09:16:33 ip-10-72-17-119.us-west-2.compute.internal kubelet[3299]: E1028 09:16:33.711198    3299 pod_workers.go:182] Error syncing pod 7d3b94f3-afa7-11e7-aaec-06936c368d26 ("pickup-566929041-bn8t9_staging(7d3b94f3-afa7-11e7-aaec-06936c368d26)"), skipping: rpc error: code = 4 desc = context deadline exceeded
Oct 28 09:16:46 ip-10-72-17-119.us-west-2.compute.internal kubelet[3299]: E1028 09:16:46.712983    3299 pod_workers.go:182] Error syncing pod 7d3b94f3-afa7-11e7-aaec-06936c368d26 ("pickup-566929041-bn8t9_staging(7d3b94f3-afa7-11e7-aaec-06936c368d26)"), skipping: rpc error: code = 4 desc = context deadline exceeded
Oct 28 09:16:51 ip-10-72-17-119.us-west-2.compute.internal kubelet[3299]: I1028 09:16:51.711142    3299 kubelet.go:1820] skipping pod synchronization - [PLEG is not healthy: pleg was last seen active 3m0.31269053s ago; threshold is 3m0s]
Oct 28 09:16:56 ip-10-72-17-119.us-west-2.compute.internal kubelet[3299]: I1028 09:16:56.711341    3299 kubelet.go:1820] skipping pod synchronization - [PLEG is not healthy: pleg was last seen active 3m5.312886434s ago; threshold is 3m0s]
Oct 28 09:17:01 ip-10-72-17-119.us-west-2.compute.internal kubelet[3299]: I1028 09:17:01.351771    3299 kubelet_node_status.go:734] Node became not ready: {Type:Ready Status:False LastHeartbeatTime:2017-10-28 09:17:01.35173325 +0000 UTC LastTransitionTime:2017-10-28 09:17:01.35173325 +0000 UTC Reason:KubeletNotReady Message:PLEG is not healthy: pleg was last seen active 3m9.95330596s ago; threshold is 3m0s}
Oct 28 09:17:01 ip-10-72-17-119.us-west-2.compute.internal kubelet[3299]: I1028 09:17:01.711552    3299 kubelet.go:1820] skipping pod synchronization - [PLEG is not healthy: pleg was last seen active 3m10.31309378s ago; threshold is 3m0s]
Oct 28 09:17:06 ip-10-72-17-119.us-west-2.compute.internal kubelet[3299]: I1028 09:17:06.711871    3299 kubelet.go:1820] skipping pod synchronization - [PLEG is not healthy: pleg was last seen active 3m15.313406671s ago; threshold is 3m0s]
Oct 28 09:17:11 ip-10-72-17-119.us-west-2.compute.internal kubelet[3299]: I1028 09:17:11.712162    3299 kubelet.go:1820] skipping pod synchronization - [PLEG is not healthy: pleg was last seen active 3m20.313691126s ago; threshold is 3m0s]
Oct 28 09:17:12 ip-10-72-17-119.us-west-2.compute.internal kubelet[3299]: 2017/10/28 09:17:12 transport: http2Server.HandleStreams failed to read frame: read unix /var/run/dockershim.sock->@: use of closed network connection
Oct 28 09:17:12 ip-10-72-17-119.us-west-2.compute.internal kubelet[3299]: 2017/10/28 09:17:12 transport: http2Client.notifyError got notified that the client transport was broken EOF.
Oct 28 09:17:12 ip-10-72-17-119.us-west-2.compute.internal kubelet[3299]: 2017/10/28 09:17:12 grpc: addrConn.resetTransport failed to create client transport: connection error: desc = "transport: dial unix /var/run/dockershim.sock: connect: no such file or directory"; Reconnecting to {/var/run/dockershim.sock <nil>}
Oct 28 09:17:12 ip-10-72-17-119.us-west-2.compute.internal kubelet[3299]: E1028 09:17:12.556535    3299 kuberuntime_manager.go:843] PodSandboxStatus of sandbox "9c1c1f2d4a9d277a41a97593c330f41e00ca12f3ad858c19f61fd155d18d795e" for pod "pickup-566929041-bn8t9_staging(7d3b94f3-afa7-11e7-aaec-06936c368d26)" error: rpc error: code = 13 desc = transport is closing
After these messages, kubelet went into restart loop.
Oct 28 09:17:12 ip-10-72-17-119.us-west-2.compute.internal systemd[1]: kube-kubelet.service: Main process exited, code=exited, status=1/FAILURE
Oct 28 09:18:42 ip-10-72-17-119.us-west-2.compute.internal systemd[1]: kube-kubelet.service: State 'stop-final-sigterm' timed out. Killing.
Oct 28 09:18:42 ip-10-72-17-119.us-west-2.compute.internal systemd[1]: kube-kubelet.service: Killing process 1661 (calico) with signal SIGKILL.
Oct 28 09:20:12 ip-10-72-17-119.us-west-2.compute.internal systemd[1]: kube-kubelet.service: Processes still around after final SIGKILL. Entering failed mode.
Oct 28 09:20:12 ip-10-72-17-119.us-west-2.compute.internal systemd[1]: Stopped Kubernetes Kubelet.
Oct 28 09:20:12 ip-10-72-17-119.us-west-2.compute.internal systemd[1]: kube-kubelet.service: Unit entered failed state.
Oct 28 09:20:12 ip-10-72-17-119.us-west-2.compute.internal systemd[1]: kube-kubelet.service: Failed with result 'exit-code'.
It seems to me a docker issue, as I see the last messages are:
Oct 28 09:17:12 ip-10-72-17-119.us-west-2.compute.internal kubelet[3299]: 2017/10/28 09:17:12 transport: http2Server.HandleStreams failed to read frame: read unix /var/run/dockershim.sock->@: use of closed network connection
Oct 28 09:17:12 ip-10-72-17-119.us-west-2.compute.internal kubelet[3299]: 2017/10/28 09:17:12 transport: http2Client.notifyError got notified that the client transport was broken EOF.
Oct 28 09:17:12 ip-10-72-17-119.us-west-2.compute.internal kubelet[3299]: 2017/10/28 09:17:12 grpc: addrConn.resetTransport failed to create client transport: connection error: desc = "transport: dial unix /var/run/dockershim.sock: connect: no such file or directory"; Reconnecting to {/var/run/dockershim.sock <nil>}
 zihaoyu
on 28 Oct 2017
zihaoyu
on 28 Oct 2017
The last messages are from the dockershim. Those logs would be super useful as well.
 rphillips
on 15 Nov 2017
rphillips
on 15 Nov 2017
Hello, Kubernetes 1.7.10, based on Kops @ AWS, with Calico & CoreOS.
We have the same PLEG issues
Ready False KubeletNotReady PLEG is not healthy: pleg was last seen active 3m29.396986143s ago; threshold is 3m0s
The only extra problem we have and I think is related - is that latetly especially on 1.7.8+ - when we do redeploys' e.g bring a new version of an app so the old replica set goes down a new one is spinned along with the pods, the Pods of the previous deployment ver/ do stay for ever in the 'Terminating' state.
Then I have to manually force kill them
 javapapo
on 18 Nov 2017
javapapo
on 18 Nov 2017
We have the same PLEG issues k8s 1.8.1
 tanhui2333
on 21 Nov 2017
tanhui2333
on 21 Nov 2017
+1
1.6.9
with docker 1.12.6
 zhangxiaoyu-zidif
on 29 Nov 2017
zhangxiaoyu-zidif
on 29 Nov 2017
+1
1.8.2
 dElogics
on 29 Nov 2017
dElogics
on 29 Nov 2017
+1
1.6.0
 majid021
on 29 Nov 2017
majid021
on 29 Nov 2017
- 1.8.4
And more question:
- It's right, the cpu and memory were close to 100%. But my question is why the pods not assigned to the other node since the node is not ready for a long time?
 gogeof
on 6 Dec 2017
gogeof
on 6 Dec 2017
+1 Having nodes going into the NotReady state was happening pretty consistently the past two days after upgrading to Kubernets 1.8.5. I think the issue for me was I didn't upgrade the cluster-autoscaler. Once I upgraded the autoscaler to 1.03 (helm 0.3.0), I haven't seen any nodes in the "NotReady" state. It looks like I have a stable cluster again.
- kops: 1.8.0
- kubectl: 1.8.5
- helm: 2.7.2
- cluster-autoscaler: v0.6.0 ---> Upgraded to 1.03 (helm 0.3.0)
 iamrandys
on 11 Dec 2017
iamrandys
on 11 Dec 2017
even the docker is hang ,the pleg should not to be inactive
 timchenxiaoyu
on 15 Dec 2017
timchenxiaoyu
on 15 Dec 2017
Same here, 1.8.5
not update from low version, create from empty.
resource is enough
memory
# free -mg
              total        used        free      shared  buff/cache   available
Mem:             15           2           8           0           5          12
Swap:            15           0          15
top
top - 04:34:39 up 24 days,  6:23,  2 users,  load average: 31.56, 83.38, 66.29
Tasks: 432 total,   5 running, 427 sleeping,   0 stopped,   0 zombie
%Cpu(s):  9.2 us,  1.9 sy,  0.0 ni, 87.5 id,  1.3 wa,  0.0 hi,  0.1 si,  0.0 st
KiB Mem : 16323064 total,  8650144 free,  2417236 used,  5255684 buff/cache
KiB Swap: 16665596 total, 16646344 free,    19252 used. 12595460 avail Mem

  PID USER      PR  NI    VIRT    RES    SHR S  %CPU %MEM     TIME+ COMMAND
31905 root      20   0 1622320 194096  51280 S  14.9  1.2 698:10.66 kubelet
19402 root      20   0   12560   9696   1424 R  10.3  0.1 442:05.00 memtester
 2626 root      20   0   12560   9660   1392 R   9.6  0.1 446:41.38 memtester
 8680 root      20   0   12560   9660   1396 R   9.6  0.1 444:34.38 memtester
15004 root      20   0   12560   9704   1432 R   9.6  0.1 443:04.98 memtester
 1663 root      20   0 8424940 424912  20556 S   4.6  2.6   2809:24 dockerd
  409 root      20   0   49940  37068  20648 S   2.3  0.2 144:03.37 calico-felix
  551 root      20   0  631788  20952  11824 S   1.3  0.1 100:36.78 costor
 9527 root      20   0 10.529g  24800  13612 S   1.0  0.2   3:43.55 etcd
 2608 root      20   0  421936   6040   3288 S   0.7  0.0  31:29.78 containerd-shim
 4136 root      20   0  780344  24580  12316 S   0.7  0.2  45:58.60 costor
 4208 root      20   0  755756  22208  12176 S   0.7  0.1  41:49.58 costor
 8665 root      20   0  210344   5960   3208 S   0.7  0.0  31:27.75 cont
Found the following situation right now.
as Docker Storage Setup was configurated to take 80% of the thin pool, kubelet hard eviction was at 10%. Both were not machting.
Docker crashed somehow interally and kubelet came with this PLEG error.
Increasing kubelet hard eviction (imagefs.available) to 20% hits the docker setup and kubelet started removing old images.
In 1.8 we changed from image-gc-threshold to hard-eviction and choosed the wrong matching params.
I will observe our cluster for this right now.
Kube: 1.8.5
Docker: 1.12.6
OS: RHEL7
 sybnex
on 21 Dec 2017
sybnex
on 21 Dec 2017
looking at the internal kubelet_pleg_relist_latency_microseconds metric from prometheus, this looks suspicious..
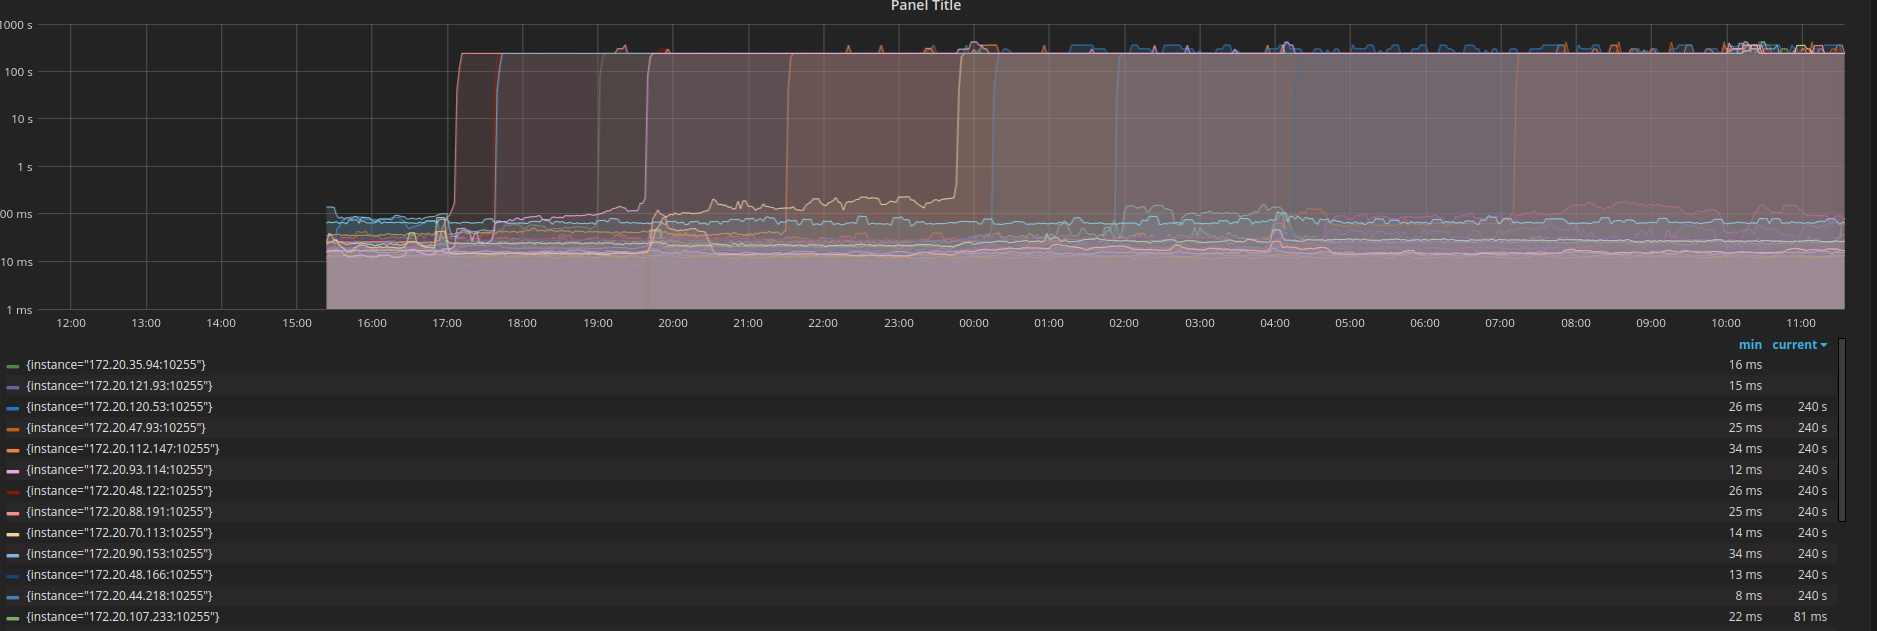
kops installed kube 1.8.4 with coreOS
docker info
Containers: 246
 Running: 222
 Paused: 0
 Stopped: 24
Images: 30
Server Version: 17.09.0-ce
Storage Driver: overlay
 Backing Filesystem: extfs
 Supports d_type: true
Logging Driver: json-file
Cgroup Driver: cgroupfs
Plugins:
 Volume: local
 Network: bridge host macvlan null overlay
 Log: awslogs fluentd gcplogs gelf journald json-file logentries splunk syslog
Swarm: inactive
Runtimes: runc
Default Runtime: runc
Init Binary: docker-init
containerd version: 06b9cb35161009dcb7123345749fef02f7cea8e0
runc version: 3f2f8b84a77f73d38244dd690525642a72156c64
init version: v0.13.2 (expected: 949e6facb77383876aeff8a6944dde66b3089574)
Security Options:
 seccomp
  Profile: default
 selinux
Kernel Version: 4.13.16-coreos-r2
Operating System: Container Linux by CoreOS 1576.4.0 (Ladybug)
OSType: linux
Architecture: x86_64
CPUs: 8
Total Memory: 14.69GiB
Name: ip-172-20-120-53.eu-west-1.compute.internal
ID: SI53:ECLM:HXFE:LOVY:STTS:C4X2:WRFK:UGBN:7NYP:4N3E:MZGS:EAVM
Docker Root Dir: /var/lib/docker
Debug Mode (client): false
Debug Mode (server): false
Registry: https://index.docker.io/v1/
Experimental: false
Insecure Registries:
 127.0.0.0/8
Live Restore Enabled: false
 Deshke
on 21 Dec 2017
Deshke
on 21 Dec 2017
+1
origin v3.7.0
kubernetes v1.7.6
docker v1.12.6
OS CentOS 7.4
It seems like runtime container GC takes effect on pod creation & termination
Let me try and report what happened after disabling GC.
 esevan
on 29 Dec 2017
esevan
on 29 Dec 2017
In my case, CNI doesn't handle the situation.
according to my analysis, code sequnce is just as following
1. kuberuntime_gc.go: client.StopPodSandbox (Timeout Default: 2m)
  -> docker_sandbox.go: StopPodSandbox
    -> cni.go: TearDownPod
  -> CNI deleteFromNetwork (Timeout Default: 3m) <- Nothing gonna happen if CNI doesn't handle this situation.
    -> docker_service.go: StopContainer

2. kuberuntime_gc.go: client.RemovePodSandbox
StopPodSandbox raise timeout exception, then return without processing remove pod sandbox
However, CNI process is ongoing after StopPodSandbox timed out.
It's like kubelet threads are starved by CNI process, so that kubelet cannot monitor the PLEG properly consequently.
I resolved this issue by modifying CNI to just return when CNI_NS is empty (because it means dead pod).
(BTW, I'm using kuryr-kubernetes as a CNI plugin)
Hope for this to help you guys!
esevan
on 3 Jan 2018
@esevan could you propose a patch?
rphillips
on 8 Jan 2018
@rphillips This bug is actually close to CNI bug, and surely I'm going to upload the patch to openstack/kuryr-kubernetes after looking the behavor more.
esevan
on 9 Jan 2018
In our case it is related to https://github.com/moby/moby/issues/33820
Stopping docker container timeouts, and then the node starts flapping between ready/notReady with the PLEG message.
Reverting the Docker version fixes the problem. (17.09-ce -> 12.06)
 ghost
on 11 Jan 2018
ghost
on 11 Jan 2018
The same error log with kubelet v1.9.1:
...
Jan 15 12:36:52 l23-27-101 kubelet[7335]: I0115 12:36:52.884617    7335 status_manager.go:136] Kubernetes client is nil, not starting status manager.
Jan 15 12:36:52 l23-27-101 kubelet[7335]: I0115 12:36:52.884636    7335 kubelet.go:1767] Starting kubelet main sync loop.
Jan 15 12:36:52 l23-27-101 kubelet[7335]: I0115 12:36:52.884692    7335 kubelet.go:1778] skipping pod synchronization - [container runtime is down PLEG is not healthy: pleg was last seen active 2562047h47m16.854775807s ago; threshold is 3m0s]
Jan 15 12:36:52 l23-27-101 kubelet[7335]: E0115 12:36:52.884788    7335 container_manager_linux.go:583] [ContainerManager]: Fail to get rootfs information unable to find data for container /
Jan 15 12:36:52 l23-27-101 kubelet[7335]: I0115 12:36:52.885001    7335 volume_manager.go:247] Starting Kubelet Volume Manager
...
 shenshouer
on 15 Jan 2018
shenshouer
on 15 Jan 2018
Does anybody have this problem with docker > 12.6 ??? (Except the unsupported version 17.09)
I'm just wondering if switching to 13.1 or 17.06 would be helpfull.
sybnex
on 15 Jan 2018
@sybnex 17.03 also have this problem in our cluster, It is most like a CNI bug.
yangyuw
on 16 Jan 2018
For me, this happened because kubelet was taking too much CPU doing housekeeping tasks, as a result no CPU time was left for docker. Reducing the housekeeping interval solved the issue for me.
dElogics
on 17 Jan 2018
@esevan: I'd appreciate the kuryr-kubernetes patch :-)
 celebdor
on 17 Jan 2018
celebdor
on 17 Jan 2018
FYI, we use Origin 1.5/Kubernetes 1.5 and Kuryr (first versions) without any problems :)
livelace
on 17 Jan 2018
@livelace any reason for not using later versions?
celebdor
on 17 Jan 2018
@celebdor There is no need, all works :) We use Origin + Openstack and those versions cover all our needs, we don't need new features of Kubernetes/Openstack, Kuryr just works. Maybe we will have any problems when two additional teams will join our infrastructure.
livelace
on 18 Jan 2018
The default pleg-relist-threshold is 3 minute.
Why can't we make pleg-relist-threshold configurable, and then set it a larger value.
I have made a PR to do this.
can somebody take a look?
https://github.com/kubernetes/kubernetes/pull/58279
 linyouchong
on 23 Jan 2018
linyouchong
on 23 Jan 2018
I get some confuse about PLEG and ProbeManager..
The PLEG should hold the pods and Containers' healthy in the node.
The ProbeManager also hold the Containers' healthy in the node.
Why we get the two module to do the same thing?
When the ProbeManager find the container is stop,it will restart the container .At the same time
if PLEG also found the container is stop,does the PLEG make a event to told the kubelet to do the same
thing?
 liucimin
on 31 Jan 2018
liucimin
on 31 Jan 2018
+1
Kubernetes v1.8.4
 erstaples
on 31 Jan 2018
erstaples
on 31 Jan 2018
@celebdor After update cni to daemonized one, it's now stabilized without cni patch.
esevan
on 1 Feb 2018
+1
kubernetes v1.9.2
docker 17.03.2-ce
 huzhengchuan
on 27 Feb 2018
huzhengchuan
on 27 Feb 2018
+1
kubernetes v1.9.2
docker 17.03.2-ce
the error logs in kubelet log:
Feb 27 16:19:12 node-2 kubelet: E0227 16:19:12.839866   47544 remote_runtime.go:169] ListPodSandbox with filter nil from runtime service failed: rpc error: code = Unknown desc = Cannot connect to the Docker daemon at unix:///var/run/docker.sock. Is the docker daemon running?
Feb 27 16:19:12 node-2 kubelet: E0227 16:19:12.839919   47544 kuberuntime_sandbox.go:192] ListPodSandbox failed: rpc error: code = Unknown desc = Cannot connect to the Docker daemon at unix:///var/run/docker.sock. Is the docker daemon running?
Feb 27 16:19:12 node-2 kubelet: E0227 16:19:12.839937   47544 generic.go:197] GenericPLEG: Unable to retrieve pods: rpc error: code = Unknown desc = Cannot connect to the Docker daemon at unix:///var/run/docker.sock. Is the docker daemon running?
kubelet use dockerclient(httpClient) to call ContainerList(all status && io.kubernetes.docker.type=="podsandbox") with 2 minutes timeout .
docker ps -a --filter "label=io.kubernetes.docker.type=podsandbox"
Run the command directly when the node became into NotReady maybe helpful for debug
following is Do request code in dockerclient, this error looks like come into timeout:
        if err, ok := err.(net.Error); ok {
            if err.Timeout() {
                return serverResp, ErrorConnectionFailed(cli.host)
            }
            if !err.Temporary() {
                if strings.Contains(err.Error(), "connection refused") || strings.Contains(err.Error(), "dial unix") {
                    return serverResp, ErrorConnectionFailed(cli.host)
                }
            }
        }
 chestack
on 27 Feb 2018
chestack
on 27 Feb 2018
+1
Kubernetes 1.8.4
docker 17.09.1-ce
Edit:
kube-aws 0.9.9
 Labbs
on 27 Feb 2018
Labbs
on 27 Feb 2018
+1
Kubernetes v1.9.3
docker 17.12.0-ce (i know its not officially supported)
weaveworks/weave-kube:2.2.0
Ubuntu 16.04.3 LTS || Kernel: 4.4.0-112
Installation via kubeadm with master + worker (master does not show this ready/not ready behaviour, only the worker).
 MarcosCela
on 28 Feb 2018
MarcosCela
on 28 Feb 2018
+1
Kubernetes: 1.8.8
Docker: 1.12.6-cs13
Cloud provider: GCE
OS: Ubuntu 16.04.3 LTS
Kernel: 4.13.0-1011-gcp
Install tools: kubeadm
I'm using calico for networking
 albertvaka
on 13 Mar 2018
albertvaka
on 13 Mar 2018
this commit fix problem in my env
https://github.com/moby/moby/pull/31273/commits/8e425ebc422876ddf2ffb3beaa5a0443a6097e46
this is a helpful link about "docker ps hang":
https://github.com/moby/moby/pull/31273
update: Actually rolling back to docker 1.13.1 helped, the above commits are not in docker 1.13.1
chestack
on 19 Mar 2018
+1
Kubernetes: 1.8.9
Docker: 17.09.1-ce
Cloud provider: AWS
OS: CoreOS 1632.3.0
Kernel: 4.14.19-coreos
Install tools: kops
Calico 2.6.6 for networking
 juris
on 19 Mar 2018
juris
on 19 Mar 2018
For solve this issue, I use an old coreos version (1520.9.0). This version use docker 1.12.6.
Since this change, no flapping problem.
Labbs
on 19 Mar 2018
+1
Kubernetes: 1.9.3
Docker: 17.09.1-ce
Cloud provider: AWS
OS: CoreOS 1632.3.0
Kernel: 4.14.19-coreos
Install tools: kops
Weave
 leeeboo
on 22 Mar 2018
leeeboo
on 22 Mar 2018
+1
Kubernetes: 1.9.6
Docker: 17.12.0-ce
OS: Redhat 7.4
Kernel: 3.10.0-693.el7.x86_64
CNI: flannel
 dragon9783
on 29 Mar 2018
dragon9783
on 29 Mar 2018
FYI. Even for the latest Kubernetes 1.10
The validated docker versions are the same as for v1.9: 1.11.2 to 1.13.1 and 17.03.x
In my case, rolling back to 1.12.6 helped.
juris
on 29 Mar 2018
Observed the same issues:
Kubernetes: 1.9.6
Docker: 17.12.0-ce
OS: Ubuntu 16.04
CNI: Weave
What fixed it was downgrading to Docker 17.03
 briandeheus
on 30 Mar 2018
briandeheus
on 30 Mar 2018
I had the same problem and it seems fixed by upgrading to Debian Strech. The cluster is running on AWS deployed with kops.
Kubernetes: 1.8.7
Docker: 1.13.1
OS: Debian Stretch
CNI: Calico
Kernel: 4.9.0-5-amd64
By default Debian Jessie was used with kernel version 4.4 I think and it wasn't working fine.
 komljen
on 30 Mar 2018
komljen
on 30 Mar 2018
The issue happens in our ENV and we do some analysis of this issue:
k8s version 1.7/1.8
The stack info is from k8s 1.7
Our env has lots of exited container (More than 1k)because of our network plugin bug.
When we restart the kubelet. After the while, kubelet become unhealthy.
We trace the log and the stack.
When PLEG do the relist operation.
The first time, it will get many events (each container will have an event) need to handle at https://github.com/kubernetes/kubernetes/blob/master/pkg/kubelet/pleg/generic.go#L228
It takes many times to update cache (https://github.com/kubernetes/kubernetes/blob/master/pkg/kubelet/pleg/generic.go#L240)
When we print the stack, most of time, the stack is like:
k8s.io/kubernetes/vendor/google.golang.org/grpc/transport.(*Stream).Header(0xc42537aff0, 0x3b53b68, 0xc42204f060, 0x59ceee0)
        /mnt/tess/src/k8s.io/kubernetes/_output/local/go/src/k8s.io/kubernetes/vendor/google.golang.org/grpc/transport/transport.go:239 +0x146
k8s.io/kubernetes/vendor/google.golang.org/grpc.recvResponse(0x0, 0x0, 0x59c4c60, 0x5b0c6b0, 0x0, 0x0, 0x0, 0x0, 0x59a8620, 0xc4217f2460, ...)
        /mnt/tess/src/k8s.io/kubernetes/_output/local/go/src/k8s.io/kubernetes/vendor/google.golang.org/grpc/call.go:61 +0x9e
k8s.io/kubernetes/vendor/google.golang.org/grpc.invoke(0x7ff04e8b9800, 0xc424be3380, 0x3aa3c5e, 0x28, 0x374bb00, 0xc424ca0590, 0x374bbe0, 0xc421f428b0, 0xc421800240, 0x0, ...)
        /mnt/tess/src/k8s.io/kubernetes/_output/local/go/src/k8s.io/kubernetes/vendor/google.golang.org/grpc/call.go:208 +0x862
k8s.io/kubernetes/vendor/google.golang.org/grpc.Invoke(0x7ff04e8b9800, 0xc424be3380, 0x3aa3c5e, 0x28, 0x374bb00, 0xc424ca0590, 0x374bbe0, 0xc421f428b0, 0xc421800240, 0x0, ...)
        /mnt/tess/src/k8s.io/kubernetes/_output/local/go/src/k8s.io/kubernetes/vendor/google.golang.org/grpc/call.go:118 +0x19c
k8s.io/kubernetes/pkg/kubelet/apis/cri/v1alpha1/runtime.(*runtimeServiceClient).PodSandboxStatus(0xc4217f6038, 0x7ff04e8b9800, 0xc424be3380, 0xc424ca0590, 0x0, 0x0, 0x0, 0xc424d92870, 0xc42204f3e8, 0x28)
        /mnt/tess/src/k8s.io/kubernetes/_output/local/go/src/k8s.io/kubernetes/pkg/kubelet/apis/cri/v1alpha1/runtime/api.pb.go:3409 +0xd2
k8s.io/kubernetes/pkg/kubelet/remote.(*RemoteRuntimeService).PodSandboxStatus(0xc4217ec440, 0xc424c7a740, 0x40, 0x0, 0x0, 0x0)
        /mnt/tess/src/k8s.io/kubernetes/_output/local/go/src/k8s.io/kubernetes/pkg/kubelet/remote/remote_runtime.go:143 +0x113
k8s.io/kubernetes/pkg/kubelet/kuberuntime.instrumentedRuntimeService.PodSandboxStatus(0x59d86a0, 0xc4217ec440, 0xc424c7a740, 0x40, 0x0, 0x0, 0x0)
        /mnt/tess/src/k8s.io/kubernetes/_output/local/go/src/k8s.io/kubernetes/pkg/kubelet/kuberuntime/instrumented_services.go:192 +0xc4
k8s.io/kubernetes/pkg/kubelet/kuberuntime.(*instrumentedRuntimeService).PodSandboxStatus(0xc4217f41f0, 0xc424c7a740, 0x40, 0xc421f428a8, 0x1, 0x1)
        <autogenerated>:1 +0x59
k8s.io/kubernetes/pkg/kubelet/kuberuntime.(*kubeGenericRuntimeManager).GetPodStatus(0xc421802340, 0xc421dfad80, 0x24, 0xc422358e00, 0x1c, 0xc42172aa17, 0x5, 0x50a3ac, 0x5ae88e0, 0xc400000000)
        /mnt/tess/src/k8s.io/kubernetes/_output/local/go/src/k8s.io/kubernetes/pkg/kubelet/kuberuntime/kuberuntime_manager.go:841 +0x373
k8s.io/kubernetes/pkg/kubelet/pleg.(*GenericPLEG).updateCache(0xc421027260, 0xc421f0e840, 0xc421dfad80, 0x24, 0xc423e86ea8, 0x1)
        /mnt/tess/src/k8s.io/kubernetes/_output/local/go/src/k8s.io/kubernetes/pkg/kubelet/pleg/generic.go:346 +0xcf
k8s.io/kubernetes/pkg/kubelet/pleg.(*GenericPLEG).relist(0xc421027260)
        /mnt/tess/src/k8s.io/kubernetes/_output/local/go/src/k8s.io/kubernetes/pkg/kubelet/pleg/generic.go:242 +0xbe1
k8s.io/kubernetes/pkg/kubelet/pleg.(*GenericPLEG).(k8s.io/kubernetes/pkg/kubelet/pleg.relist)-fm()
        /mnt/tess/src/k8s.io/kubernetes/_output/local/go/src/k8s.io/kubernetes/pkg/kubelet/pleg/generic.go:129 +0x2a
k8s.io/kubernetes/vendor/k8s.io/apimachinery/pkg/util/wait.JitterUntil.func1(0xc4217c81c0)
        /mnt/tess/src/k8s.io/kubernetes/_output/local/go/src/k8s.io/kubernetes/vendor/k8s.io/apimachinery/pkg/util/wait/wait.go:97 +0x5e
k8s.io/kubernetes/vendor/k8s.io/apimachinery/pkg/util/wait.JitterUntil(0xc4217c81c0, 0x3b9aca00, 0x0, 0x1, 0xc420084120)
        /mnt/tess/src/k8s.io/kubernetes/_output/local/go/src/k8s.io/kubernetes/vendor/k8s.io/apimachinery/pkg/util/wait/wait.go:98 +0xbd
k8s.io/kubernetes/vendor/k8s.io/apimachinery/pkg/util/wait.Until(0xc4217c81c0, 0x3b9aca00, 0xc420084120)
        /mnt/tess/src/k8s.io/kubernetes/_output/local/go/src/k8s.io/kubernetes/vendor/k8s.io/apimachinery/pkg/util/wait/wait.go:52 +0x4d
created by k8s.io/kubernetes/pkg/kubelet/pleg.(*GenericPLEG).Start
        /mnt/tess/src/k8s.io/kubernetes/_output/local/go/src/k8s.io/kubernetes/pkg/kubelet/pleg/generic.go:129 +0x8a
We print the timestamp of each event, it takes about 1s for kubelet to handle each event.
So it caused PLEG can not do the relist within 3 minutes.
Then the syncLoop stops work because of PLEG unhealthy(https://github.com/kubernetes/kubernetes/blob/master/pkg/kubelet/kubelet.go#L1758).
So the PLEG event channel will not be consumed by syncLoop (https://github.com/kubernetes/kubernetes/blob/master/pkg/kubelet/kubelet.go#L1862)
But PLEG continues to handle the events and send the event to plegChannel (https://github.com/kubernetes/kubernetes/blob/master/pkg/kubelet/pleg/generic.go#L261)
After the channel full (the channel capacity is 1000 https://github.com/kubernetes/kubernetes/blob/master/pkg/kubelet/kubelet.go#L144)
The PLEG will stucked. The the pleg relist timestamp will never be update (https://github.com/kubernetes/kubernetes/blob/master/pkg/kubelet/pleg/generic.go#L201)
stack info:
goroutine 422 [chan send, 3 minutes]:
k8s.io/kubernetes/pkg/kubelet/pleg.(*GenericPLEG).relist(0xc421027260)
        /mnt/tess/src/k8s.io/kubernetes/_output/local/go/src/k8s.io/kubernetes/pkg/kubelet/pleg/generic.go:263 +0x95a
k8s.io/kubernetes/pkg/kubelet/pleg.(*GenericPLEG).(k8s.io/kubernetes/pkg/kubelet/pleg.relist)-fm()
        /mnt/tess/src/k8s.io/kubernetes/_output/local/go/src/k8s.io/kubernetes/pkg/kubelet/pleg/generic.go:129 +0x2a
k8s.io/kubernetes/vendor/k8s.io/apimachinery/pkg/util/wait.JitterUntil.func1(0xc4217c81c0)
        /mnt/tess/src/k8s.io/kubernetes/_output/local/go/src/k8s.io/kubernetes/vendor/k8s.io/apimachinery/pkg/util/wait/wait.go:97 +0x5e
k8s.io/kubernetes/vendor/k8s.io/apimachinery/pkg/util/wait.JitterUntil(0xc4217c81c0, 0x3b9aca00, 0x0, 0x1, 0xc420084120)
        /mnt/tess/src/k8s.io/kubernetes/_output/local/go/src/k8s.io/kubernetes/vendor/k8s.io/apimachinery/pkg/util/wait/wait.go:98 +0xbd
k8s.io/kubernetes/vendor/k8s.io/apimachinery/pkg/util/wait.Until(0xc4217c81c0, 0x3b9aca00, 0xc420084120)
        /mnt/tess/src/k8s.io/kubernetes/_output/local/go/src/k8s.io/kubernetes/vendor/k8s.io/apimachinery/pkg/util/wait/wait.go:52 +0x4d
created by k8s.io/kubernetes/pkg/kubelet/pleg.(*GenericPLEG).Start
        /mnt/tess/src/k8s.io/kubernetes/_output/local/go/src/k8s.io/kubernetes/pkg/kubelet/pleg/generic.go:129 +0x8a
After we delete the exited containers, then restart the kubelet, it comes back.
So there is a risk for kubelet hung when there are more than 1k containers in the node.
The solution is we can make pod cache update in parallel (https://github.com/kubernetes/kubernetes/blob/master/pkg/kubelet/pleg/generic.go#L236)
Or there should be a timeout set when handle the events.
@yingnanzhang666
 wenlxie
on 3 Apr 2018
wenlxie
on 3 Apr 2018
When my node starts flapping between Ready/NotReady due to PLEG issues it is invariably one of the exited gcr.io/google_containers/pause containers that docker inspect hangs on. Restarting the docker daemon fixes the issue.
erstaples
on 13 Apr 2018
Hello to everyone, I can see that the issue is being reported through different combinations of CoreOS/Docker/Kubernetes binaries. In our case, we are still on the same kubernetes stack - (1.7.10 / CoreOS/kops/AWS), i dont think that the issue is resolved BUt we managed to reduce the effect to almost zero, when eventually we introduced 'tini' (https://github.com/krallin/tini) as part of our docker images deployed on kubernetes. We have about 20 different containers (apps) deployed and we do deploy very often. so this means - lots of shutting down and spinning up new replicas etc. So the more often we were deploying the more we were hit with 'Nodes' not ready and PLEG. When we rolled out tini to the majority of images - making sure that PId were reaped and killed accordingly - we stopped seing this side effect. I strongly suggest you have a look at tini, or any other docker base image that can handle correctly sub process reaping as I think it is highly related with the problem. Hope that helps. Of course the core problem remains so the issue is still valid.
javapapo
on 14 Apr 2018
Since this issue is still unresolved and is affecting my clusters on a semi-regular basis, I'd like to be part of the solution and get to work developing a custom operator that can automatically repair nodes affected by the node flapping, PLEG is not healthy issue via some sort of generic auto-repair operator. My inspiration for this comes from this open issue in the Node Problem Detector repo. I've configured a custom monitor using the Node Problem Detector that sets a PLEGNotHealthy node condition to true whenever the PLEG is not healthy starts showing up in the kubelet logs. The next step is an automated remedy system that checks for node conditions, such as PLEGNotHealthy, that indicate an unhealthy node and then cordon, evict, and restart the docker daemon on the node (or whatever remediation is appropriate for the given condition). I'm looking at the CoreOS Update Operator as a reference for the operator I'd like to develop. I'm curious to know if anyone else has thoughts on this, or has already put together an automatic remediation solution that could apply to this issue. Apologies is this is not the right forum for this discussion.
erstaples
on 16 Apr 2018
In our case, it sometimes stucks in PodSandboxStatus() for 2min and kubelet outputs:
rpc error: code = 4 desc = context deadline exceeded
kernel outputs:
unregister_netdevice: waiting for eth0 to become free. Usage count = 1
But it just occurred at specific Pod deletion (which with large network traffic).
First, the PodSpec sandboxes stop success, but the pause sandbox stops failed (will be running forever). Then it will always stuck here when fetch status with same sandbox id.
As a result, -> PLEG latency high -> PLEG unhealthy (invoke twice, 2min * 2 = 4min > 3 min)-> NodeNotReady
related codes in docker_sandbox.go:
func (ds *dockerService) PodSandboxStatus(podSandboxID string) (*runtimeapi.PodSandboxStatus, error) {
    // Inspect the container.
    // !!! maybe stuck here for 2 min !!!
    r, err := ds.client.InspectContainer(podSandboxID)
    if err != nil {
        return nil, err
    }
    ...
}
func (ds *dockerService) StopPodSandbox(podSandboxID string) error {
    var namespace, name string
    var checkpointErr, statusErr error
    needNetworkTearDown := false

    // Try to retrieve sandbox information from docker daemon or sandbox checkpoint
    // !!! maybe stuck here !!!
    status, statusErr := ds.PodSandboxStatus(podSandboxID)
    ...
According by prometheus monitoring, docker inspect latency is normal, but kubelet runtime inspect/stop operation takes too long.
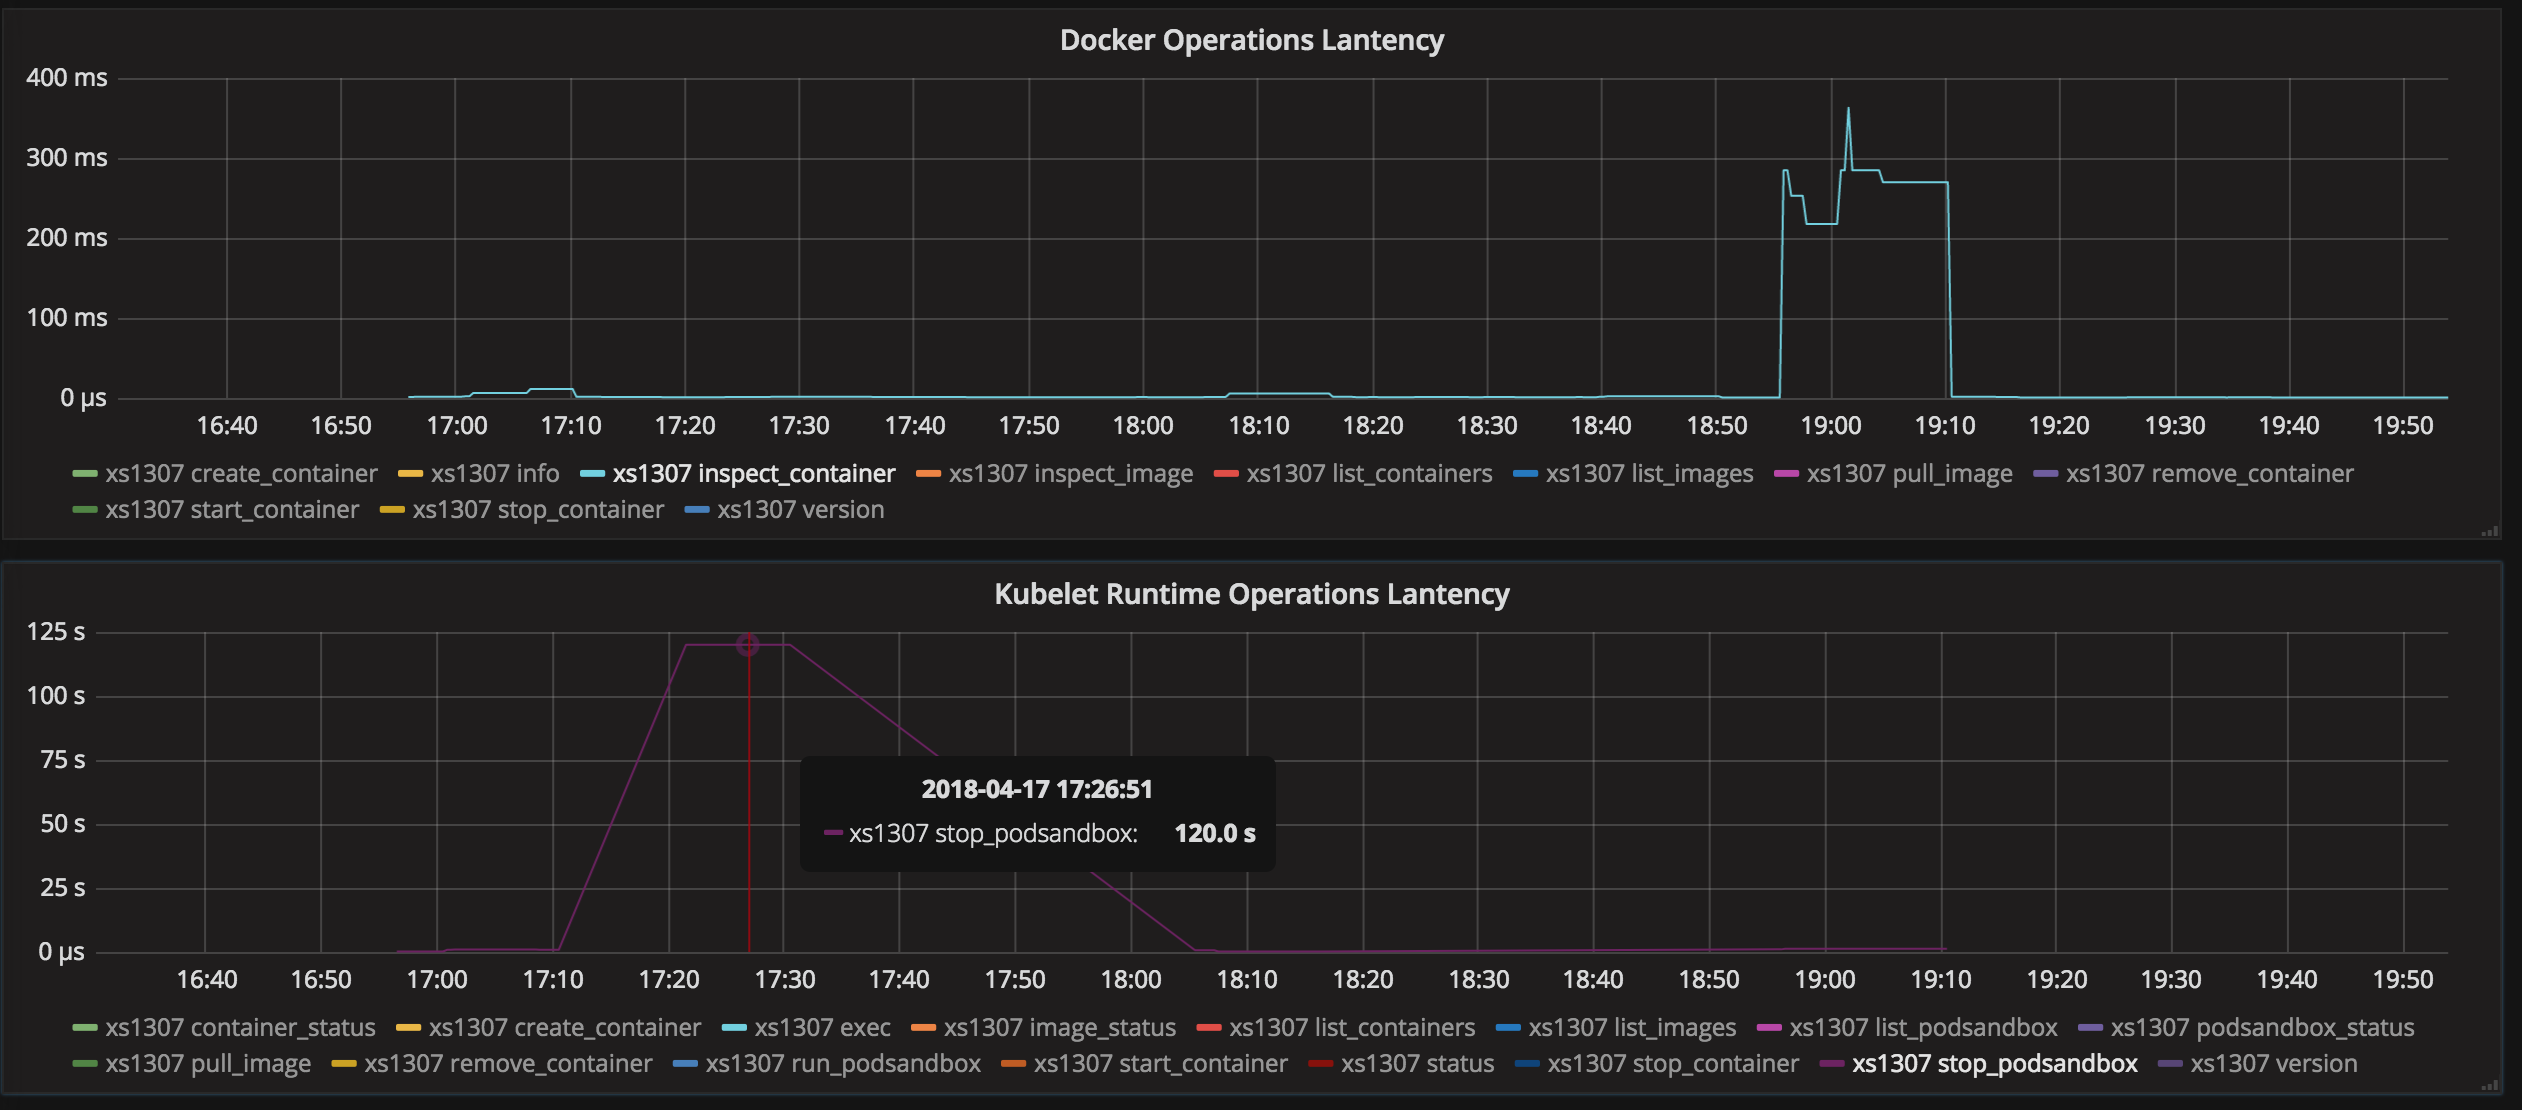
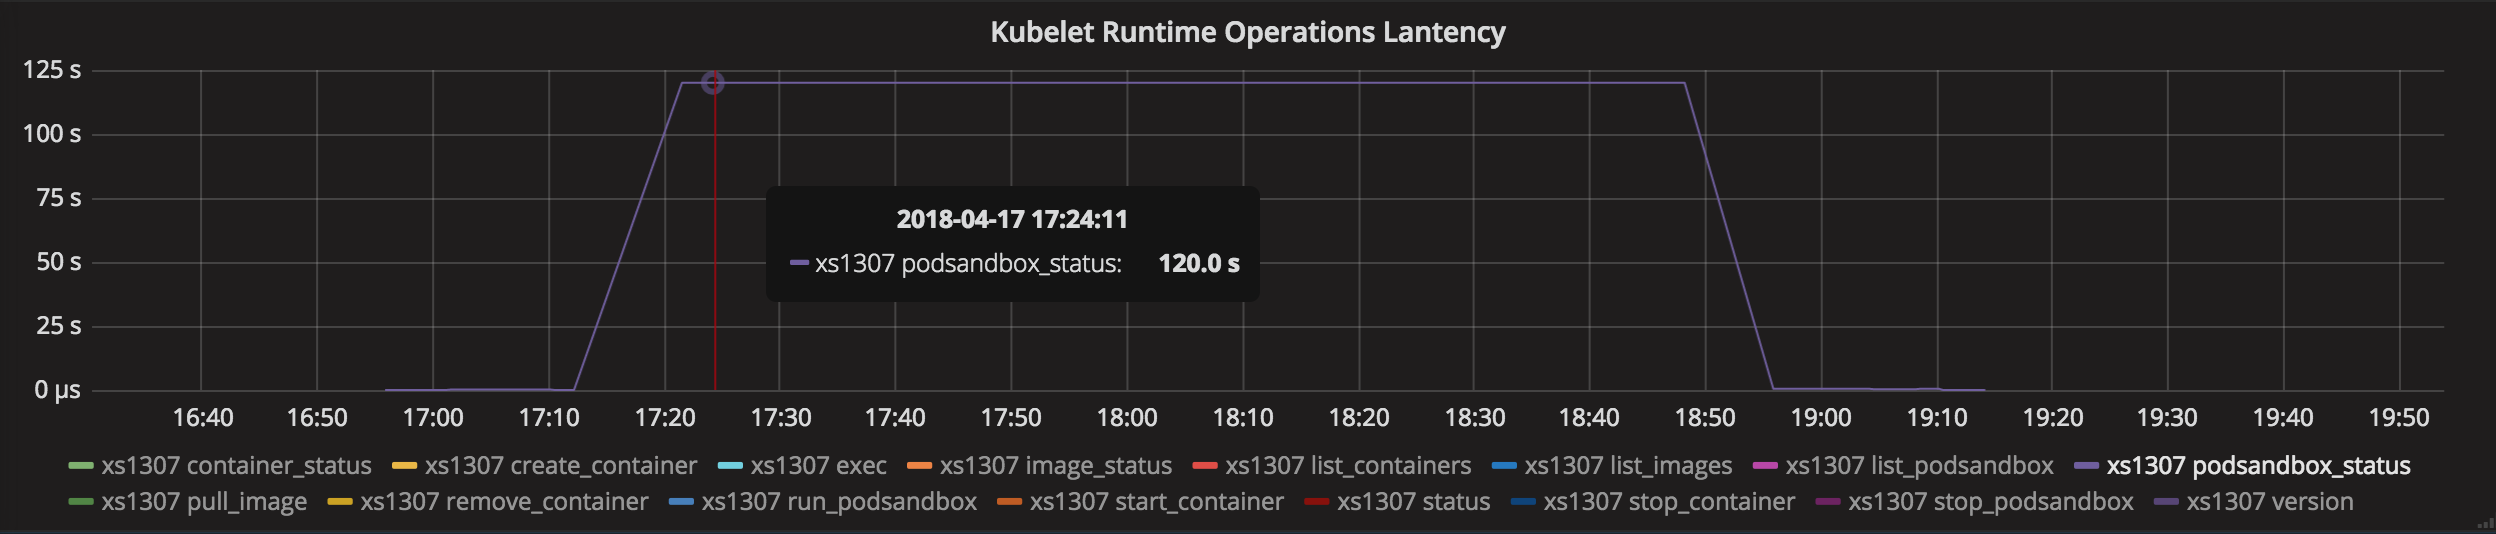
docker version: 1.12.6
kubelet version: 1.7.12
linux kernel version: 4.4.0-72-generic
CNI: calico
as @yujuhong mentions:
         grpc              http           grpc
kubelet <----> dockershim <----> dockerd <----> containerd
When the situation occurs, I try to run docker ps. It works. Using curl to /var/run/docker.sock
to get pause container's json is also works. I wonder if it is a grpc response problems between kubelet and dockershim?
curl --unix-socket /var/run/docker.sock http:/v1.24/containers/66755504b8dc3a5c17454e04e0b74676a8d45089a7e522230aad8041ab6f3a5a/json
When my node starts flapping between Ready/NotReady due to PLEG issues it is invariably one of the exited gcr.io/google_containers/pause containers that docker inspect hangs on. Restarting the docker daemon fixes the issue.
It seems that our case is similar to @erstaples 's description. I think it will be resolved by just docker stop & docker rm the pause container which is hang, instead of restart dockerd.
 whypro
on 18 Apr 2018
whypro
on 18 Apr 2018
I can also see the unregister_netdevice: waiting for eth0 to become free. Usage count = 1 error if I run dmesg on the node. The pod never terminates as the system can't free the network device. This causes PodSandboxStatus of sandbox "XXX" for pod "YYY" error: rpc error: code = DeadlineExceeded desc = context deadline exceeded error in journalctl -u kubelet.
Might be related to the Kubernetes network plugin? A few people in this thread seem to use Calico. Maybe it's something there?
albertvaka
on 24 Apr 2018
@deitch you say something about CoreOS issues here. Can you provide some more information in how to solve this networking issues?
I'm facing the same problems here, but I'm testing with a baremetal node of 768Gb of RAM. It's with more than 2k images loaded (I'm pruning some of them).
We're using k8s 1.7.15, and Docker 17.09. I'm thinking about revert this to Docker 1.13 as mentioned in some comments here, but I'm not sure this will solve my problem.
We do have some more specific problems also, as Bonding losing connection with one of the switches, but I don't know how this is related to CoreOS networking issue.
Also, kubelet and docker are spending a lot of CPU time (almost more than anything else in the system)
Thanks!
 rikatz
on 10 May 2018
rikatz
on 10 May 2018
Seeing this on Kubernetes v1.8.7 and calico v2.8.6. In our case, some pods are stuck in Terminating state, and Kubelet throws PLEG errors:
E0515 16:15:34.039735    1904 generic.go:241] PLEG: Ignoring events for pod myapp-5c7f7dbcf7-xvblm/production: rpc error: code = DeadlineExceeded desc = context deadline exceeded
I0515 16:16:34.560821    1904 kubelet.go:1779] skipping pod synchronization - [PLEG is not healthy: pleg was last seen active 3m0.529418824s ago; threshold is 3m0s]
I0515 16:16:39.561010    1904 kubelet.go:1779] skipping pod synchronization - [PLEG is not healthy: pleg was last seen active 3m5.529605547s ago; threshold is 3m0s]
I0515 16:16:41.857069    1904 kubelet_node_status.go:791] Node became not ready: {Type:Ready Status:False LastHeartbeatTime:2018-05-15 16:16:41.857046605 +0000 UTC LastTransitionTime:2018-05-15 16:16:41.857046605 +0000 UTC Reason:KubeletNotReady Message:PLEG is not healthy: pleg was last seen active 3m7.825663114s ago; threshold is 3m0s}
I0515 16:16:44.561281    1904 kubelet.go:1779] skipping pod synchronization - [PLEG is not healthy: pleg was last seen active 3m10.52986717s ago; threshold is 3m0s]
I0515 16:16:49.561499    1904 kubelet.go:1779] skipping pod synchronization - [PLEG is not healthy: pleg was last seen active 3m15.530093202s ago; threshold is 3m0s]
I0515 16:16:54.561740    1904 kubelet.go:1779] skipping pod synchronization - [PLEG is not healthy: pleg was last seen active 3m20.530326452s ago; threshold is 3m0s]
I0515 16:16:59.561943    1904 kubelet.go:1779] skipping pod synchronization - [PLEG is not healthy: pleg was last seen active 3m25.530538095s ago; threshold is 3m0s]
I0515 16:17:04.562205    1904 kubelet.go:1779] skipping pod synchronization - [PLEG is not healthy: pleg was last seen active 3m30.530802216s ago; threshold is 3m0s]
I0515 16:17:09.562432    1904 kubelet.go:1779] skipping pod synchronization - [PLEG is not healthy: pleg was last seen active 3m35.531029395s ago; threshold is 3m0s]
I0515 16:17:14.562644    1904 kubelet.go:1779] skipping pod synchronization - [PLEG is not healthy: pleg was last seen active 3m40.531229806s ago; threshold is 3m0s]
I0515 16:17:19.562899    1904 kubelet.go:1779] skipping pod synchronization - [PLEG is not healthy: pleg was last seen active 3m45.531492495s ago; threshold is 3m0s]
I0515 16:17:24.563168    1904 kubelet.go:1779] skipping pod synchronization - [PLEG is not healthy: pleg was last seen active 3m50.531746392s ago; threshold is 3m0s]
I0515 16:17:29.563422    1904 kubelet.go:1779] skipping pod synchronization - [PLEG is not healthy: pleg was last seen active 3m55.532013675s ago; threshold is 3m0s]
I0515 16:17:34.563740    1904 kubelet.go:1779] skipping pod synchronization - [PLEG is not healthy: pleg was last seen active 4m0.532327398s ago; threshold is 3m0s]
E0515 16:17:34.041174    1904 generic.go:271] PLEG: pod myapp-5c7f7dbcf7-xvblm/production failed reinspection: rpc error: code = DeadlineExceeded desc = context deadline exceeded
When I run docker ps, I only see the pause container for pod myapp-5c7f7dbcf7-xvblm.
ip-10-72-160-222 core # docker ps | grep myapp-5c7f7dbcf7-xvblm
c6c34d9b1e86        gcr.io/google_containers/pause-amd64:3.0                         "/pause"                 9 hours ago         Up 9 hours                              k8s_POD_myapp-5c7f7dbcf7-xvblm_production_baa0e029-5810-11e8-a9e8-0e88e0071844_0
After restarting kubelet, the zombie pause container (id c6c34d9b1e86) was removed. kubelet logs:
W0515 16:56:26.439306   79462 docker_sandbox.go:343] failed to read pod IP from plugin/docker: NetworkPlugin cni failed on the status hook for pod "myapp-5c7f7dbcf7-xvblm_production": CNI failed to retrieve network namespace path: Cannot find network namespace for the terminated container "c6c34d9b1e86be38b41bba5ba60e1b2765584f3d3877cd6184562707d0c2177b"
W0515 16:56:26.439962   79462 cni.go:265] CNI failed to retrieve network namespace path: Cannot find network namespace for the terminated container "c6c34d9b1e86be38b41bba5ba60e1b2765584f3d3877cd6184562707d0c2177b"
2018-05-15 16:56:26.428 [INFO][79799] calico-ipam.go 249: Releasing address using handleID handleID="k8s-pod-network.c6c34d9b1e86be38b41bba5ba60e1b2765584f3d3877cd6184562707d0c2177b" workloadID="production.myapp-5c7f7dbcf7-xvblm"
2018-05-15 16:56:26.428 [INFO][79799] ipam.go 738: Releasing all IPs with handle 'k8s-pod-network.c6c34d9b1e86be38b41bba5ba60e1b2765584f3d3877cd6184562707d0c2177b'
2018-05-15 16:56:26.739 [INFO][81206] ipam.go 738: Releasing all IPs with handle 'k8s-pod-network.c6c34d9b1e86be38b41bba5ba60e1b2765584f3d3877cd6184562707d0c2177b'
2018-05-15 16:56:26.742 [INFO][81206] ipam.go 738: Releasing all IPs with handle 'production.myapp-5c7f7dbcf7-xvblm'
2018-05-15 16:56:26.742 [INFO][81206] calico-ipam.go 261: Releasing address using workloadID handleID="k8s-pod-network.c6c34d9b1e86be38b41bba5ba60e1b2765584f3d3877cd6184562707d0c2177b" workloadID="production.myapp-5c7f7dbcf7-xvblm"
2018-05-15 16:56:26.742 [WARNING][81206] calico-ipam.go 255: Asked to release address but it doesn't exist. Ignoring handleID="k8s-pod-network.c6c34d9b1e86be38b41bba5ba60e1b2765584f3d3877cd6184562707d0c2177b" workloadID="production.myapp-5c7f7dbcf7-xvblm"
Calico CNI releasing IP address
2018-05-15 16:56:26.745 [INFO][80545] k8s.go 379: Teardown processing complete. Workload="production.myapp-5c7f7dbcf7-xvblm"
From kernel logs:
[40473.123736] unregister_netdevice: waiting for eth0 to become free. Usage count = 1
[40483.187768] unregister_netdevice: waiting for eth0 to become free. Usage count = 1
[40493.235781] unregister_netdevice: waiting for eth0 to become free. Usage count = 1
I think there is a similar ticket open https://github.com/moby/moby/issues/5618
zihaoyu
on 15 May 2018
This's a completely different case. Here you know the reason why the node is flapping.
dElogics
on 18 May 2018
We are having this issue bring down nodes on our production clusters. Pods can not terminate or create. Kubernetes 1.9.7 with CoreOS 1688.5.3 (Rhyolite) on Linux Kernel 4.14.32 and Docker 17.12.1-ce. Our CNI is Calico.
containerd's log shows some errors about a cgroup that was requested being deleted, but not directly around the time of error.
May 21 17:35:00 ip-10-5-76-113.ap-southeast-1.compute.internal env[1282]: time="2018-05-21T17:35:00Z" level=error msg="stat cgroup bf717dbbf392b0ba7ef0452f7b90c4cfb4eca81e7329bfcd07fe020959b737df" error="cgroups: cgroup deleted"
May 21 17:44:32 ip-10-5-76-113.ap-southeast-1.compute.internal env[1282]: time="2018-05-21T17:44:32Z" level=error msg="stat cgroup a0887b496319a09b1f3870f1c523f65bf9dbfca19b45da73711a823917fdfa18" error="cgroups: cgroup deleted"
May 21 17:50:32 ip-10-5-76-113.ap-southeast-1.compute.internal env[1282]: time="2018-05-21T17:50:32Z" level=error msg="stat cgroup 2fbb4ba674050e67b2bf402c76137347c3b5f510b8934d6a97bc3b96069db8f8" error="cgroups: cgroup deleted"
May 21 17:56:22 ip-10-5-76-113.ap-southeast-1.compute.internal env[1282]: time="2018-05-21T17:56:22Z" level=error msg="stat cgroup f9501a4284257522917b6fae7e9f4766e5b8cf7e46989f48379b68876d953ef2" error="cgroups: cgroup deleted"
May 21 18:43:28 ip-10-5-76-113.ap-southeast-1.compute.internal env[1282]: time="2018-05-21T18:43:28Z" level=error msg="stat cgroup c37e7505019ae279941a7a78db1b7a6e7aab4006dfcdd83d479f1f973d4373d2" error="cgroups: cgroup deleted"
May 21 19:38:28 ip-10-5-76-113.ap-southeast-1.compute.internal env[1282]: time="2018-05-21T19:38:28Z" level=error msg="stat cgroup a327a775955d2b69cb01921beb747b4bba0df5ea79f637e0c9e59aeb7e670b43" error="cgroups: cgroup deleted"
May 21 19:50:26 ip-10-5-76-113.ap-southeast-1.compute.internal env[1282]: time="2018-05-21T19:50:26Z" level=error msg="stat cgroup 5d11f13d13b461fe2aa1396d947f1307a6c3a78e87fa23d4a1926a6d46794d58" error="cgroups: cgroup deleted"
May 21 19:52:26 ip-10-5-76-113.ap-southeast-1.compute.internal env[1282]: time="2018-05-21T19:52:26Z" level=error msg="stat cgroup fb7551cde0f9a640fbbb928d989ca84200909bce2821e03a550d5bfd293e786b" error="cgroups: cgroup deleted"
May 21 20:54:32 ip-10-5-76-113.ap-southeast-1.compute.internal env[1282]: time="2018-05-21T20:54:32Z" level=error msg="stat cgroup bcd1432a64b35fd644295e2ae75abd0a91cb38a9fa0d03f251c517c438318c53" error="cgroups: cgroup deleted"
May 21 21:56:28 ip-10-5-76-113.ap-southeast-1.compute.internal env[1282]: time="2018-05-21T21:56:28Z" level=error msg="stat cgroup 2a68f073a7152b4ceaf14d128f9d31fbb2d5c4b150806c87a640354673f11792" error="cgroups: cgroup deleted"
May 21 22:02:30 ip-10-5-76-113.ap-southeast-1.compute.internal env[1282]: time="2018-05-21T22:02:30Z" level=error msg="stat cgroup aa2224e7cfd0a6f44b52ff058a50a331056b0939d670de461b7ffc7d01bc4d59" error="cgroups: cgroup deleted"
May 21 22:18:32 ip-10-5-76-113.ap-southeast-1.compute.internal env[1282]: time="2018-05-21T22:18:32Z" level=error msg="stat cgroup 95e0c4f7607234ada85a1ab76b7ec2aa446a35e868ad8459a1cae6344bc85f4f" error="cgroups: cgroup deleted"
May 21 22:21:32 ip-10-5-76-113.ap-southeast-1.compute.internal env[1282]: time="2018-05-21T22:21:32Z" level=error msg="stat cgroup 76578ede18ba3bc1307d83c4b2ccd7e35659f6ff8c93bcd54860c9413f2f33d6" error="cgroups: cgroup deleted"
Kubelet shows some interesting lines about pod sandbox operations failing.
May 23 18:17:25 ip-10-5-76-113.ap-southeast-1.compute.internal kubelet[1513]: E0523 18:17:25.578306    1513 remote_runtime.go:115] StopPodSandbox "922f625ced6d6f6adf33fe67e5dd8378040cd2e5c8cacdde20779fc692574ca5" from runtime service failed: rpc error: code = DeadlineExceeded desc = context deadline exceeded
May 23 18:17:25 ip-10-5-76-113.ap-southeast-1.compute.internal kubelet[1513]: E0523 18:17:25.578354    1513 kuberuntime_manager.go:800] Failed to stop sandbox {"docker" "922f625ced6d6f6adf33fe67e5dd8378040cd2e5c8cacdde20779fc692574ca5"}
May 23 18:17:25 ip-10-5-76-113.ap-southeast-1.compute.internal kubelet[1513]: W0523 18:17:25.579095    1513 docker_sandbox.go:196] Both sandbox container and checkpoint for id "a893f57acec1f3779c35aed743f128408e491ff2f53a312895fe883e2c68d642" could not be found. Proceed without further sandbox information.
May 23 18:17:25 ip-10-5-76-113.ap-southeast-1.compute.internal kubelet[1513]: W0523 18:17:25.579426    1513 cni.go:242] CNI failed to retrieve network namespace path: Error: No such container: a893f57acec1f3779c35aed743f128408e491ff2f53a312895fe883e2c68d642
May 23 18:17:25 ip-10-5-76-113.ap-southeast-1.compute.internal kubelet[1513]: 2018-05-23 18:17:25.723 [INFO][33881] calico.go 338: Extracted identifiers ContainerID="a893f57acec1f3779c35aed743f128408e491ff2f53a312895fe883e2c68d642" Node="ip-10-5-76-113.ap-southeast-1.compute.internal" Orchestrator="cni" Workload="a89
May 23 18:17:25 ip-10-5-76-113.ap-southeast-1.compute.internal kubelet[1513]: 2018-05-23 18:17:25.723 [INFO][33881] utils.go 263: Configured environment: [CNI_COMMAND=DEL CNI_CONTAINERID=a893f57acec1f3779c35aed743f128408e491ff2f53a312895fe883e2c68d642 CNI_NETNS= CNI_ARGS=IgnoreUnknown=1;IgnoreUnknown=1;K8S_POD_NAMESP
May 23 18:17:25 ip-10-5-76-113.ap-southeast-1.compute.internal kubelet[1513]: 2018-05-23 18:17:25.723 [INFO][33881] client.go 202: Loading config from environment
May 23 18:17:25 ip-10-5-76-113.ap-southeast-1.compute.internal kubelet[1513]: Calico CNI releasing IP address
May 23 18:17:25 ip-10-5-76-113.ap-southeast-1.compute.internal kubelet[1513]: 2018-05-23 18:17:25.796 [INFO][33905] utils.go 263: Configured environment: [CNI_COMMAND=DEL CNI_CONTAINERID=a893f57acec1f3779c35aed743f128408e491ff2f53a312895fe883e2c68d642 CNI_NETNS= CNI_ARGS=IgnoreUnknown=1;IgnoreUnknown=1;K8S_POD_NAMESP
May 23 18:17:25 ip-10-5-76-113.ap-southeast-1.compute.internal kubelet[1513]: 2018-05-23 18:17:25.796 [INFO][33905] client.go 202: Loading config from environment
May 23 18:17:25 ip-10-5-76-113.ap-southeast-1.compute.internal kubelet[1513]: 2018-05-23 18:17:25.796 [INFO][33905] calico-ipam.go 249: Releasing address using handleID handleID="k8s-pod-network.a893f57acec1f3779c35aed743f128408e491ff2f53a312895fe883e2c68d642" workloadID="a893f57acec1f3779c35aed743f128408e491ff2f53a3
May 23 18:17:25 ip-10-5-76-113.ap-southeast-1.compute.internal kubelet[1513]: 2018-05-23 18:17:25.796 [INFO][33905] ipam.go 738: Releasing all IPs with handle 'k8s-pod-network.a893f57acec1f3779c35aed743f128408e491ff2f53a312895fe883e2c68d642'
May 23 18:17:25 ip-10-5-76-113.ap-southeast-1.compute.internal kubelet[1513]: 2018-05-23 18:17:25.805 [WARNING][33905] calico-ipam.go 255: Asked to release address but it doesn't exist. Ignoring handleID="k8s-pod-network.a893f57acec1f3779c35aed743f128408e491ff2f53a312895fe883e2c68d642" workloadID="a893f57acec1f3779c3
May 23 18:17:25 ip-10-5-76-113.ap-southeast-1.compute.internal kubelet[1513]: 2018-05-23 18:17:25.805 [INFO][33905] calico-ipam.go 261: Releasing address using workloadID handleID="k8s-pod-network.a893f57acec1f3779c35aed743f128408e491ff2f53a312895fe883e2c68d642" workloadID="a893f57acec1f3779c35aed743f128408e491ff2f53
May 23 18:17:25 ip-10-5-76-113.ap-southeast-1.compute.internal kubelet[1513]: 2018-05-23 18:17:25.805 [INFO][33905] ipam.go 738: Releasing all IPs with handle 'a893f57acec1f3779c35aed743f128408e491ff2f53a312895fe883e2c68d642'
May 23 18:17:25 ip-10-5-76-113.ap-southeast-1.compute.internal kubelet[1513]: 2018-05-23 18:17:25.822 [INFO][33881] calico.go 373: Endpoint object does not exist, no need to clean up. Workload="a893f57acec1f3779c35aed743f128408e491ff2f53a312895fe883e2c68d642" endpoint=api.WorkloadEndpointMetadata{ObjectMetadata:unver
May 23 18:17:25 ip-10-5-76-113.ap-southeast-1.compute.internal kubelet[1513]: E0523 18:17:25.824925    1513 kubelet.go:1527] error killing pod: failed to "KillPodSandbox" for "9c246b32-4f10-11e8-964a-0a7e4ae265be" with KillPodSandboxError: "rpc error: code = DeadlineExceeded desc = context deadline exceeded"
May 23 18:17:25 ip-10-5-76-113.ap-southeast-1.compute.internal kubelet[1513]: E0523 18:17:25.825025    1513 pod_workers.go:186] Error syncing pod 9c246b32-4f10-11e8-964a-0a7e4ae265be ("flntk8-fl01-j7lf4_splunk(9c246b32-4f10-11e8-964a-0a7e4ae265be)"), skipping: error killing pod: failed to "KillPodSandbo
May 23 18:17:25 ip-10-5-76-113.ap-southeast-1.compute.internal kubelet[1513]: E0523 18:17:25.969591    1513 kuberuntime_manager.go:860] PodSandboxStatus of sandbox "922f625ced6d6f6adf33fe67e5dd8378040cd2e5c8cacdde20779fc692574ca5" for pod "flntk8-fl01-j7lf4_splunk(9c246b32-4f10-11e8-964a-0a7e4ae265be)"
May 23 18:17:25 ip-10-5-76-113.ap-southeast-1.compute.internal kubelet[1513]: E0523 18:17:25.969640    1513 generic.go:241] PLEG: Ignoring events for pod flntk8-fl01-j7lf4/splunk: rpc error: code = DeadlineExceeded desc = context deadline exceeded
May 23 18:20:27 ip-10-5-76-113.ap-southeast-1.compute.internal kubelet[1513]: I0523 18:20:27.753523    1513 kubelet.go:1790] skipping pod synchronization - [PLEG is not healthy: pleg was last seen active 3m0.783603773s ago; threshold is 3m0s]
May 23 18:19:27 ip-10-5-76-113.ap-southeast-1.compute.internal kubelet[1513]: E0523 18:19:27.019252    1513 kuberuntime_manager.go:860] PodSandboxStatus of sandbox "922f625ced6d6f6adf33fe67e5dd8378040cd2e5c8cacdde20779fc692574ca5" for pod "flntk8-fl01-j7lf4_splunk(9c246b32-4f10-11e8-964a-0a7e4ae265be)"
May 23 18:19:27 ip-10-5-76-113.ap-southeast-1.compute.internal kubelet[1513]: E0523 18:19:27.019295    1513 generic.go:241] PLEG: Ignoring events for pod flntk8-fl01-j7lf4/splunk: rpc error: code = DeadlineExceeded desc = context deadline exceeded
The kernel shows the eth0 waiting to become free lines which seem related to: https://github.com/moby/moby/issues/5618
[1727395.220036] unregister_netdevice: waiting for eth0 to become free. Usage count = 1
[1727405.308152] unregister_netdevice: waiting for eth0 to become free. Usage count = 1
[1727415.404335] unregister_netdevice: waiting for eth0 to become free. Usage count = 1
[1727425.484491] unregister_netdevice: waiting for eth0 to become free. Usage count = 1
[1727435.524626] unregister_netdevice: waiting for eth0 to become free. Usage count = 1
[1727445.588785] unregister_netdevice: waiting for eth0 to become free. Usage count = 1
However, our case did not show the adapter lo and did not crash the kernel. Further investigation points to https://github.com/projectcalico/calico/issues/1109, which still concludes this is a Kernel race condition bug that is not yet fixed.
Restarting kubelet fixed the issue enough to let pods terminate and create, but the waiting for eth0 to become free spam continued in dmesg.
Here is an interesting read on the issue: https://medium.com/@bcdonadio/when-the-blue-whale-sinks-55c40807c2fc
 integrii
on 23 May 2018
integrii
on 23 May 2018
@integrii
No it happens on the latest centOS too. Got it reproduced once.
dElogics
on 3 Jun 2018
Ok, I would like to change on what I said earlier -- the container runtime will suddenly go down complaining
skipping pod synchronization - [PLEG is not healthy:...
While docker is running file. In the mean time restarting kubelet makes PLEG healthy and the node is up again.
docker, kubelet kube-proxy are all set to RT priority.
dElogics
on 3 Jun 2018
One more thing -- on restarting kubelet, the same thing happens unless I restart docker.
I tried using curl on the docker's socket, and it's working fine.
dElogics
on 3 Jun 2018
+1
Kubernetes: 1.10.2
Docker: 1.12.6
OS: centos 7.4
Kernel: 3.10.0-693.el7.x86_64
CNI: calico
 lanxenet
on 5 Jun 2018
lanxenet
on 5 Jun 2018
+1
Kubernetes: 1.7.16
Docker: 17.12.1-ce
OS: CoreOS 1688.5.3
Kernel: 4.14.32-coreos
CNI: Calico (v2.6.7)
Kops v1.9.1
 phspagiari
on 14 Jun 2018
phspagiari
on 14 Jun 2018
Do you think increasing --runtime-request-timeout will help?
dElogics
on 17 Jun 2018
I'm seeing this issue with CRI-O on one of my nodes. Kubernetes 1.10.1, CRI-O 1.10.1, Fedora 27, kernel 4.16.7-200.fc27, using Flannel.
runc list and crictl pods are both fast, but crictl ps takes minutes to run.
 mcronce
on 26 Jun 2018
mcronce
on 26 Jun 2018
+1
Kubernetes: v1.8.7+coreos.0
Docker: 17.05.0-ce
OS: Redhat 7x
CNI: Calico
Kubespary 2.4
We see this issue frequently. We restart docker and kubelet and it goes away.
 sivarajp
on 13 Jul 2018
sivarajp
on 13 Jul 2018
With latest stable CoreOS 1745.7.0 I don't see this issue anymore.
komljen
on 13 Jul 2018
How long have you been watching after updating @komljen? For us, this takes awhile to occur.
integrii
on 13 Jul 2018
I had those issues every few days on one large CI environment, and I think I tried everything without success. Changing OS to above CoreOS version was the key, and I don't see any issues for one month already.
komljen
on 13 Jul 2018
I haven’t seen the issue for over a month either; without any changes, so I wouldn’t be so quick to declare the patient healthy :-)
 oivindoh
on 13 Jul 2018
oivindoh
on 13 Jul 2018
@komljen We run centos 7. Even today one of our node went down.
sivarajp
on 13 Jul 2018
I haven’t seen the issue for over a month either; without any changes, so I wouldn’t be so quick to declare the patient healthy :-)
@oivindoh I didn't have time to check what was changed in that particular kernel version, but in my case, it solved the problem.
komljen
on 14 Jul 2018
I found the cause of this problem in our cluster. In summary, the bug is caused by a CNI command (calico) that never terminates, which causes a dockershim server handler to stuck forever. As a result, the RPC calls PodSandboxStatus() for a bad pod always timeout, thus makes the PLEG to be unhealthy.
Effects of the bug:
- The bad pod stuck in
Terminatingstate forever - Other pod states could lost sync with kubeapi servers for a few minutes (causing kube2iam errors in our cluster)
- Memory leaks, since the function is called many times and never returns
Here are what you could see on a node when this happens:
- the following error messages in kubelet log:
Jul 13 23:52:15 E0713 23:52:15.461144    1740 kuberuntime_manager.go:860] PodSandboxStatus of sandbox "01d8b790bc9ede72959ddf0669e540dfb1f84bfd252fb364770a31702d9e7eeb" for pod "pod-name" error: rpc error: code = DeadlineExceeded desc = context deadline exceeded
Jul 13 23:52:15 E0713 23:52:15.461215    1740 generic.go:241] PLEG: Ignoring events for pod pod-name: rpc error: code = DeadlineExceeded desc = context deadline exceeded
Jul 13 23:52:16 E0713 23:52:16.682555    1740 pod_workers.go:186] Error syncing pod 7f3fd634-7e57-11e8-9ddb-0acecd2e6e42 ("pod-name"), skipping: rpc error: code = DeadlineExceeded desc = context deadline exceeded
Jul 13 23:53:15 I0713 23:53:15.682254    1740 kubelet.go:1790] skipping pod synchronization - [PLEG is not healthy: pleg was last seen active 3m0.267402933s ago; threshold is 3m0s]
- the following timeout metrics:
$ curl -s http://localhost:10255/metrics | grep 'quantile="0.5"' | grep "e+08"
kubelet_pleg_relist_interval_microseconds{quantile="0.5"} 2.41047643e+08
kubelet_pleg_relist_latency_microseconds{quantile="0.5"} 2.40047461e+08
kubelet_runtime_operations_latency_microseconds{operation_type="podsandbox_status",quantile="0.5"} 1.2000027e+08
- a child process (calico) of kubelet is stuck:
$ ps -A -o pid,ppid,start_time,comm | grep 1740
  1740      1 Jun15 kubelet
  5428   1740 Jul04 calico
Here's the stack trace in dockershim server:
PodSandboxStatus()  :: pkg/kubelet/dockershim/docker_sandbox.go
... -> GetPodNetworkStatus()  ::  pkg/kubelet/network/plugins.go
         ^^^^^ this function stuck on pm.podLock(fullPodName).Lock()
To fix the problem, kubelet should use timeout on CNI library function calls (DelNetwork() etc) and other external library calls that may take forever to return.
 mechpen
on 16 Jul 2018
mechpen
on 16 Jul 2018
@mechpen I am glad someone found an answer somewhere. I don't think that applies here (we are using weave, not calico, at least in this cluster; I use calico elsewhere and have been driving the multi-arch of it), and we haven't seen similar error messages.
If it does show up, though, you said:
To fix the problem, kubelet should use timeout on CNI library function calls (DelNetwork() and etc) or any external library calls that may take forever to return
Configurable? Or requires kubelet modification?
deitch
on 16 Jul 2018
@deitch this error could happen to weave as well, if a weave CNI command does not terminate (could be caused by low level bugs shared by all systems).
The fix requires kubelet code changes.
mechpen
on 16 Jul 2018
@mechpen We see this issue in the cluster running in flannel as well? Is the fix be the same?
sivarajp
on 17 Jul 2018
@komljen I just saw this issue with 1745.7.0
I'm seeing this issue on calico currently with k8s 1.9
I do have a pod on that exact node that is stuck in Terminating. Let me force kill it and see if the issue stops.
 sstarcher
on 17 Jul 2018
sstarcher
on 17 Jul 2018
@mechpen did you open a issue for k8s for your suggestion?
sstarcher
on 17 Jul 2018
@mechpen should we also open a ticket against calico?
sstarcher
on 17 Jul 2018
@sstarcher I haven't file any ticket yet. Still trying to find out why calico hangs forever.
I see lots of kernel messages:
[2797545.570844] unregister_netdevice: waiting for eth0 to become free. Usage count = 2
This error has haunted linux/container for many years.
mechpen
on 18 Jul 2018
@mechpen
@sstarcher
@deitch
Yes,this issue i have catch it one month ago.
And i have open a issue it.
I try to fix this problem in kubelet.But it should first fix it in cni.
So i first fix it in cni then fix it in kubelet.
Thx
#65743
https://github.com/containernetworking/cni/issues/567
https://github.com/containernetworking/cni/pull/568
liucimin
on 19 Jul 2018
@sstarcher @mechpen calico ticket related to this issue:
https://github.com/projectcalico/calico/issues/1109
 r0bj
on 25 Jul 2018
r0bj
on 25 Jul 2018
@mechpen see https://github.com/moby/moby/issues/5618 for the issue.
dElogics
on 30 Jul 2018
Just happened again on our production cluster
Kubernetes: 1.11.0
coreos: 1520.9.0
docker: 1.12.6
cni: calico
I restarted the kubelet and dockerd on notready node and it seems okay now.
the only different between notready node and ready node is there are lot's of cronjob pod start and stop and killed on notready node.
leeeboo
on 31 Jul 2018
@mechpen
I'm not sure if I'm experiencing the same issue or not.
Jul 30 17:52:15 cloud-blade-31 kubelet[24734]: I0730 17:52:15.585102   24734 kubelet_node_status.go:431] Recording NodeNotReady event message for node cloud-blade-31
Jul 30 17:52:15 cloud-blade-31 kubelet[24734]: I0730 17:52:15.585137   24734 kubelet_node_status.go:792] Node became not ready: {Type:Ready Status:False LastHeartbeatTime:2018-07-30 17:52:15.585076295 -0700 PDT m=+13352844.638760537 LastTransitionTime:2018-07-30 17:52:15.585076295 -0700 PDT m=+13352844.638760537 Reason:KubeletNotReady Message:PLEG is not healthy: pleg was last seen active 3m0.948768335s ago; threshold is 3m0s}
Jul 30 17:52:25 cloud-blade-31 kubelet[24734]: I0730 17:52:25.608101   24734 kubelet_node_status.go:443] Using node IP: "10.11.3.31"
Jul 30 17:52:35 cloud-blade-31 kubelet[24734]: I0730 17:52:35.640422   24734 kubelet_node_status.go:443] Using node IP: "10.11.3.31"
Jul 30 17:52:36 cloud-blade-31 kubelet[24734]: E0730 17:52:36.556409   24734 remote_runtime.go:169] ListPodSandbox with filter nil from runtime service failed: rpc error: code = DeadlineExceeded desc = context deadline exceeded
Jul 30 17:52:36 cloud-blade-31 kubelet[24734]: E0730 17:52:36.556474   24734 kuberuntime_sandbox.go:192] ListPodSandbox failed: rpc error: code = DeadlineExceeded desc = context deadline exceeded
Jul 30 17:52:36 cloud-blade-31 kubelet[24734]: W0730 17:52:36.556492   24734 image_gc_manager.go:173] [imageGCManager] Failed to monitor images: rpc error: code = DeadlineExceeded desc = context deadline exceeded
Jul 30 17:52:45 cloud-blade-31 kubelet[24734]: I0730 17:52:45.667169   24734 kubelet_node_status.go:443] Using node IP: "10.11.3.31"
Jul 30 17:52:55 cloud-blade-31 kubelet[24734]: I0730 17:52:55.692889   24734 kubelet_node_status.go:443] Using node IP: "10.11.3.31"
Jul 30 17:53:05 cloud-blade-31 kubelet[24734]: I0730 17:53:05.729182   24734 kubelet_node_status.go:443] Using node IP: "10.11.3.31"
Jul 30 17:53:15 cloud-blade-31 kubelet[24734]: E0730 17:53:15.265668   24734 remote_runtime.go:169] ListPodSandbox with filter &PodSandboxFilter{Id:,State:&PodSandboxStateValue{State:SANDBOX_READY,},LabelSelector:map[string]string{},} from runtime service failed: rpc error: code = DeadlineExceeded desc = context deadline exceeded
My Nodes go NotReady when (seemingly) the Docker daemon stops responding to health checks. On the machine itself docker ps hangs but a docker version returns. I have to restart the docker daemon for the node to be Ready again. I'm not sure if i can tell if I have pods that are stuck or not, because I seemingly cant list any containers.
Kubernetes: 1.9.2
Docker 17.03.1-ce commit c6d412e
OS: Ubuntu 16.04
Kernel: Linux 4.13.0-31-generic #34~16.04.1-Ubuntu SMP Fri Jan 19 17:11:01 UTC 2018 x86_64 x86_64 x86_64 GNU/Linux
 saurfangg
on 31 Jul 2018
saurfangg
on 31 Jul 2018
I have the same issue. It happens so frequently that a node does not survive a 5 minute period of scheduling pods.
The error occurs both on my main cluster (flannel) as well as my test clusters (calico).
I tried varying the kubernetes version (1.9.? / 1.11.1), the distribution (debian, ubuntu), the cloud provider (ec2, hetzner cloud), the docker version(17.3.2, 17.06.2). I didn't test the full matrix only ever variations of one variable.
My workload is very simple (Pod with one container, no volumes, default networking, scheduled in bulk of 30 pods)
Cluster is freshly set up with kubeadm without customization (excecpt my initial test with flannel)
The error is occuring within minutes. docker ps is not returning/stuck, pods stuck in terminating, etc.
Now I am wondering if there currently is ANY known configuration(using debian or ubuntu) that does not lead to this error?
Is there someone not affected by this bug that could share their working combinations of overlay networks and other versions that yields stable nodes?
 nielsole
on 4 Aug 2018
nielsole
on 4 Aug 2018
It happens in Openshift on Baremetal nodes.
For this particular occurrence of PLEG, the issue was seen when a large number of containers were started all at once (via a runaway cronjob) on OpenShift nodes that had a large number of vCPUs configured. The nodes were hitting the 250 pods per node maximum and were becoming overloaded.
A solution can be to reduce the vCPUs assigned to OpenShift node virtual machines by reducing the number of vCPUs to 8 (for example) which would mean the maximum number of pods that could be scheduled would be 80 pods (Default limit of 10 pods per CPU) instead of 250. It is typically recommended to have more reasonably-sized nodes instead of larger nodes.
I have nodes with 224 cpus. Kubernetes version 1.7.1 - Redhat 7.4
 jcperezamin
on 13 Aug 2018
jcperezamin
on 13 Aug 2018
I believe I have a similar issue. my pods hang pending termination and there are reports of an unhealthy PLEG in the logs. in my situation though, it doesn't ever come back healthy until I manually kill the kubelet process. a simple sudo systemctl restart kubelet has been resolving the issue but I have to do it for about 1/4 of our machines every time we do a rollout. its not great.
I can't tell exactly what is going on here but given I see a bridge command running under the kubelet process, maybe it is CNI related as mentioned previously in this thread? I've attached a ton of logs from 2 separate instances of this today and I am more than happy to work with someone to debug this issue.
of course every machine with this issue is spewing the classic unregister_netdevice: waiting for eth0 to become free. Usage count = 2 - I attached 2 different kubelet logs in logs.tar.gz with a SIGABRT sent to get the go routines that were running. hopefully this helps. I did see a couple calls that look related so I'll call those out here
Aug 13 22:57:30 worker-4bm5 kubelet[1563]: goroutine 2895825 [semacquire, 17 minutes]:
Aug 13 22:57:30 worker-4bm5 kubelet[1563]: sync.runtime_SemacquireMutex(0xc422082d4c)
Aug 13 22:57:30 worker-4bm5 kubelet[1563]:         /usr/local/go/src/runtime/sema.go:62 +0x34
Aug 13 22:57:30 worker-4bm5 kubelet[1563]: sync.(*Mutex).Lock(0xc422082d48)
Aug 13 22:57:30 worker-4bm5 kubelet[1563]:         /usr/local/go/src/sync/mutex.go:87 +0x9d
Aug 13 22:57:30 worker-4bm5 kubelet[1563]: k8s.io/kubernetes/pkg/kubelet/network.(*PluginManager).GetPodNetworkStatus(0xc420ddbbc0, 0xc421e36f76, 0x17, 0xc421e36f69, 0xc, 0x36791df, 0x6, 0xc4223f6180, 0x40, 0x0, ...)
Aug 13 22:57:30 worker-4bm5 kubelet[1563]:         /workspace/anago-v1.8.7-beta.0.34+b30876a5539f09/src/k8s.io/kubernetes/_output/dockerized/go/src/k8s.io/kubernetes/pkg/kubelet/network/plugins.go:376 +0xe6
Aug 13 22:57:30 worker-4bm5 kubelet[1563]: goroutine 2895819 [syscall, 17 minutes]:
Aug 13 22:57:30 worker-4bm5 kubelet[1563]: syscall.Syscall6(0xf7, 0x1, 0x25d7, 0xc422c96d70, 0x1000004, 0x0, 0x0, 0x7f7dc6909e10, 0x0, 0xc4217e9980)
Aug 13 22:57:30 worker-4bm5 kubelet[1563]:         /usr/local/go/src/syscall/asm_linux_amd64.s:44 +0x5
Aug 13 22:57:30 worker-4bm5 kubelet[1563]: os.(*Process).blockUntilWaitable(0xc42216af90, 0xc421328c60, 0xc4217e99e0, 0x1)
Aug 13 22:57:30 worker-4bm5 kubelet[1563]:         /usr/local/go/src/os/wait_waitid.go:28 +0xa5
Aug 13 22:57:30 worker-4bm5 kubelet[1563]: os.(*Process).wait(0xc42216af90, 0x411952, 0xc4222554c0, 0xc422255480)
Aug 13 22:57:30 worker-4bm5 kubelet[1563]:         /usr/local/go/src/os/exec_unix.go:22 +0x4d
Aug 13 22:57:30 worker-4bm5 kubelet[1563]: os.(*Process).Wait(0xc42216af90, 0x0, 0x0, 0x379bbc8)
Aug 13 22:57:30 worker-4bm5 kubelet[1563]:         /usr/local/go/src/os/exec.go:115 +0x2b
Aug 13 22:57:30 worker-4bm5 kubelet[1563]: os/exec.(*Cmd).Wait(0xc421328c60, 0x0, 0x0)
Aug 13 22:57:30 worker-4bm5 kubelet[1563]:         /usr/local/go/src/os/exec/exec.go:435 +0x62
Aug 13 22:57:30 worker-4bm5 kubelet[1563]: os/exec.(*Cmd).Run(0xc421328c60, 0xc422255480, 0x0)
Aug 13 22:57:30 worker-4bm5 kubelet[1563]:         /usr/local/go/src/os/exec/exec.go:280 +0x5c
Aug 13 22:57:30 worker-4bm5 kubelet[1563]: k8s.io/kubernetes/vendor/github.com/containernetworking/cni/pkg/invoke.(*RawExec).ExecPlugin(0x5208390, 0xc4217e98a0, 0x1b, 0xc4212e66e0, 0x156, 0x160, 0xc422b7fd40, 0xf, 0x12, 0x4121a8, ...)
Aug 13 22:57:30 worker-4bm5 kubelet[1563]:         /workspace/anago-v1.8.7-beta.0.34+b30876a5539f09/src/k8s.io/kubernetes/_output/dockerized/go/src/k8s.io/kubernetes/vendor/github.com/containernetworking/cni/pkg/invoke/raw_exec.go:42 +0x215
Kubernetes 1.8.7 on GCE using Container-Optimized OS on Kernel 4.14.33+ with kubenet.
 theRealWardo
on 14 Aug 2018
theRealWardo
on 14 Aug 2018
@jcperezamin , In 3.10 and later versions of OpenShift, there is no default value (Number of pods per core). The maximum supported value is the number of pods per node.
warmchang
on 14 Aug 2018
I'm getting this on bare metal. Using a fresh Ubuntu 18.04 install, configured with kubeadm (single node master).
I ran into Warning ContainerGCFailed 8m (x438 over 8h) ... rpc error: code = ResourceExhausted desc = grpc: trying to send message larger than max (8400302 vs. 8388608)
. The node had accumulated ~11,500 stopped containers. I cleared out some containers manually, which fixed GC, but the node went into NotReady because of PLEG immediately afterwards.
I'm using a pretty bare-bones k8s configuration, with flannel for networking. The affected node is an old Xeon E5-2670 based machine with 6x 10k SAS drives in hardware RAID6.
The PLEG issue had not resolved itself within an hour, restarting kubelet immediately fixed the issue.
 pnovotnak
on 24 Aug 2018
pnovotnak
on 24 Aug 2018
Seems to be happening every time I load the machine heavily, and the node never recovers by itself. Logging in via SSH, the node's CPU and other resources are empty. Not many docker containers, images, volumes, etc. Listing those resources is fast. And simply restating the kubelet always fixes the issue instantly.
I'm using the following versions:
- Ubuntu: 18.04.1
- Linux: 4.15.0-33-generic
- Kubernetes server: v1.11.0
- Kubeadm: v1.11.2
- Docker: 18.06.1-ce
pnovotnak
on 27 Aug 2018
Just experienced this issue on a bare-metal node with Kubernetes 1.11.1 :(
 adampl
on 28 Aug 2018
adampl
on 28 Aug 2018
Experiencing this as well, too often, and the nodes are really powerful and under utilized.
- Kubernetes: 1.10.2
- Kernel: 3.10.0
- Docker: 1.12.6
 devlounge
on 29 Aug 2018
devlounge
on 29 Aug 2018
Same issue...
Environment:
Cloud provider or hardware configuration: bare metal
OS (e.g. from /etc/os-release):Ubuntu 16.04
Kernel (e.g. uname -a): 4.4.0-109-generic
Kubernetes: 1.10.5
Docker: 1.12.3-0~xenial
 x8k
on 3 Sep 2018
x8k
on 3 Sep 2018
Have the same issue after migrating to kubernetes 1.10.3.
Client Version: version.Info{Major:"1", Minor:"10", GitVersion:"v1.10.5"
Server Version: version.Info{Major:"1", Minor:"10", GitVersion:"v1.10.3"
 angegar
on 4 Sep 2018
angegar
on 4 Sep 2018
Same issue on bare-metal environment:
Environment:
Cloud provider or hardware configuration: bare metal
OS (e.g. from /etc/os-release): CoreOS 1688.5.3
Kernel (e.g. uname -a): 4.14.32
Kubernetes: 1.10.4
Docker: 17.12.1
 corest
on 12 Sep 2018
corest
on 12 Sep 2018
It's interesting to know the IOWAIT value on nodes during problem arriving.
livelace
on 12 Sep 2018
Same issue seen repeatedly in another bare-metal environment. Versions for the most recent hit:
- OS: Ubuntu 16.04.5 LTS
- Kernel: Linux 4.4.0-134-generic
- Kubernetes:
- Flapping host: v1.10.3
- Masters: v1.10.5 and v1.10.2
- Docker on flapping host: 18.03.1-ce (compiled with go1.9.5)
 calder
on 14 Sep 2018
calder
on 14 Sep 2018
The cause is known.
Upstream fix is happening here:
https://github.com/containernetworking/cni/pull/568
Next step is to update cni used by kubernetes if someone wants to jump in
and prepare that pr. You'll probably want to coordinate with @liucimin or I
to avoid stepping on toes.
On Fri, Sep 14, 2018, 11:38 AM Calder Coalson notifications@github.com
wrote:
Same issue seen repeatedly in another bare-metal environment. Versions for
the most recent hit:
- OS: Ubuntu 16.040.5 LTS
- Kernel: Linux 4.4.0-134-generic
- Kubernetes:
- Flapping host: v1.10.3
- Masters: v1.10.5 and v1.10.2
- Docker on flapping host: 18.03.1-ce (compiled with go1.9.5)
—
You are receiving this because you commented.
Reply to this email directly, view it on GitHub
https://github.com/kubernetes/kubernetes/issues/45419#issuecomment-421447751,
or mute the thread
https://github.com/notifications/unsubscribe-auth/AFctXYnTJjNwtWquPmi5nozVMUYDetRlks5ua_eIgaJpZM4NSBta
.
pnovotnak
on 14 Sep 2018
@deitch
Hi, I met the same error like this
Error syncing pod *********** ("pod-name"), skipping: rpc error: code = DeadlineExceeded desc = context deadline exceeded
and I request the container info by dockerd and I found this request was blocked and no result return
curl -XGET --unix-socket /var/run/docker.sock http://localhost/containers/******("yourcontainerid")/json
So I think maybe this is a docker error
 Nebulazhang
on 19 Sep 2018
Nebulazhang
on 19 Sep 2018
this is about the docker daemon blocking while persisting logs to disk.
There is work in docker address this but it doesn't land until 18.06 (not yet a verified docker for k8s usage)
https://docs.docker.com/config/containers/logging/configure/#configure-the-delivery-mode-of-log-messages-from-container-to-log-driver
Since the docker daemon blocks on logging by default we can't address it till we can work around that issue.
This also correlates with iowait being higher when the issue is happening.
Containers that use an exec health check produce a lot of logs. There are other patterns that stress the logging mechanism as well.
Just my 2c
 mauilion
on 19 Sep 2018
mauilion
on 19 Sep 2018
We're not seeing high iowait on our machines doing this. (CoreOS, Kube 1.10, Docker 17.03)
@mauilion Can you point us to any issues or MR that explains the logging issue?
 mariusgrigoriu
on 12 Oct 2018
mariusgrigoriu
on 12 Oct 2018
I had the same issue which two Kubernetes nodes were flapping between Ready and Not Ready. Believe or not, the solution was to remove an exited docker container and the related pods.
d4e5d7ef1b5c gcr.io/google_containers/pause-amd64:3.0 Exited (137) 3 days ago
Afterwards the cluster was stable again, without other intervention.
Furthermore, this was the log message found in syslog:
E1015 07:48:49.386113    1323 remote_runtime.go:115] StopPodSandbox "d4e5d7ef1b5c3d13a4e537abbc7c4324e735d455969f7563287bcfc3f97b
085f" from runtime service failed: rpc error: code = DeadlineExceeded desc = context deadline exceeded
 rchicoli
on 16 Oct 2018
rchicoli
on 16 Oct 2018
Just facing this issue right now:
OS: Oracle Linux 7.5
Kernel: 4.17.5-1.el7.elrepo.x86_64
Kubernetes: 1.11.3
Flapping host: v1.11.3
Docker on flapping host: 18.03.1-ce (compiled with go1.9.5)
 emedina
on 24 Oct 2018
emedina
on 24 Oct 2018
https://github.com/containernetworking/cni/pull/568 got merged in CNI.
IIUC a new release of CNI containing the above fix should be able to fix this in k8s.
Coordination is needed - @bboreham @liucimin . Posting in sig-network as well
 nikopen
on 24 Oct 2018
nikopen
on 24 Oct 2018
Which version of kubernetes-cni will include the fix? Thanks!
 roywangtj
on 16 Nov 2018
roywangtj
on 16 Nov 2018
A more focused issue just about timeouts is #65743
As I said there, the next step is on the Kubernetes side, to check that the change does indeed fix the issue, e.g. by writing a test. No release is needed to check this: just pull in the latest libCNI code.
 bboreham
on 16 Nov 2018
bboreham
on 16 Nov 2018
/sig network
 tossmilestone
on 26 Nov 2018
tossmilestone
on 26 Nov 2018
If this and stuck docker ps are happening in conjunction to OOM triggered by guaranteed pods, take a look at #72294. as the pod infra container is killed and restarted, it might be a case that triggers the cni reinitialization which then triggers the timeout/locking issues mentioned above.
 clkao
on 22 Dec 2018
clkao
on 22 Dec 2018
We are seeing something which seems similar to this - constant PLEG flapping between Ready/NotReady - restart kubelet seems to fix the issue. I've noticed in goroutine dumps from kubelet we have a large number (currently over 15000 goroutines stuck in the following stack:
goroutine 29624527 [semacquire, 2766 minutes]:
sync.runtime_SemacquireMutex(0xc428facb3c, 0xc4216cca00)
    /usr/local/go/src/runtime/sema.go:71 +0x3d
sync.(*Mutex).Lock(0xc428facb38)
    /usr/local/go/src/sync/mutex.go:134 +0xee
k8s.io/kubernetes/pkg/kubelet/network.(*PluginManager).GetPodNetworkStatus(0xc420820980, 0xc429076242, 0xc, 0xc429076209, 0x38, 0x4dcdd86, 0x6, 0xc4297fa040, 0x40, 0x0, ...)
    /go/src/k8s.io/kubernetes/_output/dockerized/go/src/k8s.io/kubernetes/pkg/kubelet/network/plugins.go:395 +0x13d
k8s.io/kubernetes/pkg/kubelet/dockershim.(*dockerService).getIPFromPlugin(0xc4217c4500, 0xc429e21050, 0x40, 0xed3bf0000, 0x1af5b22d, 0xed3bf0bc6)
    /go/src/k8s.io/kubernetes/_output/dockerized/go/src/k8s.io/kubernetes/pkg/kubelet/dockershim/docker_sandbox.go:304 +0x1c6
k8s.io/kubernetes/pkg/kubelet/dockershim.(*dockerService).getIP(0xc4217c4500, 0xc4240d9dc0, 0x40, 0xc429e21050, 0xe55ef53, 0xed3bf0bc7)
    /go/src/k8s.io/kubernetes/_output/dockerized/go/src/k8s.io/kubernetes/pkg/kubelet/dockershim/docker_sandbox.go:333 +0xc4
k8s.io/kubernetes/pkg/kubelet/dockershim.(*dockerService).PodSandboxStatus(0xc4217c4500, 0xb38ad20, 0xc429e20ed0, 0xc4216214c0, 0xc4217c4500, 0x1, 0x0)
    /go/src/k8s.io/kubernetes/_output/dockerized/go/src/k8s.io/kubernetes/pkg/kubelet/dockershim/docker_sandbox.go:398 +0x291
k8s.io/kubernetes/pkg/kubelet/apis/cri/runtime/v1alpha2._RuntimeService_PodSandboxStatus_Handler(0x4d789e0, 0xc4217c4500, 0xb38ad20, 0xc429e20ed0, 0xc425afaf00, 0x0, 0x0, 0x0, 0x0, 0x2)
    /go/src/k8s.io/kubernetes/_output/dockerized/go/src/k8s.io/kubernetes/pkg/kubelet/apis/cri/runtime/v1alpha2/api.pb.go:4146 +0x276
k8s.io/kubernetes/vendor/google.golang.org/grpc.(*Server).processUnaryRPC(0xc420294640, 0xb399760, 0xc421940000, 0xc4264d8900, 0xc420d894d0, 0xb335000, 0x0, 0x0, 0x0)
    /go/src/k8s.io/kubernetes/_output/dockerized/go/src/k8s.io/kubernetes/vendor/google.golang.org/grpc/server.go:843 +0xab4
k8s.io/kubernetes/vendor/google.golang.org/grpc.(*Server).handleStream(0xc420294640, 0xb399760, 0xc421940000, 0xc4264d8900, 0x0)
    /go/src/k8s.io/kubernetes/_output/dockerized/go/src/k8s.io/kubernetes/vendor/google.golang.org/grpc/server.go:1040 +0x1528
k8s.io/kubernetes/vendor/google.golang.org/grpc.(*Server).serveStreams.func1.1(0xc42191c020, 0xc420294640, 0xb399760, 0xc421940000, 0xc4264d8900)
    /go/src/k8s.io/kubernetes/_output/dockerized/go/src/k8s.io/kubernetes/vendor/google.golang.org/grpc/server.go:589 +0x9f
created by k8s.io/kubernetes/vendor/google.golang.org/grpc.(*Server).serveStreams.func1
    /go/src/k8s.io/kubernetes/_output/dockerized/go/src/k8s.io/kubernetes/vendor/google.golang.org/grpc/server.go:587 +0xa1
I notice the number of goroutines stuck in this stack is growing steadily over time (About an extra 1 every 2 minutes)
The nodes that experience this typically have a Pod stuck in Terminating - when I restart kubelet the Terminating pod goes and I no longer see the PLEG issues.
@pnovotnak any ideas if this sounds like the same issue that should be fixed by the change to add Timeout to CNI, or something else? Seems to be similar symptoms in networking area..
 mcginne
on 21 Jan 2019
mcginne
on 21 Jan 2019
I have the same question: https://github.com/kubernetes/kubernetes/issues/45419#issuecomment-439267946
Which version of kubernetes-cni will include the fix? Thanks!
warmchang
on 1 Mar 2019
@warmchang the kubernetes-cni plugins package is not relevant. The change required is in libcni, which is vendored (copied into this repo) from https://github.com/containernetworking/cni.
The change is merged; no release is necessary (although it might make people feel better).
bboreham
on 1 Mar 2019
@bboreham Thank you for reply.
I mean the CNI code (libcni) in the vendor directory, not the CNI plugin (like flannel/calico, etc.).
And I found this PR https://github.com/kubernetes/kubernetes/pull/71653 which is waiting for approve.
warmchang
on 1 Mar 2019
/milestone v1.14
nikopen
on 1 Mar 2019
I meet this issue , my env:
docker 18.06
os: centos7.4
kernel: 4.19
kubelet: 1.12.3
my nodes were flapping between Ready and Not Ready.
This before , I have delete some pods with ---force --grace-period=0. because the pod i delete still in terminating status .
then ,I found some logs in kubelet :
kubelet[10937]: I0306 19:23:32.474487 10937 handlers.go:62] Exec lifecycle hook ([/home/work/webserver/loadnginx.sh stop]) for Container "odp-saas" in Pod " saas-56bd6d8588-xlknh(15ebc67d-3bed-11e9-ba81-246e96352590)" failed - error: command '/home/work/webserver/loadnginx.sh stop' exited with 126: , message: "unable to find user work: no matching entries in passwd file\r\n"_
because I use the lifecycle section prestop command in deployment .
#lifecycle:
# preStop:
# exec:
# #SIGTERM triggers a quick exit; gracefully terminate instead
# command: ["/home/work/webserver/loadnginx.sh","stop"]
and other log show that:
kubelet[17119]: E0306 19:35:11.223925 17119 remote_runtime.go:282] ContainerStatus "cbc957993825885269935a343e899b807ea9a49cb9c7f94e68240846af3e701d" from runti
kubelet[17119]: E0306 19:35:11.223970 17119 kuberuntime_container.go:393] ContainerStatus for cbc957993825885269935a343e899b807ea9a49cb9c7f94e68240846af3e701d e
kubelet[17119]: E0306 19:35:11.223978 17119 kuberuntime_manager.go:866] getPodContainerStatuses for pod "gz-saas-56bd6d8588-sk88t_storeic(1303430e-3ffa-11e9-ba8
kubelet[17119]: E0306 19:35:11.223994 17119 generic.go:241] PLEG: Ignoring events for pod saas-56bd6d8588-sk88t/storeic: rpc error: code = DeadlineExceeded d
kubelet[17119]: E0306 19:35:11.224123 17119 pod_workers.go:186] Error syncing pod 1303430e-3ffa-11e9-ba81-246e96352590 ("gz-saas-56bd6d8588-sk88t_storeic(130343
Mkubelet[17119]: E0306 19:35:12.509163 17119 remote_runtime.go:282] ContainerStatus "4ff7ff8e1eb18ede5eecbb03b60bdb0fd7f7831d8d7e81f59bc69d166d422fb6" from runti
kubelet[17119]: E0306 19:35:12.509163 17119 remote_runtime.go:282] ContainerStatus "cbc957993825885269935a343e899b807ea9a49cb9c7f94e68240846af3e701d" from runti
kubelet[17119]: E0306 19:35:12.509220 17119 kubelet_pods.go:1086] Failed killing the pod "saas-56bd6d8588-rsfh5": failed to "KillContainer" for "saas" wi
kubelet[17119]: E0306 19:35:12.509230 17119 kubelet_pods.go:1086] Failed killing the pod "saas-56bd6d8588-sk88t": failed to "KillContainer" for "saas" wi
kubelet[17119]: I0306 19:35:12.788887 17119 kubelet.go:1821] skipping pod synchronization - [PLEG is not healthy: pleg was last seen active 4m1.597223765s ago;
k8s can not stop the container , these containers got in stuck status . this cause the PLEG not healthy .
finnally , I restart the docker daemon which have the error container , the node recover to ready .
I don't know why the container can not stop !!! may be the prestop ?
 Damien9527
on 6 Mar 2019
Damien9527
on 6 Mar 2019
/milestone v1.15
nikopen
on 11 Mar 2019
+1
k8s v1.10.5
docker 17.09.0-ce
 hello2mao
on 22 Mar 2019
hello2mao
on 22 Mar 2019
+1
k8s v1.12.3
docker 18.06.2-ce
 zhan849
on 11 Apr 2019
zhan849
on 11 Apr 2019
+1
k8s v1.13.4
docker-1.13.1-94.gitb2f74b2.el7.x86_64
 Wade201801
on 16 Apr 2019
Wade201801
on 16 Apr 2019
@kubernetes/sig-network-bugs @thockin @spiffxp: Friendly ping. This seems to have stalled again.
calder
on 19 Apr 2019
@calder: Reiterating the mentions to trigger a notification:
@kubernetes/sig-network-bugs
In response to this:
@kubernetes/sig-network-bugs @thockin @spiffxp: Friendly ping. This seems to have stalled again.
Instructions for interacting with me using PR comments are available here. If you have questions or suggestions related to my behavior, please file an issue against the kubernetes/test-infra repository.
 k8s-ci-robot
on 19 Apr 2019
k8s-ci-robot
on 19 Apr 2019
Hello,
We also found this issue on one of our platform. The only difference we had with other clusters is that it only had a single master node. And indeed, we recreated the cluster with 3 masters and we haven't noticed the issue so far (few days now).
So I guess my question is: has anybody noticed this issue on a multi-master (>=3) cluster?
 Kanshiroron
on 29 Apr 2019
Kanshiroron
on 29 Apr 2019
@Kanshiroron yes, we have a 3 master cluster and ran into this issue on one worker node yesterday. We drained the node and restarted it and it's come back cleanly. Platform is Docker EE with k8s v1.11.8 and Docker Enterprise 18.09.2-ee
 mshade
on 1 May 2019
mshade
on 1 May 2019
We have a 3-master cluster (with a 3-node etcd cluster). There are 18 worker nodes, and each of the nodes is running between 50-100 docker containers on average (not pods, but total containers).
I am seeing a definite positive correlation between sizeable pod spinup events and needing to reboot a node because of PLEG errors. On occasion, some of our spin-ups cause the creation of >100 containers across the infrastructure, and when this happens, we almost always see resulting PLEG errors.
Do we have an understanding of what is causing this, on a node or a cluster level?
 standaloneSA
on 8 May 2019
standaloneSA
on 8 May 2019
I am a little disconnected from this -- do we know what is going on? Is there a fix @bboreham (since you seemed to know what was up)? Is there a PR?
 thockin
on 9 May 2019
thockin
on 9 May 2019
I suspect this symptom can be caused in many ways, and we don't have much to go on for most of the "I have the same problem" comments here.
One of those ways was detailed at https://github.com/kubernetes/kubernetes/issues/45419#issuecomment-405168344 and similar at https://github.com/kubernetes/kubernetes/issues/45419#issuecomment-456081337 - calls into CNI could hang forever, breaking Kubelet. Issue #65743 says we should add a timeout.
To address this we decided to plumb a Context through into libcni so that cancellation could be implemented by exec.CommandContext(). PR #71653 adds a timeout on the CRI side of that API.
(for clarity: no change to CNI plugins is involved; this is a change to the code that executes the plugin)
bboreham
on 9 May 2019
Okay, got a chance to do some debugging on a PLEG swarm (what we've been calling this lately), and I found some correlations between PLEG errors reported by K8s and entries in the Docker.service log:
On two servers, I found this:
From the script that was watching for errors:
Sat May 11 03:27:19 PDT 2019 - SERVER-A
Found:   Ready            False     Sat, 11 May 2019 03:27:10 -0700   Sat, 11 May 2019 03:13:16 -0700   KubeletNotReady              PLEG is not healthy: pleg was last seen active 16m53.660513472s ago; threshold is 3m0s
The matching entries in SERVER-A's output from 'journalctl -u docker.service':
May 11 03:10:20 SERVER-A dockerd[1133]: time="2019-05-11T03:10:20.641064617-07:00" level=error msg="stream copy error: reading from a closed fifo"
May 11 03:10:20 SERVER-A dockerd[1133]: time="2019-05-11T03:10:20.641083454-07:00" level=error msg="stream copy error: reading from a closed fifo"
May 11 03:10:20 SERVER-A dockerd[1133]: time="2019-05-11T03:10:20.740845910-07:00" level=error msg="Error running exec a9fe257c0fca6ff3bb05a7582015406e2f7f6a7db534b76ef1b87d297fb3dcb9 in container: OCI runtime exec failed: exec failed: container_linux.go:344: starting container process caused \"process_linux.go:113: writing config to pipe caused \\\"write init-p: broken pipe\\\"\": unknown"
May 11 03:10:20 SERVER-A dockerd[1133]: time="2019-05-11T03:10:20.767528843-07:00" level=info msg="ignoring event" module=libcontainerd namespace=moby topic=/tasks/delete type="*events.TaskDelete"
27 lines of this^^ repeated
Then, on a different server, from my script:
Sat May 11 03:38:25 PDT 2019 - SERVER-B
Found:   Ready            False     Sat, 11 May 2019 03:38:16 -0700   Sat, 11 May 2019 03:38:16 -0700   KubeletNotReady              PLEG is not healthy: pleg was last seen active 3m6.168050703s ago; threshold is 3m0s
and from the docker journal:
May 11 03:35:25 SERVER-B dockerd[1102]: time="2019-05-11T03:35:25.745124988-07:00" level=error msg="stream copy error: reading from a closed fifo"
May 11 03:35:25 SERVER-B dockerd[1102]: time="2019-05-11T03:35:25.745139806-07:00" level=error msg="stream copy error: reading from a closed fifo"
May 11 03:35:25 SERVER-B dockerd[1102]: time="2019-05-11T03:35:25.803182460-07:00" level=error msg="1a5dbb24b27cd516373473d34717edccc095e712238717ef051ce65022e10258 cleanup: failed to delete container from containerd: no such container"
May 11 03:35:25 SERVER-B dockerd[1102]: time="2019-05-11T03:35:25.803267414-07:00" level=error msg="Handler for POST /v1.38/containers/1a5dbb24b27cd516373473d34717edccc095e712238717ef051ce65022e10258/start returned error: OCI runtime create failed: container_linux.go:344: starting container process caused \"process_linux.go:297: getting the final child's pid from pipe caused \\\"EOF\\\"\": unknown"
May 11 03:35:25 SERVER-B dockerd[1102]: time="2019-05-11T03:35:25.876522066-07:00" level=info msg="ignoring event" module=libcontainerd namespace=moby topic=/tasks/delete type="*events.TaskDelete"
May 11 03:35:25 SERVER-B dockerd[1102]: time="2019-05-11T03:35:25.964447832-07:00" level=info msg="ignoring event" module=libcontainerd namespace=moby topic=/tasks/delete type="*events.TaskDelete"
Unfortunately, when validating this across my "healthy" nodes, I can find instances of these occurring together as well.
I will work to correlate this with other variables, but searching for these error messages leads to some interesting discussions:
Docker-ce 18.06.1-ce-rc2: can't run a container, "stream copy error: reading from a closed fifo"
Kubernetes: Increase maximum pods per node #23349
That last link has an especially interesting comment by @dElogics (referencing this ticket):
Just to add some valuable information, running many many pods per node results in #45419. As a fix, delete the docker directory and restart docker and kubelet together.
standaloneSA
on 11 May 2019
In my case, I'm using K8s v1.10.2 and docker-ce v18.03.1. I find some logs of kubelet that running on node flapping Ready/NotReady like:
E0512 09:17:56.721343 4065 pod_workers.go:186] Error syncing pod e5b8f48a-72c2-11e9-b8bf-005056871a33 ("uac-ddfb6d878-f6ph2_default(e5b8f48a-72c2-11e9-b8bf-005056871a33)"), skipping: rpc error: code = DeadlineExceeded desc = context deadline exceeded
E0512 09:17:17.154676 4065 kuberuntime_manager.go:859] PodSandboxStatus of sandbox "a34943dabe556924a2793f1be2f7181aede3621e2c61daef0838cf3fc61b7d1b" for pod "uac-ddfb6d878-f6ph2_default(e5b8f48a-72c2-11e9-b8bf-005056871a33)" error: rpc error: code = DeadlineExceeded desc = context deadline exceeded
And I found this pod uac-ddfb6d878-f6ph2_default is terminating, so my workaround solution is I force delete pod and remove all containers of this pod on that node and this node works fine after that:
$ kubectl delete pod uac-ddfb6d878-f6ph2 --force --grace-period=0
$ docker ps -a | grep uac-ddfb6d878-f6ph2_default
 thaonguyenct
on 12 May 2019
thaonguyenct
on 12 May 2019
Hello! We have started Bug Freeze for 1.15. Is this issue still planned on being incorporated into 1.15?
 soggiest
on 29 May 2019
soggiest
on 29 May 2019
Hi there
We were experiencing this same problem on our OKD cluster.
We investigated the nodes that were flapping and, after some digging, we found what we believed to be our problem.
When we investigated the node flapping, we found that the nodes that were flapping were having absurdly high average load values, one of the nodes (16 cores, 32 threads, 96GB memory) had an average load value of, at its peak, 850.
Three of our nodes have Rook Ceph running on them.
We discovered that Prometheus was using block storage from Rook Ceph and was flooding the block devices with Read/Writes.
At the same time, ElasticSearch was also using block storage from Rook Ceph. We found that ElasticSearch processes would attempt to perform a disk I/O operation, while Prometheus was flooding the block devices, and would enter an uninterruptible state while waiting for the I/O operation to finish.
Then another ES process would attempt the same.
Then another.
And another.
We'd enter into a state where our node's entire CPU had reserved threads for ES processes that were in uninterruptible states waiting for the Ceph block device to free up from the Prometheus flooding.
Even though the CPU wasn't at 100% load, the threads were being reserved.
This caused all other processes to wait for CPU time, which caused any Docker operations to fail, which caused PLEG to time out, and the node begins flapping.
Our solution was to reboot the offending Prometheus pod.
OKD/K8s version:
$ oc version
oc v3.11.0+0cbc58b
kubernetes v1.11.0+d4cacc0
features: Basic-Auth GSSAPI Kerberos SPNEGO

Server https://okd.example.net:8443
openshift v3.11.0+d0f1080-153
kubernetes v1.11.0+d4cacc0
Docker version on node:
$ docker version
Client:
 Version:         1.13.1
 API version:     1.26
 Package version: docker-1.13.1-88.git07f3374.el7.centos.x86_64
 Go version:      go1.9.4
 Git commit:      07f3374/1.13.1
 Built:           Fri Dec  7 16:13:51 2018
 OS/Arch:         linux/amd64

Server:
 Version:         1.13.1
 API version:     1.26 (minimum version 1.12)
 Package version: docker-1.13.1-88.git07f3374.el7.centos.x86_64
 Go version:      go1.9.4
 Git commit:      07f3374/1.13.1
 Built:           Fri Dec  7 16:13:51 2018
 OS/Arch:         linux/amd64
 Experimental:    false
Edit:
To summarize: I don't think this is a K8s/OKD problem, I think this is a "some resource on your node is being locked by something which is causing processes to pile up waiting for CPU time and that's breaking everything" problem.
 rblaine95
on 29 May 2019
rblaine95
on 29 May 2019
/milestone v1.16
soggiest
on 7 Jun 2019
@bboreham @soggiest Hello! I'm bug triage shadow for the 1.16 release cycle and considering this issue is tagged for 1.16, but not updated for a long time, I'd like to check its status. The code freeze is starting on August 29th (about 1.5 weeks from now), which means that there should be a PR ready (and merged) until then.
Do we still target this issue to be fixed for 1.16?
 makoscafee
on 23 Aug 2019
makoscafee
on 23 Aug 2019
@makoscafee Can confirm this doesn't happen anymore in 1.13.6 (and further versions) and docker 18.06.3-ce
For us, this seems to be somehow related to a Timeout while calling CNI or some external integration.
We've faced this recently but with other scenario, while some of the NFS servers used in our cluster cracked (and the whole I/O from our nodes has freezed), kubelet started printing PLEG issues related with the inability to start newer containers because of I/O timeout.
So this might be a sign that, with CNI and CRI this is PROBABLY solved, as we didn't saw this again in our cluster related to Network issues.
rikatz
on 26 Aug 2019
@makoscafee as I commented before, there are many people reporting many things in this issue; I shall answer here on the specific point of timing-out a CNI request.
From looking at the code, I do not think kubelet has been updated to use the new behaviour in CNI where the context can be cancelled.
E.g. calling CNI here: https://github.com/kubernetes/kubernetes/blob/038e5fad7596d50f449f1c6f8625171a8acfc586/pkg/kubelet/dockershim/network/cni/cni.go#L348
This PR would add a timeout: #71653, but is still outstanding.
I can't speak for what would have changed in 1.13.6 to cause @rikatz experience.
bboreham
on 26 Aug 2019
Indeed, I've had a lot of upgrades in Calico since then, maybe something there (and not in Kubernetes Code) has changed. Also Docker (which might also be a problem in that time) was upgraded numerous times, so no right path to follow here
I feel some shame here of not taking notes that time when the issue happened (sorry about that) to at least tell you what changed from there to our problems today.
rikatz
on 26 Aug 2019
Hi all,
Just wanted to share our experience with this error.
We encountered this error on a freshly deployed cluster running docker EE 19.03.1 and k8s v1.14.3.
For us it seems that the issue was triggered by the logging driver. Our docker engine is setup to use fluentd logging driver. After the fresh deployment of the cluster fluentd was not yet deployed. If at this point we tried to schedule any pods on the workers we encountered the same behavior you guys described above (PLEG error on kubelet containers on the worker nodes and worker nodes randomly being reported unhealthy)
However, once we deployed fluentd and docker was able to make the connection to it all the issues went away. So it seems that not being able to communicate with fluentd was the root cause.
Hope this helps. Cheers
 dariuscernea
on 27 Aug 2019
dariuscernea
on 27 Aug 2019
This has been a long standing issue (k8s 1.6!) and has troubled quite a few people working with k8s.
Apart from overloaded nodes (max cpu%, io, interrupts), PLEG issues are sometimes caused by nuanced issues between kubelet, docker, logging, networking and so on, with remediation of the issue sometimes being brutal (restarting all nodes etc, depending on the case).
As far as the original post goes, with https://github.com/kubernetes/kubernetes/pull/71653 finally being merged, kubelet is updated and now is able to timeout a CNI request, cancelling the context before the deadline is exceeded.
Kubernetes 1.16 will contain the fix.
I will also open PRs to cherry-pick this back to 1.14 and 1.15 as they do have a CNI version that contains the new timeout feature ( >= 0.7.0 ). 1.13 has an older CNI v without the feature.
Thus, this can be finally closed.
/close
nikopen
on 28 Aug 2019
@nikopen: Closing this issue.
In response to this:
This has been a long standing issue (k8s 1.6!) and has troubled quite a few people working with k8s.
There are various things that cause PLEG issues and have generally been complicated between kubelet, docker, logging, networking and so on, with remediation of the issue sometimes being brutal (restarting all nodes etc, depending on the case).
As far as the original post goes, with https://github.com/kubernetes/kubernetes/pull/71653 finally being merged, kubelet is updated and now is able to timeout a CNI request, cancelling the context before the deadline is exceeded.
Kubernetes 1.16 will contain the fix.
I will also open PRs to cherry-pick this back to 1.14 and 1.15 as they do have a CNI version that contains the new timeout feature ( >= 0.7.0 ). 1.13 has an older CNI v without the feature.Thus, this can be finally closed.
/close
Instructions for interacting with me using PR comments are available here. If you have questions or suggestions related to my behavior, please file an issue against the kubernetes/test-infra repository.
k8s-ci-robot
on 28 Aug 2019
From personal experience since 1.6 in production, PLEG issues usually show up when a node is drowning.
- CPU load is sky high
- Disk I/O is maxed (logging?)
- Global overload (CPU+disk+network) => CPU is interrupted all the time
Result => Docker daemon is not responsive
 Misteur-Z
on 28 Aug 2019
Misteur-Z
on 28 Aug 2019
From personal experience since
1.6in production, PLEG issues usually show up when a node is drowning.
- CPU load is sky high
- Disk I/O is maxed (logging?)
- Global overload (CPU+disk+network) => CPU is interrupted all the time
Result => Docker daemon is not responsive
I agree with this, I use the 1.14.5 version Kubernetes, has the same issue.
 Aisuko
on 6 Sep 2019
Aisuko
on 6 Sep 2019
same issue with v1.13.10 run in calico network.
 zx1986
on 19 Sep 2019
zx1986
on 19 Sep 2019
/open
@nikopen: it seems that the PR is for 1.17? I haven't found the PR number in the changelog for 1.16.1.
 pdhung
on 7 Oct 2019
pdhung
on 7 Oct 2019
I don't seen this issue mentioned in the changelog for 1.14. Does that mean it was not cherry picked (yet)? Will it be?
 kwaazaar
on 24 Oct 2019
kwaazaar
on 24 Oct 2019
Recover from PLEG is not healthy issue
Disable docker and kubelet auto start, reboot and then clean the kubelet pods and docker files:
systemctl disable docker && systemctl disable kubelet
reboot
rm -rf /var/lib/kubelet/pods/
rm -rf /var/lib/docker
start and enable docker
systemctl start docker && systemctl enable docker
systemctl status docker
Because /var/lib/docker has been cleaned, please import the necessary images manually if the node can't connect to k8s images library.
docker load -i xxx.tar
start Kubelet
systemctl start kubelet && systemctl enable kubelet
systemctl status kubelet
 jackie-qiu
on 14 Nov 2019
jackie-qiu
on 14 Nov 2019
@jackie-qiu Better blow up your server with a grenade or drop it form the 10th floor, just to make sure the issue never happens again...
adampl
on 14 Nov 2019
same issue with v1.15.6 run in flannel network.
 leowucn
on 27 Nov 2019
leowucn
on 27 Nov 2019
I don't have a lot to add concerning what causes the issue as it seems that everything had already been written here. We're using an old version of server 1.10.13. We've tried to upgrade but it is not that trivial to do.
For us it happens mainly in one of the production environments and very rear at our development environment. On that production environment, where it is constantly reproduced, it happens only during rolling update and only for two certain pods (never when other pods are being deleted during the rolling update). On our development environment it happened to other pods.
The only thing i see in the logs is:
When it succeeds:
Nov 27 11:34:45 ip-172-31-174-8 kubelet[8024]: 2019-11-27 11:34:45.453 [INFO][1946] client.go 202: Loading config from environment
Nov 27 11:34:45 ip-172-31-174-8 kubelet[8024]: 2019-11-27 11:34:45.454 [INFO][1946] calico-ipam.go 249: Releasing address using handleID handleID="k8s-pod-network.e923743c5dc4833e606bf16f388c564c20c4c1373b18881d8ea1c8eb617f6e62" workloadID="default.good-pod-name-557644b486-7rxw5"
Nov 27 11:34:45 ip-172-31-174-8 kubelet[8024]: 2019-11-27 11:34:45.454 [INFO][1946] ipam.go 738: Releasing all IPs with handle 'k8s-pod-network.e923743c5dc4833e606bf16f388c564c20c4c1373b18881d8ea1c8eb617f6e62'
Nov 27 11:34:45 ip-172-31-174-8 kubelet[8024]: 2019-11-27 11:34:45.498 [INFO][1946] ipam.go 877: Decremented handle 'k8s-pod-network.e923743c5dc4833e606bf16f388c564c20c4c1373b18881d8ea1c8eb617f6e62' by 1
Nov 27 11:34:45 ip-172-31-174-8 kubelet[8024]: 2019-11-27 11:34:45.498 [INFO][1946] calico-ipam.go 257: Released address using handleID handleID="k8s-pod-network.e923743c5dc4833e606bf16f388c564c20c4c1373b18881d8ea1c8eb617f6e62" workloadID="default.good-pod-name-557644b486-7rxw5"
Nov 27 11:34:45 ip-172-31-174-8 kubelet[8024]: 2019-11-27 11:34:45.498 [INFO][1946] calico-ipam.go 261: Releasing address using workloadID handleID="k8s-pod-network.e923743c5dc4833e606bf16f388c564c20c4c1373b18881d8ea1c8eb617f6e62" workloadID="default.good-pod-name-557644b486-7rxw5"
Nov 27 11:34:45 ip-172-31-174-8 kubelet[8024]: 2019-11-27 11:34:45.498 [INFO][1946] ipam.go 738: Releasing all IPs with handle 'default.good-pod-name-557644b486-7rxw5'
Nov 27 11:34:45 ip-172-31-174-8 kubelet[8024]: Calico CNI deleting device in netns /proc/6337/ns/net
Nov 27 11:34:45 ip-172-31-174-8 kubelet[8024]: 2019-11-27 11:34:45.590 [INFO][1929] k8s.go 379: Teardown processing complete. Workload="default.good-pod-name-557644b486-7rxw5""
When it fails:
Nov 27 11:46:49 ip-172-31-174-8 kubelet[8024]: 2019-11-27 11:46:49.681 [INFO][5496] client.go 202: Loading config from environment
Nov 27 11:46:49 ip-172-31-174-8 kubelet[8024]: 2019-11-27 11:46:49.681 [INFO][5496] calico-ipam.go 249: Releasing address using handleID handleID="k8s-pod-network.3afc7f2064dc056cca5bb8c8ff20c81aaf6ee8b45a1346386c239b92527b945b" workloadID="default.bad-pod-name-5fc88df4b-rkw7m"
Nov 27 11:46:49 ip-172-31-174-8 kubelet[8024]: 2019-11-27 11:46:49.681 [INFO][5496] ipam.go 738: Releasing all IPs with handle 'k8s-pod-network.3afc7f2064dc056cca5bb8c8ff20c81aaf6ee8b45a1346386c239b92527b945b'
Nov 27 11:46:49 ip-172-31-174-8 kubelet[8024]: 2019-11-27 11:46:49.716 [INFO][5496] ipam.go 877: Decremented handle 'k8s-pod-network.3afc7f2064dc056cca5bb8c8ff20c81aaf6ee8b45a1346386c239b92527b945b' by 1
Nov 27 11:46:49 ip-172-31-174-8 kubelet[8024]: 2019-11-27 11:46:49.716 [INFO][5496] calico-ipam.go 257: Released address using handleID handleID="k8s-pod-network.3afc7f2064dc056cca5bb8c8ff20c81aaf6ee8b45a1346386c239b92527b945b" workloadID="default.bad-pod-name-5fc88df4b-rkw7m"
Nov 27 11:46:49 ip-172-31-174-8 kubelet[8024]: 2019-11-27 11:46:49.716 [INFO][5496] calico-ipam.go 261: Releasing address using workloadID handleID="k8s-pod-network.3afc7f2064dc056cca5bb8c8ff20c81aaf6ee8b45a1346386c239b92527b945b" workloadID="default.bad-pod-name-5fc88df4b-rkw7m"
Nov 27 11:46:49 ip-172-31-174-8 kubelet[8024]: 2019-11-27 11:46:49.716 [INFO][5496] ipam.go 738: Releasing all IPs with handle 'default.bad-pod-name-5fc88df4b-rkw7m'
Nov 27 11:46:49 ip-172-31-174-8 kubelet[8024]: Calico CNI deleting device in netns /proc/7376/ns/net
Nov 27 11:46:51 ip-172-31-174-8 ntpd[8188]: Deleting interface #1232 cali8e016aaff48, fe80::ecee:eeff:feee:eeee%816#123, interface stats: received=0, sent=0, dropped=0, active_time=242773 secs
Nov 27 11:46:59 ip-172-31-174-8 kernel: [11155281.312094] unregister_netdevice: waiting for eth0 to become free. Usage count = 1
 gilShin
on 2 Dec 2019
gilShin
on 2 Dec 2019
Has anyone upgraded to v1.16? Can someone confirm if this is fixed and you are not seeing PLEG issue anymore. We frequently see this issue in production and the only option is to reboot the node.
 ganeshv02
on 5 Dec 2019
ganeshv02
on 5 Dec 2019
I have a question concerning the fix.
Let's say I'm installing the newer version which includes the timeout fix. I understand that it'll release the kublet and we'll allow the pod that is stuck in Terminating state to go down but will it also release the eth0? Will new pods be able to run on that node or will it stay in ready/not ready state?
gilShin
on 5 Dec 2019
For me, Docker 19.03.4 fixed both pods stuck in Terminating state and nodes flapping between Ready/NotReady with PLEG issues.
Kubernetes version did not change from 1.15.6. The only change in the cluster was the newer Docker.
 hakman
on 5 Dec 2019
hakman
on 5 Dec 2019
Upgraded kernel of Ubuntu 16.04 from 4.4 to 4.15. It took three days for the error to reoccur.
I'll see if I can upgrade the docker version from 17 to 19 as hakman suggested on a Ubuntu 16.04.
I prefer not to upgrade Ubuntu version.
gilShin
on 15 Dec 2019
There's no way to upgrade docker to 19 with k8s 1.10. We'll need to upgrade to 1.15 first which will take a while because there's no way to upgrade to 1.15 strait. We'll need to upgrade one by one 1.10 -> 1.11 -> 1.12 etc'
gilShin
on 15 Dec 2019
The PLEG health check does very little. In every iteration, it calls
docker psto detect container states changes, and calldocker psandinspectto get the details of those containers.
After finishing each iteration, it updates a timestamp. If the timestamp hasn't been updated for a while (i.e., 3 minutes), the health check fails.Unless your node is loaded with huge number of pods that PLEG can't finish doing all these in 3 minutes (which should not happen), the most probable cause would be that docker is slow. You may not observe that in your occasional
docker pscheck, but that doesn't mean it's not there.If we don't expose the "unhealthy" status, it'd hide many problems from the users and potentially cause more issue. For example, kubelet'd silently not reacting to changes in a timely manner and cause even more confusion.
Suggestions on how to make this more debuggable are welcome...
This has been a long standing issue (k8s 1.6!) and has troubled quite a few people working with k8s.
Apart from overloaded nodes (max cpu%, io, interrupts), PLEG issues are sometimes caused by nuanced issues between kubelet, docker, logging, networking and so on, with remediation of the issue sometimes being brutal (restarting all nodes etc, depending on the case).
As far as the original post goes, with #71653 finally being merged, kubelet is updated and now is able to timeout a CNI request, cancelling the context before the deadline is exceeded.
Kubernetes 1.16 will contain the fix.
I will also open PRs to cherry-pick this back to 1.14 and 1.15 as they do have a CNI version that contains the new timeout feature ( >= 0.7.0 ). 1.13 has an older CNI v without the feature.Thus, this can be finally closed.
/close
I'm confused...if this issued can be caused by a slow docker daemon, how come it can be fixed by simply adding a timeout to cni calls?
 jmf0526
on 30 Dec 2019
jmf0526
on 30 Dec 2019
I am using containerd + kubernetes 1.16, this still happen easily when I have 191 containers per node. How about increase the threshold? Or any better solutions? @yujuhong
 haosdent
on 31 Jan 2020
haosdent
on 31 Jan 2020
@haosdent Check if the fix has been merged into your version of Kubernetes. If it's on 1.16 at all, then it must be the latest release. Or upgrade to 1.17 and you will have it 100%.
adampl
on 2 Feb 2020
Having had the same question as @haosdent, I went looking to see if #71653 has been backported.
- #71653 was backported to v1.16 (PR: #86825). It's included in v1.16.7 (changelog).
- It doesn't appear to have been backported to v1.15 or earlier (PR search, v1.15 changelog).
So it seems like v1.16.7 or v1.17.0 are the minimum k8s releases required to get that fix.
 david-in-perth
on 17 Mar 2020
david-in-perth
on 17 Mar 2020
We running v1.16.7 with minimal load on AWS provisioned by kops with the kops debian image upgraded kernel to 4.19 using cilium v1.6.5.
:man_shrugging: So it is still there :/
But have to investigate further.
_sidenote_ happened also with ubuntu provisioned by kubespray with v1.16.4
For now, a node reboot resolves it for a short amount of time.
Only happened with c5.large ec2 nodes
Docker was in both cases 18.04. So I will try to upgrade docker to 19.03.4 as mentioned above.
 fentas
on 2 Apr 2020
fentas
on 2 Apr 2020
The problem could be also caused by old version systemd, try upgrade systemd.
ref:
https://my.oschina.net/yunqi/blog/3041189 (chinese only)
https://github.com/lnykryn/systemd-rhel/pull/322
 hulucc
on 8 Apr 2020
hulucc
on 8 Apr 2020
We also see this issue in 1.16.8 + docker 18.06.2
# docker info
Containers: 186
 Running: 155
 Paused: 0
 Stopped: 31
Images: 48
Server Version: 18.06.2-ce
Storage Driver: overlay2
 Backing Filesystem: extfs
 Supports d_type: true
 Native Overlay Diff: true
Logging Driver: json-file
Cgroup Driver: cgroupfs
Plugins:
 Volume: local
 Network: bridge host macvlan null overlay
 Log: awslogs fluentd gcplogs gelf journald json-file logentries splunk syslog
Swarm: inactive
Runtimes: nvidia runc
Default Runtime: nvidia
Init Binary: docker-init
containerd version: 468a545b9edcd5932818eb9de8e72413e616e86e
runc version: 6635b4f0c6af3810594d2770f662f34ddc15b40d-dirty (expected: 69663f0bd4b60df09991c08812a60108003fa340)
init version: fec3683
Security Options:
 apparmor
 seccomp
  Profile: default
Kernel Version: 5.0.0-1027-aws
Operating System: Ubuntu 18.04.4 LTS
OSType: linux
Architecture: x86_64
CPUs: 48
Total Memory: 373.8GiB
Name: node-cmp-test-kubecluster-2-0a03fdfa
ID: E74R:BMMI:XOFX:BK4X:53AT:JQLZ:CDF6:M6X7:J56G:2DTZ:OTRK:5OJB
Docker Root Dir: /mnt/docker
Debug Mode (client): false
Debug Mode (server): false
Registry: https://index.docker.io/v1/
Labels:
Experimental: false
Insecure Registries:
 127.0.0.0/8
Live Restore Enabled: true

WARNING: No swap limit support
See docker can encounter timeout in writing to file socket way before PLEG not healthy and node flap. In this case, kernel is able to kill the stuck process and the node can recover. but in many other cases we see, node is not able to recover and not even can be ssh-ed, so maybe also a combination of different problems.
One biggest pain point is that, as a platform provider, docker can go wrong way before PLEG is reported as "Unhealthy" so it's always user reporting the error to us instead of we proactively detect the issue and clean up mess for user. When the problem happens, 2 interesting phenomenon in metrics:
- CRI metrics don't show a spike in QPS before the issue happens
- After the issue happens there is no metrics generated from kubelet (our monitoring backend does not receive anything but such PLEG not healthy issue usually come with node not ssh-able so lack of debugging datapoint here)
We are looking into docker metrics and see if any alert can be set on that.
May 8 16:32:25 node-k8s-use1-prod-shared-001-kubecluster-3-0a0c414b dockerd[1747]: time="2020-05-08T16:32:25Z" level=info msg="shim reaped" id=522fbf813ab6c63b17f517a070a5ebc82df7c8f303927653e466b2d12974cf45
--
May 8 16:32:25 node-k8s-use1-prod-shared-001-kubecluster-3-0a0c414b dockerd[1747]: time="2020-05-08T16:32:25.557712045Z" level=info msg="ignoring event" module=libcontainerd namespace=moby topic=/tasks/delete type="*events.TaskDelete"
May 8 16:32:26 node-k8s-use1-prod-shared-001-kubecluster-3-0a0c414b dockerd[1747]: time="2020-05-08T16:32:26.204921094Z" level=warning msg="Your kernel does not support swap limit capabilities,or the cgroup is not mounted. Memory limited without swap."
May 8 16:32:26 node-k8s-use1-prod-shared-001-kubecluster-3-0a0c414b dockerd[1747]: time="2020-05-08T16:32:26Z" level=info msg="shim docker-containerd-shim started" address="/containerd-shim/moby/679b08e796acdd04b40802f2feff8086d7ba7f96182dcf874bb652fa9d9a7aec/shim.sock" debug=false pid=6592
May 8 16:32:26 node-k8s-use1-prod-shared-001-kubecluster-3-0a0c414b dockerd[1747]: time="2020-05-08T16:32:26Z" level=info msg="shim docker-containerd-shim started" address="/containerd-shim/moby/2ef0c4109b9cd128ae717d5c55bbd59810f88f3d8809424b620793729ab304c3/shim.sock" debug=false pid=6691
May 8 16:32:26 node-k8s-use1-prod-shared-001-kubecluster-3-0a0c414b dockerd[1747]: time="2020-05-08T16:32:26.871411364Z" level=warning msg="Your kernel does not support swap limit capabilities,or the cgroup is not mounted. Memory limited without swap."
May 8 16:32:26 node-k8s-use1-prod-shared-001-kubecluster-3-0a0c414b dockerd[1747]: time="2020-05-08T16:32:26Z" level=info msg="shim docker-containerd-shim started" address="/containerd-shim/moby/905b3c35be073388e3c037da65fe55bdb4f4b236b86dcf1e1698d6987dfce28c/shim.sock" debug=false pid=6790
May 8 16:32:27 node-k8s-use1-prod-shared-001-kubecluster-3-0a0c414b dockerd[1747]: time="2020-05-08T16:32:27Z" level=info msg="shim docker-containerd-shim started" address="/containerd-shim/moby/b4e6991f9837bf82533569d83a942fd8f3ae9fa869d5a0e760a967126f567a05/shim.sock" debug=false pid=6884
May 8 16:32:42 node-k8s-use1-prod-shared-001-kubecluster-3-0a0c414b dockerd[1747]: time="2020-05-08T16:32:42.409620423Z" level=warning msg="Your kernel does not support swap limit capabilities,or the cgroup is not mounted. Memory limited without swap."
May 8 16:37:28 node-k8s-use1-prod-shared-001-kubecluster-3-0a0c414b dockerd[1747]: time="2020-05-08T16:37:27Z" level=info msg="shim reaped" id=2ef0c4109b9cd128ae717d5c55bbd59810f88f3d8809424b620793729ab304c3
May 8 16:37:28 node-k8s-use1-prod-shared-001-kubecluster-3-0a0c414b dockerd[1747]: time="2020-05-08T16:37:28.400830650Z" level=info msg="ignoring event" module=libcontainerd namespace=moby topic=/tasks/delete type="*events.TaskDelete"
May 8 16:37:30 node-k8s-use1-prod-shared-001-kubecluster-3-0a0c414b dockerd[1747]: time="2020-05-08T16:37:29Z" level=info msg="shim reaped" id=905b3c35be073388e3c037da65fe55bdb4f4b236b86dcf1e1698d6987dfce28c
May 8 16:37:30 node-k8s-use1-prod-shared-001-kubecluster-3-0a0c414b dockerd[1747]: time="2020-05-08T16:37:30.316345816Z" level=info msg="ignoring event" module=libcontainerd namespace=moby topic=/tasks/delete type="*events.TaskDelete"
May 8 16:37:30 node-k8s-use1-prod-shared-001-kubecluster-3-0a0c414b dockerd[1747]: time="2020-05-08T16:37:30Z" level=info msg="shim reaped" id=b4e6991f9837bf82533569d83a942fd8f3ae9fa869d5a0e760a967126f567a05
May 8 16:37:30 node-k8s-use1-prod-shared-001-kubecluster-3-0a0c414b dockerd[1747]: time="2020-05-08T16:37:30.931134481Z" level=info msg="ignoring event" module=libcontainerd namespace=moby topic=/tasks/delete type="*events.TaskDelete"
May 8 16:37:35 node-k8s-use1-prod-shared-001-kubecluster-3-0a0c414b dockerd[1747]: time="2020-05-08T16:37:35Z" level=info msg="shim reaped" id=679b08e796acdd04b40802f2feff8086d7ba7f96182dcf874bb652fa9d9a7aec
May 8 16:37:36 node-k8s-use1-prod-shared-001-kubecluster-3-0a0c414b dockerd[1747]: time="2020-05-08T16:37:36.747358875Z" level=info msg="ignoring event" module=libcontainerd namespace=moby topic=/tasks/delete type="*events.TaskDelete"
May 8 16:39:31 node-k8s-use1-prod-shared-001-kubecluster-3-0a0c414b kernel: [63281.723692] mybr0: port 2(veth3f150f6c) entered disabled state
May 8 16:39:31 node-k8s-use1-prod-shared-001-kubecluster-3-0a0c414b kernel: [63281.752694] device veth3f150f6c left promiscuous mode
May 8 16:39:31 node-k8s-use1-prod-shared-001-kubecluster-3-0a0c414b kernel: [63281.756449] mybr0: port 2(veth3f150f6c) entered disabled state
May 8 16:39:35 node-k8s-use1-prod-shared-001-kubecluster-3-0a0c414b dockerd[1747]: time="2020-05-08T16:39:34Z" level=info msg="shim reaped" id=fa731d8d33f9d5a8aef457e5dab43170c1aedb529ce9221fd6d916a4dba07ff1
May 8 16:39:35 node-k8s-use1-prod-shared-001-kubecluster-3-0a0c414b dockerd[1747]: time="2020-05-08T16:39:35.106265137Z" level=info msg="ignoring event" module=libcontainerd namespace=moby topic=/tasks/delete type="*events.TaskDelete"
May 8 16:42:12 node-k8s-use1-prod-shared-001-kubecluster-3-0a0c414b kernel: [63442.505842] INFO: task dockerd:7970 blocked for more than 120 seconds.
May 8 16:42:12 node-k8s-use1-prod-shared-001-kubecluster-3-0a0c414b kernel: [63442.510931] Not tainted 5.0.0-1019-aws #21~18.04.1-Ubuntu
May 8 16:42:12 node-k8s-use1-prod-shared-001-kubecluster-3-0a0c414b kernel: [63442.515010] "echo 0 > /proc/sys/kernel/hung_task_timeout_secs" disables this message.
May 8 16:42:12 node-k8s-use1-prod-shared-001-kubecluster-3-0a0c414b kernel: [63442.521419] dockerd D 0 7970 1 0x00000080
May 8 16:42:12 node-k8s-use1-prod-shared-001-kubecluster-3-0a0c414b kernel: [63442.525333] Call Trace:
May 8 16:42:12 node-k8s-use1-prod-shared-001-kubecluster-3-0a0c414b kernel: [63442.528060] __schedule+0x2c0/0x870
May 8 16:42:12 node-k8s-use1-prod-shared-001-kubecluster-3-0a0c414b kernel: [63442.531107] schedule+0x2c/0x70
May 8 16:42:12 node-k8s-use1-prod-shared-001-kubecluster-3-0a0c414b kernel: [63442.534027] rwsem_down_write_failed+0x157/0x350
May 8 16:42:12 node-k8s-use1-prod-shared-001-kubecluster-3-0a0c414b kernel: [63442.537630] ? blk_finish_plug+0x2c/0x40
May 8 16:42:12 node-k8s-use1-prod-shared-001-kubecluster-3-0a0c414b kernel: [63442.540890] ? generic_writepages+0x68/0x90
May 8 16:42:12 node-k8s-use1-prod-shared-001-kubecluster-3-0a0c414b kernel: [63442.544296] call_rwsem_down_write_failed+0x17/0x30
May 8 16:42:12 node-k8s-use1-prod-shared-001-kubecluster-3-0a0c414b kernel: [63442.547999] ? call_rwsem_down_write_failed+0x17/0x30
May 8 16:42:12 node-k8s-use1-prod-shared-001-kubecluster-3-0a0c414b kernel: [63442.551674] down_write+0x2d/0x40
May 8 16:42:12 node-k8s-use1-prod-shared-001-kubecluster-3-0a0c414b kernel: [63442.554612] sync_inodes_sb+0xb9/0x2c0
May 8 16:42:12 node-k8s-use1-prod-shared-001-kubecluster-3-0a0c414b kernel: [63442.557762] ? __filemap_fdatawrite_range+0xcd/0x100
May 8 16:42:12 node-k8s-use1-prod-shared-001-kubecluster-3-0a0c414b kernel: [63442.561468] __sync_filesystem+0x1b/0x60
May 8 16:42:12 node-k8s-use1-prod-shared-001-kubecluster-3-0a0c414b kernel: [63442.564697] sync_filesystem+0x3c/0x50
May 8 16:42:12 node-k8s-use1-prod-shared-001-kubecluster-3-0a0c414b kernel: [63442.568544] ovl_sync_fs+0x3f/0x60 [overlay]
May 8 16:42:12 node-k8s-use1-prod-shared-001-kubecluster-3-0a0c414b kernel: [63442.572831] __sync_filesystem+0x33/0x60
May 8 16:42:12 node-k8s-use1-prod-shared-001-kubecluster-3-0a0c414b kernel: [63442.576767] sync_filesystem+0x3c/0x50
May 8 16:42:12 node-k8s-use1-prod-shared-001-kubecluster-3-0a0c414b kernel: [63442.580565] generic_shutdown_super+0x27/0x120
May 8 16:42:12 node-k8s-use1-prod-shared-001-kubecluster-3-0a0c414b kernel: [63442.584632] kill_anon_super+0x12/0x30
May 8 16:42:12 node-k8s-use1-prod-shared-001-kubecluster-3-0a0c414b kernel: [63442.587958] deactivate_locked_super+0x48/0x80
May 8 16:42:12 node-k8s-use1-prod-shared-001-kubecluster-3-0a0c414b kernel: [63442.591696] deactivate_super+0x40/0x60
May 8 16:42:12 node-k8s-use1-prod-shared-001-kubecluster-3-0a0c414b kernel: [63442.594998] cleanup_mnt+0x3f/0x90
May 8 16:42:12 node-k8s-use1-prod-shared-001-kubecluster-3-0a0c414b kernel: [63442.598081] __cleanup_mnt+0x12/0x20
May 8 16:42:12 node-k8s-use1-prod-shared-001-kubecluster-3-0a0c414b kernel: [63442.601194] task_work_run+0x9d/0xc0
May 8 16:42:12 node-k8s-use1-prod-shared-001-kubecluster-3-0a0c414b kernel: [63442.604388] exit_to_usermode_loop+0xf2/0x100
May 8 16:42:12 node-k8s-use1-prod-shared-001-kubecluster-3-0a0c414b kernel: [63442.607843] do_syscall_64+0x107/0x120
May 8 16:42:12 node-k8s-use1-prod-shared-001-kubecluster-3-0a0c414b kernel: [63442.611173] entry_SYSCALL_64_after_hwframe+0x44/0xa9
May 8 16:42:12 node-k8s-use1-prod-shared-001-kubecluster-3-0a0c414b kernel: [63442.615128] RIP: 0033:0x556561f280e0
May 8 16:42:12 node-k8s-use1-prod-shared-001-kubecluster-3-0a0c414b kernel: [63442.618303] Code: Bad RIP value.
May 8 16:42:12 node-k8s-use1-prod-shared-001-kubecluster-3-0a0c414b kernel: [63442.621256] RSP: 002b:000000c428ec51c0 EFLAGS: 00000206 ORIG_RAX: 00000000000000a6
May 8 16:42:12 node-k8s-use1-prod-shared-001-kubecluster-3-0a0c414b kernel: [63442.627790] RAX: 0000000000000000 RBX: 0000000000000000 RCX: 0000556561f280e0
May 8 16:42:12 node-k8s-use1-prod-shared-001-kubecluster-3-0a0c414b kernel: [63442.632469] RDX: 0000000000000000 RSI: 0000000000000002 RDI: 000000c4268a0d20
May 8 16:42:12 node-k8s-use1-prod-shared-001-kubecluster-3-0a0c414b kernel: [63442.637203] RBP: 000000c428ec5220 R08: 0000000000000000 R09: 0000000000000000
May 8 16:42:12 node-k8s-use1-prod-shared-001-kubecluster-3-0a0c414b kernel: [63442.641900] R10: 0000000000000000 R11: 0000000000000206 R12: ffffffffffffffff
May 8 16:42:12 node-k8s-use1-prod-shared-001-kubecluster-3-0a0c414b kernel: [63442.646535] R13: 0000000000000024 R14: 0000000000000023 R15: 0000000000000055
May 8 16:42:12 node-k8s-use1-prod-shared-001-kubecluster-3-0a0c414b kernel: [63442.651404] INFO: task dockerd:33393 blocked for more than 120 seconds.
May 8 16:42:12 node-k8s-use1-prod-shared-001-kubecluster-3-0a0c414b kernel: [63442.655956] Not tainted 5.0.0-1019-aws #21~18.04.1-Ubuntu
May 8 16:42:12 node-k8s-use1-prod-shared-001-kubecluster-3-0a0c414b kernel: [63442.660155] "echo 0 > /proc/sys/kernel/hung_task_timeout_secs" disables this message.
May 8 16:42:12 node-k8s-use1-prod-shared-001-kubecluster-3-0a0c414b kernel: [63442.666562] dockerd D 0 33393 1 0x00000080
May 8 16:42:12 node-k8s-use1-prod-shared-001-kubecluster-3-0a0c414b kernel: [63442.670561] Call Trace:
May 8 16:42:12 node-k8s-use1-prod-shared-001-kubecluster-3-0a0c414b kernel: [63442.673299] __schedule+0x2c0/0x870
May 8 16:42:12 node-k8s-use1-prod-shared-001-kubecluster-3-0a0c414b kernel: [63442.676435] schedule+0x2c/0x70
May 8 16:42:12 node-k8s-use1-prod-shared-001-kubecluster-3-0a0c414b kernel: [63442.679556] rwsem_down_write_failed+0x157/0x350
May 8 16:42:12 node-k8s-use1-prod-shared-001-kubecluster-3-0a0c414b kernel: [63442.683276] ? blk_finish_plug+0x2c/0x40
May 8 16:42:12 node-k8s-use1-prod-shared-001-kubecluster-3-0a0c414b kernel: [63442.686744] ? generic_writepages+0x68/0x90
May 8 16:42:12 node-k8s-use1-prod-shared-001-kubecluster-3-0a0c414b kernel: [63442.690442] call_rwsem_down_write_failed+0x17/0x30
May 8 16:42:12 node-k8s-use1-prod-shared-001-kubecluster-3-0a0c414b kernel: [63442.694243] ? call_rwsem_down_write_failed+0x17/0x30
May 8 16:42:12 node-k8s-use1-prod-shared-001-kubecluster-3-0a0c414b kernel: [63442.698019] down_write+0x2d/0x40
May 8 16:42:12 node-k8s-use1-prod-shared-001-kubecluster-3-0a0c414b kernel: [63442.700996] sync_inodes_sb+0xb9/0x2c0
May 8 16:42:12 node-k8s-use1-prod-shared-001-kubecluster-3-0a0c414b kernel: [63442.704283] ? __filemap_fdatawrite_range+0xcd/0x100
May 8 16:42:12 node-k8s-use1-prod-shared-001-kubecluster-3-0a0c414b kernel: [63442.708127] __sync_filesystem+0x1b/0x60
May 8 16:42:12 node-k8s-use1-prod-shared-001-kubecluster-3-0a0c414b kernel: [63442.711511] sync_filesystem+0x3c/0x50
May 8 16:42:12 node-k8s-use1-prod-shared-001-kubecluster-3-0a0c414b kernel: [63442.714806] ovl_sync_fs+0x3f/0x60 [overlay]
May 8 16:42:12 node-k8s-use1-prod-shared-001-kubecluster-3-0a0c414b kernel: [63442.718349] __sync_filesystem+0x33/0x60
May 8 16:42:12 node-k8s-use1-prod-shared-001-kubecluster-3-0a0c414b kernel: [63442.721665] sync_filesystem+0x3c/0x50
May 8 16:42:12 node-k8s-use1-prod-shared-001-kubecluster-3-0a0c414b kernel: [63442.724860] generic_shutdown_super+0x27/0x120
May 8 16:42:12 node-k8s-use1-prod-shared-001-kubecluster-3-0a0c414b kernel: [63442.728449] kill_anon_super+0x12/0x30
May 8 16:42:12 node-k8s-use1-prod-shared-001-kubecluster-3-0a0c414b kernel: [63442.731817] deactivate_locked_super+0x48/0x80
May 8 16:42:12 node-k8s-use1-prod-shared-001-kubecluster-3-0a0c414b kernel: [63442.735511] deactivate_super+0x40/0x60
May 8 16:42:12 node-k8s-use1-prod-shared-001-kubecluster-3-0a0c414b kernel: [63442.738899] cleanup_mnt+0x3f/0x90
May 8 16:42:12 node-k8s-use1-prod-shared-001-kubecluster-3-0a0c414b kernel: [63442.742023] __cleanup_mnt+0x12/0x20
May 8 16:42:12 node-k8s-use1-prod-shared-001-kubecluster-3-0a0c414b kernel: [63442.745142] task_work_run+0x9d/0xc0
May 8 16:42:12 node-k8s-use1-prod-shared-001-kubecluster-3-0a0c414b kernel: [63442.748337] exit_to_usermode_loop+0xf2/0x100
May 8 16:42:12 node-k8s-use1-prod-shared-001-kubecluster-3-0a0c414b kernel: [63442.751830] do_syscall_64+0x107/0x120
May 8 16:42:12 node-k8s-use1-prod-shared-001-kubecluster-3-0a0c414b kernel: [63442.755145] entry_SYSCALL_64_after_hwframe+0x44/0xa9
May 8 16:42:12 node-k8s-use1-prod-shared-001-kubecluster-3-0a0c414b kernel: [63442.759111] RIP: 0033:0x556561f280e0
May 8 16:42:12 node-k8s-use1-prod-shared-001-kubecluster-3-0a0c414b kernel: [63442.762292] Code: Bad RIP value.
May 8 16:42:12 node-k8s-use1-prod-shared-001-kubecluster-3-0a0c414b kernel: [63442.765237] RSP: 002b:000000c4289c51c0 EFLAGS: 00000206 ORIG_RAX: 00000000000000a6
May 8 16:42:12 node-k8s-use1-prod-shared-001-kubecluster-3-0a0c414b kernel: [63442.771715] RAX: 0000000000000000 RBX: 0000000000000000 RCX: 0000556561f280e0
May 8 16:42:12 node-k8s-use1-prod-shared-001-kubecluster-3-0a0c414b kernel: [63442.776351] RDX: 0000000000000000 RSI: 0000000000000002 RDI: 000000c4252e5e60
May 8 16:42:12 node-k8s-use1-prod-shared-001-kubecluster-3-0a0c414b kernel: [63442.781025] RBP: 000000c4289c5220 R08: 0000000000000000 R09: 0000000000000000
May 8 16:42:12 node-k8s-use1-prod-shared-001-kubecluster-3-0a0c414b kernel: [63442.785705] R10: 0000000000000000 R11: 0000000000000206 R12: ffffffffffffffff
May 8 16:42:12 node-k8s-use1-prod-shared-001-kubecluster-3-0a0c414b kernel: [63442.790445] R13: 0000000000000052 R14: 0000000000000051 R15: 0000000000000055
May 8 16:43:40 node-k8s-use1-prod-shared-001-kubecluster-3-0a0c414b dockerd[1747]: time="2020-05-08T16:43:40.153619029Z" level=error msg="Handler for GET /containers/679b08e796acdd04b40802f2feff8086d7ba7f96182dcf874bb652fa9d9a7aec/json returned error: write unix /var/run/docker.sock->@: write: broken pipe"
May 8 16:43:40 node-k8s-use1-prod-shared-001-kubecluster-3-0a0c414b dockerd[1747]: http: multiple response.WriteHeader calls
May 8 16:44:15 node-k8s-use1-prod-shared-001-kubecluster-3-0a0c414b dockerd[1747]: time="2020-05-08T16:44:15.461023232Z" level=error msg="Handler for GET /containers/fa731d8d33f9d5a8aef457e5dab43170c1aedb529ce9221fd6d916a4dba07ff1/json returned error: write unix /var/run/docker.sock->@: write: broken pipe"
May 8 16:44:15 node-k8s-use1-prod-shared-001-kubecluster-3-0a0c414b dockerd[1747]: time="2020-05-08T16:44:15.461331976Z" level=error msg="Handler for GET /containers/fa731d8d33f9d5a8aef457e5dab43170c1aedb529ce9221fd6d916a4dba07ff1/json returned error: write unix /var/run/docker.sock->@: write: broken pipe"
May 8 16:44:15 node-k8s-use1-prod-shared-001-kubecluster-3-0a0c414b dockerd[1747]: http: multiple response.WriteHeader calls
May 8 16:44:15 node-k8s-use1-prod-shared-001-kubecluster-3-0a0c414b dockerd[1747]: http: multiple response.WriteHeader calls
May 8 16:59:55 node-k8s-use1-prod-shared-001-kubecluster-3-0a0c414b dockerd[1747]: time="2020-05-08T16:59:55.489826112Z" level=info msg="No non-localhost DNS nameservers are left in resolv.conf. Using default external servers: [nameserver 8.8.8.8 nameserver 8.8.4.4]"
May 8 16:59:55 node-k8s-use1-prod-shared-001-kubecluster-3-0a0c414b dockerd[1747]: time="2020-05-08T16:59:55.489858794Z" level=info msg="IPv6 enabled; Adding default IPv6 external servers: [nameserver 2001:4860:4860::8888 nameserver 2001:4860:4860::8844]"
May 8 16:59:55 node-k8s-use1-prod-shared-001-kubecluster-3-0a0c414b dockerd[1747]: time="2020-05-08T16:59:55Z" level=info msg="shim docker-containerd-shim started" address="/containerd-shim/moby/5b85357b1e7b41f230a05d65fc97e6bdcf10537045db2e97ecbe66a346e40644/shim.sock" debug=false pid=5285
May 8 16:59:57 node-k8s-use1-prod-shared-001-kubecluster-3-0a0c414b dockerd[1747]: time="2020-05-08T16:59:57Z" level=info msg="shim docker-containerd-shim started" address="/containerd-shim/moby/89c6e4f2480992f94e3dbefb1cbe0084a8e5637588296a1bb40df0dcca662cf0/shim.sock" debug=false pid=6776
May 8 16:59:58 node-k8s-use1-prod-shared-001-kubecluster-3-0a0c414b dockerd[1747]: time="2020-05-08T16:59:58Z" level=info msg="shim reaped" id=89c6e4f2480992f94e3dbefb1cbe0084a8e5637588296a1bb40df0dcca662cf0
Just want to share what caused it for us.
We had a container running which "produced" a lot of processes over ~3days which in the and reached a maximum. This caused a complete freeze of the system as no new process could be spawned (there was then the PLEG warning).
So kind unrelated issue for us. Thanks for all the help :+1:
fentas
on 19 May 2020
There were two sets of issues I had, possibly related.
- PLEG. I believe they have gone away, but I have not recreated enough clusters to be completely confident. I do not believe I changed very much (i.e. anything) _directly_ to make that happen.
- Weave issues wherein containers were unable to connect to anything.
Suspiciously, all of the issues with pleg happened at exactly the same time as the weave network issues.
Bryan @ weaveworks, pointed me to the coreos issues. CoreOS has a rather aggressive tendency to try and manage bridges, veths, basically everything. Once I disabled CoreOS from doing it except on
loand actually physical interfaces on the host, all of my problems left.Are the people still with problems running coreos?
Do you remember which changes you made @deitch?
 JefClaes
on 26 May 2020
JefClaes
on 26 May 2020
I've found this: https://github.com/kontena/kontena/issues/1264#issuecomment-259381851
Which might be related to what @deitch have suggested. But I would also like to know if there's a right or more elegant solution, as creating a unit with veth* and putting this as unmanaged
rikatz
on 27 May 2020
I think I got the root cause for the issues we saw here:
docker sometimes can get messed up between docker ps and docker inspect: during container tear down, docker ps can show cached information about container including the ones whose shim is already reaped:
time="2020-06-01T23:39:03Z" level=info msg="shim docker-containerd-shim started" address="/containerd-shim/moby/b7ae929025205a7ea9eeaec24bc0526bf642052edff6c7849bc5cc7b9afb9121/shim.sock" debug=false pid=11377
Jun 02 03:23:06 node-k8s-use1-prod-shared-001-kubecluster-3-0a0c5d69 dockerd[1731]: time="2020-06-02T03:23:06Z" level=info msg="shim reaped" id=b7ae929025205a7ea9eeaec24bc0526bf642052edff6c7849bc5cc7b9afb9121
Jun 02 03:23:36 node-k8s-use1-prod-shared-001-kubecluster-3-0a0c5d69 dockerd[1731]: time="2020-06-02T03:23:36.433087181Z" level=info msg="Container b7ae929025205a7ea9eeaec24bc0526bf642052edff6c7849bc5cc7b9afb9121 failed to exit within 30 seconds of signal 15 - using the force"
ps cannot find a process with the container id
# ps auxww | grep b7ae92902520
root     21510  0.0  0.0  14852  1000 pts/0    S+   03:44   0:00 grep --color=auto b7ae92902520
docker ps shows the process is still up
# docker ps -a | grep b7ae92902520
b7ae92902520        450280d6866c                                                                                  "/srv/envoy-discover…"    4 hours ago         Up 4 hours                                        k8s_xxxxxx
In such case, dialing docker sock for docker inspect would stuck and cause client side timeout. This is possibly due to the fact that docker inspect would dial the reaped shim for up-to-date information from containerd, while docker ps uses cached data
# strace docker inspect b7ae92902520

......

newfstatat(AT_FDCWD, "/etc/.docker/config.json", {st_mode=S_IFREG|0644, st_size=124, ...}, 0) = 0
openat(AT_FDCWD, "/etc/.docker/config.json", O_RDONLY|O_CLOEXEC) = 3
epoll_ctl(4, EPOLL_CTL_ADD, 3, {EPOLLIN|EPOLLOUT|EPOLLRDHUP|EPOLLET, {u32=2124234496, u64=139889209065216}}) = -1 EPERM (Operation not permitted)
epoll_ctl(4, EPOLL_CTL_DEL, 3, 0xc420689884) = -1 EPERM (Operation not permitted)
read(3, "{\n    \"credsStore\": \"ecr-login\","..., 512) = 124
close(3)                                = 0
futex(0xc420650948, FUTEX_WAKE, 1)      = 1
socket(AF_UNIX, SOCK_STREAM|SOCK_CLOEXEC|SOCK_NONBLOCK, 0) = 3
setsockopt(3, SOL_SOCKET, SO_BROADCAST, [1], 4) = 0
connect(3, {sa_family=AF_UNIX, sun_path="/var/run/docker.sock"}, 23) = 0
epoll_ctl(4, EPOLL_CTL_ADD, 3, {EPOLLIN|EPOLLOUT|EPOLLRDHUP|EPOLLET, {u32=2124234496, u64=139889209065216}}) = 0
getsockname(3, {sa_family=AF_UNIX}, [112->2]) = 0
getpeername(3, {sa_family=AF_UNIX, sun_path="/var/run/docker.sock"}, [112->23]) = 0
futex(0xc420644548, FUTEX_WAKE, 1)      = 1
read(3, 0xc4202c2000, 4096)             = -1 EAGAIN (Resource temporarily unavailable)
write(3, "GET /_ping HTTP/1.1\r\nHost: docke"..., 83) = 83
futex(0xc420128548, FUTEX_WAKE, 1)      = 1
futex(0x25390a8, FUTEX_WAIT, 0, NULL)   = 0
futex(0x25390a8, FUTEX_WAIT, 0, NULL)   = 0
futex(0x25390a8, FUTEX_WAIT, 0, NULL)   = -1 EAGAIN (Resource temporarily unavailable)
futex(0x25390a8, FUTEX_WAIT, 0, NULL^C)   = ? ERESTARTSYS (To be restarted if SA_RESTART is set)
strace: Process 13301 detached
Because pod relist will include docker inspect of every container of every pod, such timeout will cause the entire PLEG relist to last an extensive period of time
Jun  2 04:37:03 node-k8s-use1-prod-shared-001-kubecluster-3-0a0c5d69 kubelet[28263]: I0602 04:37:03.523247   28263 generic.go:189] GenericPLEG: Relisting
Jun  2 04:37:03 node-k8s-use1-prod-shared-001-kubecluster-3-0a0c5d69 kubelet[28263]: I0602 04:37:03.541890   28263 generic.go:153] GenericPLEG: f0118c7e-82cb-4825-a01b-3014fe500e1f/51f959aa0c4cbcbc318c3fad7f90e5e967537e0acc8c727b813df17c50493af3: non-existent -> exited
Jun  2 04:37:03 node-k8s-use1-prod-shared-001-kubecluster-3-0a0c5d69 kubelet[28263]: I0602 04:37:03.541905   28263 generic.go:153] GenericPLEG: f0118c7e-82cb-4825-a01b-3014fe500e1f/6c221cd2fb602fdf4ae5288f2ce80d010cf252a9144d676c8ce11cc61170a4cf: non-existent -> exited
Jun  2 04:37:03 node-k8s-use1-prod-shared-001-kubecluster-3-0a0c5d69 kubelet[28263]: I0602 04:37:03.541909   28263 generic.go:153] GenericPLEG: f0118c7e-82cb-4825-a01b-3014fe500e1f/47bb03e0b56d55841e0592f94635eb67d5432edb82424fc23894cdffd755e652: non-existent -> exited
Jun  2 04:37:03 node-k8s-use1-prod-shared-001-kubecluster-3-0a0c5d69 kubelet[28263]: I0602 04:37:03.541913   28263 generic.go:153] GenericPLEG: f0118c7e-82cb-4825-a01b-3014fe500e1f/ee861fac313fad5e0c69455a807e13c67c3c211032bc499ca44898cde7368960: non-existent -> exited
Jun  2 04:37:03 node-k8s-use1-prod-shared-001-kubecluster-3-0a0c5d69 kubelet[28263]: I0602 04:37:03.541917   28263 generic.go:153] GenericPLEG: f0118c7e-82cb-4825-a01b-3014fe500e1f/b7ae929025205a7ea9eeaec24bc0526bf642052edff6c7849bc5cc7b9afb9121: non-existent -> running
Jun  2 04:37:03 node-k8s-use1-prod-shared-001-kubecluster-3-0a0c5d69 kubelet[28263]: I0602 04:37:03.541922   28263 generic.go:153] GenericPLEG: f0118c7e-82cb-4825-a01b-3014fe500e1f/dd3f5c03f7309d0a3feb2f9e9f682b4c30ac4105a245f7f40b44afd7096193a0: non-existent -> exited
Jun  2 04:37:03 node-k8s-use1-prod-shared-001-kubecluster-3-0a0c5d69 kubelet[28263]: I0602 04:37:03.541925   28263 generic.go:153] GenericPLEG: f0118c7e-82cb-4825-a01b-3014fe500e1f/57960fe13240af78381785cc66c6946f78b8978985bc847a1f77f8af8aef0f54: non-existent -> exited
Jun  2 04:37:03 node-k8s-use1-prod-shared-001-kubecluster-3-0a0c5d69 kubelet[28263]: I0602 04:37:03.541929   28263 generic.go:153] GenericPLEG: f0118c7e-82cb-4825-a01b-3014fe500e1f/8ebaeed71f6ce99191a2d839a07d3573119472da221aeb4c7f646f25e6e9dd1b: non-existent -> exited
Jun  2 04:37:03 node-k8s-use1-prod-shared-001-kubecluster-3-0a0c5d69 kubelet[28263]: I0602 04:37:03.541932   28263 generic.go:153] GenericPLEG: f0118c7e-82cb-4825-a01b-3014fe500e1f/b04da653f52e0badc54cc839b485dcc7ec5e2f6a8df326d03bcf3e5c8a14a3e3: non-existent -> exited
Jun  2 04:37:03 node-k8s-use1-prod-shared-001-kubecluster-3-0a0c5d69 kubelet[28263]: I0602 04:37:03.541936   28263 generic.go:153] GenericPLEG: f0118c7e-82cb-4825-a01b-3014fe500e1f/a23912e38613fd455b26061c4ab002da294f18437b21bc1874e65a82ee1fba05: non-existent -> exited
Jun  2 04:37:03 node-k8s-use1-prod-shared-001-kubecluster-3-0a0c5d69 kubelet[28263]: I0602 04:37:03.541939   28263 generic.go:153] GenericPLEG: f0118c7e-82cb-4825-a01b-3014fe500e1f/7f928360f1ba8890194ed795cfa22c5930c0d3ce5f6f2bc6d0592f4a3c1b579f: non-existent -> exited
Jun  2 04:37:03 node-k8s-use1-prod-shared-001-kubecluster-3-0a0c5d69 kubelet[28263]: I0602 04:37:03.541943   28263 generic.go:153] GenericPLEG: f0118c7e-82cb-4825-a01b-3014fe500e1f/c3bdab1ed8896399263672ca45365e3d74c4ddc3958f82e3c7549fe12bc6c74b: non-existent -> exited
Jun  2 04:37:05 node-k8s-use1-prod-shared-001-kubecluster-3-0a0c5d69 kubelet[28263]: E0602 04:37:05.580912   28263 pod_workers.go:191] Error syncing pod f0118c7e-82cb-4825-a01b-3014fe500e1f ("optimus-pr-b-6bgc3_jenkins(f0118c7e-82cb-4825-a01b-3014fe500e1f)"), skipping: rpc error: code = DeadlineExceeded desc = context deadline exceeded
Jun  2 04:37:05 node-k8s-use1-prod-shared-001-kubecluster-3-0a0c5d69 kubelet[28263]: I0602 04:37:05.580983   28263 event.go:274] Event(v1.ObjectReference{Kind:"Pod", Namespace:"jenkins", Name:"optimus-pr-b-6bgc3", UID:"f0118c7e-82cb-4825-a01b-3014fe500e1f", APIVersion:"v1", ResourceVersion:"4311315533", FieldPath:""}): type: 'Warning' reason: 'FailedSync' error determining status: rpc error: code = DeadlineExceeded desc = context deadline exceeded
Jun  2 04:37:18 node-k8s-use1-prod-shared-001-kubecluster-3-0a0c5d69 kubelet[28263]: E0602 04:37:18.277091   28263 pod_workers.go:191] Error syncing pod f0118c7e-82cb-4825-a01b-3014fe500e1f ("optimus-pr-b-6bgc3_jenkins(f0118c7e-82cb-4825-a01b-3014fe500e1f)"), skipping: rpc error: code = DeadlineExceeded desc = context deadline exceeded
Jun  2 04:37:18 node-k8s-use1-prod-shared-001-kubecluster-3-0a0c5d69 kubelet[28263]: I0602 04:37:18.277187   28263 event.go:274] Event(v1.ObjectReference{Kind:"Pod", Namespace:"jenkins", Name:"optimus-pr-b-6bgc3", UID:"f0118c7e-82cb-4825-a01b-3014fe500e1f", APIVersion:"v1", ResourceVersion:"4311315533", FieldPath:""}): type: 'Warning' reason: 'FailedSync' error determining status: rpc error: code = DeadlineExceeded desc = context deadline exceeded
Jun  2 04:37:29 node-k8s-use1-prod-shared-001-kubecluster-3-0a0c5d69 kubelet[28263]: E0602 04:37:29.276942   28263 pod_workers.go:191] Error syncing pod f0118c7e-82cb-4825-a01b-3014fe500e1f ("optimus-pr-b-6bgc3_jenkins(f0118c7e-82cb-4825-a01b-3014fe500e1f)"), skipping: rpc error: code = DeadlineExceeded desc = context deadline exceeded
Jun  2 04:37:29 node-k8s-use1-prod-shared-001-kubecluster-3-0a0c5d69 kubelet[28263]: I0602 04:37:29.276994   28263 event.go:274] Event(v1.ObjectReference{Kind:"Pod", Namespace:"jenkins", Name:"optimus-pr-b-6bgc3", UID:"f0118c7e-82cb-4825-a01b-3014fe500e1f", APIVersion:"v1", ResourceVersion:"4311315533", FieldPath:""}): type: 'Warning' reason: 'FailedSync' error determining status: rpc error: code = DeadlineExceeded desc = context deadline exceeded
Jun  2 04:37:44 node-k8s-use1-prod-shared-001-kubecluster-3-0a0c5d69 kubelet[28263]: E0602 04:37:44.276919   28263 pod_workers.go:191] Error syncing pod f0118c7e-82cb-4825-a01b-3014fe500e1f ("optimus-pr-b-6bgc3_jenkins(f0118c7e-82cb-4825-a01b-3014fe500e1f)"), skipping: rpc error: code = DeadlineExceeded desc = context deadline exceeded
Jun  2 04:37:44 node-k8s-use1-prod-shared-001-kubecluster-3-0a0c5d69 kubelet[28263]: I0602 04:37:44.276964   28263 event.go:274] Event(v1.ObjectReference{Kind:"Pod", Namespace:"jenkins", Name:"optimus-pr-b-6bgc3", UID:"f0118c7e-82cb-4825-a01b-3014fe500e1f", APIVersion:"v1", ResourceVersion:"4311315533", FieldPath:""}): type: 'Warning' reason: 'FailedSync' error determining status: rpc error: code = DeadlineExceeded desc = context deadline exceeded
Jun  2 04:37:56 node-k8s-use1-prod-shared-001-kubecluster-3-0a0c5d69 kubelet[28263]: E0602 04:37:56.277039   28263 pod_workers.go:191] Error syncing pod f0118c7e-82cb-4825-a01b-3014fe500e1f ("optimus-pr-b-6bgc3_jenkins(f0118c7e-82cb-4825-a01b-3014fe500e1f)"), skipping: rpc error: code = DeadlineExceeded desc = context deadline exceeded
Jun  2 04:37:56 node-k8s-use1-prod-shared-001-kubecluster-3-0a0c5d69 kubelet[28263]: I0602 04:37:56.277116   28263 event.go:274] Event(v1.ObjectReference{Kind:"Pod", Namespace:"jenkins", Name:"optimus-pr-b-6bgc3", UID:"f0118c7e-82cb-4825-a01b-3014fe500e1f", APIVersion:"v1", ResourceVersion:"4311315533", FieldPath:""}): type: 'Warning' reason: 'FailedSync' error determining status: rpc error: code = DeadlineExceeded desc = context deadline exceeded
Jun  2 04:38:08 node-k8s-use1-prod-shared-001-kubecluster-3-0a0c5d69 kubelet[28263]: E0602 04:38:08.276838   28263 pod_workers.go:191] Error syncing pod f0118c7e-82cb-4825-a01b-3014fe500e1f ("optimus-pr-b-6bgc3_jenkins(f0118c7e-82cb-4825-a01b-3014fe500e1f)"), skipping: rpc error: code = DeadlineExceeded desc = context deadline exceeded
Jun  2 04:38:08 node-k8s-use1-prod-shared-001-kubecluster-3-0a0c5d69 kubelet[28263]: I0602 04:38:08.276913   28263 event.go:274] Event(v1.ObjectReference{Kind:"Pod", Namespace:"jenkins", Name:"optimus-pr-b-6bgc3", UID:"f0118c7e-82cb-4825-a01b-3014fe500e1f", APIVersion:"v1", ResourceVersion:"4311315533", FieldPath:""}): type: 'Warning' reason: 'FailedSync' error determining status: rpc error: code = DeadlineExceeded desc = context deadline exceeded
Jun  2 04:38:22 node-k8s-use1-prod-shared-001-kubecluster-3-0a0c5d69 kubelet[28263]: E0602 04:38:22.277107   28263 pod_workers.go:191] Error syncing pod f0118c7e-82cb-4825-a01b-3014fe500e1f ("optimus-pr-b-6bgc3_jenkins(f0118c7e-82cb-4825-a01b-3014fe500e1f)"), skipping: rpc error: code = DeadlineExceeded desc = context deadline exceeded
Jun  2 04:38:22 node-k8s-use1-prod-shared-001-kubecluster-3-0a0c5d69 kubelet[28263]: I0602 04:38:22.277151   28263 event.go:274] Event(v1.ObjectReference{Kind:"Pod", Namespace:"jenkins", Name:"optimus-pr-b-6bgc3", UID:"f0118c7e-82cb-4825-a01b-3014fe500e1f", APIVersion:"v1", ResourceVersion:"4311315533", FieldPath:""}): type: 'Warning' reason: 'FailedSync' error determining status: rpc error: code = DeadlineExceeded desc = context deadline exceeded
Jun  2 04:38:37 node-k8s-use1-prod-shared-001-kubecluster-3-0a0c5d69 kubelet[28263]: E0602 04:38:37.277123   28263 pod_workers.go:191] Error syncing pod f0118c7e-82cb-4825-a01b-3014fe500e1f ("optimus-pr-b-6bgc3_jenkins(f0118c7e-82cb-4825-a01b-3014fe500e1f)"), skipping: rpc error: code = DeadlineExceeded desc = context deadline exceeded
Jun  2 04:38:37 node-k8s-use1-prod-shared-001-kubecluster-3-0a0c5d69 kubelet[28263]: I0602 04:38:37.277189   28263 event.go:274] Event(v1.ObjectReference{Kind:"Pod", Namespace:"jenkins", Name:"optimus-pr-b-6bgc3", UID:"f0118c7e-82cb-4825-a01b-3014fe500e1f", APIVersion:"v1", ResourceVersion:"4311315533", FieldPath:""}): type: 'Warning' reason: 'FailedSync' error determining status: rpc error: code = DeadlineExceeded desc = context deadline exceeded
Jun  2 04:38:51 node-k8s-use1-prod-shared-001-kubecluster-3-0a0c5d69 kubelet[28263]: E0602 04:38:51.277059   28263 pod_workers.go:191] Error syncing pod f0118c7e-82cb-4825-a01b-3014fe500e1f ("optimus-pr-b-6bgc3_jenkins(f0118c7e-82cb-4825-a01b-3014fe500e1f)"), skipping: rpc error: code = DeadlineExceeded desc = context deadline exceeded
Jun  2 04:38:51 node-k8s-use1-prod-shared-001-kubecluster-3-0a0c5d69 kubelet[28263]: I0602 04:38:51.277101   28263 event.go:274] Event(v1.ObjectReference{Kind:"Pod", Namespace:"jenkins", Name:"optimus-pr-b-6bgc3", UID:"f0118c7e-82cb-4825-a01b-3014fe500e1f", APIVersion:"v1", ResourceVersion:"4311315533", FieldPath:""}): type: 'Warning' reason: 'FailedSync' error determining status: rpc error: code = DeadlineExceeded desc = context deadline exceeded
Jun  2 04:39:02 node-k8s-use1-prod-shared-001-kubecluster-3-0a0c5d69 kubelet[28263]: E0602 04:39:02.276836   28263 pod_workers.go:191] Error syncing pod f0118c7e-82cb-4825-a01b-3014fe500e1f ("optimus-pr-b-6bgc3_jenkins(f0118c7e-82cb-4825-a01b-3014fe500e1f)"), skipping: rpc error: code = DeadlineExceeded desc = context deadline exceeded
Jun  2 04:39:02 node-k8s-use1-prod-shared-001-kubecluster-3-0a0c5d69 kubelet[28263]: I0602 04:39:02.276908   28263 event.go:274] Event(v1.ObjectReference{Kind:"Pod", Namespace:"jenkins", Name:"optimus-pr-b-6bgc3", UID:"f0118c7e-82cb-4825-a01b-3014fe500e1f", APIVersion:"v1", ResourceVersion:"4311315533", FieldPath:""}): type: 'Warning' reason: 'FailedSync' error determining status: rpc error: code = DeadlineExceeded desc = context deadline exceeded
Jun  2 04:39:03 node-k8s-use1-prod-shared-001-kubecluster-3-0a0c5d69 kubelet[28263]: E0602 04:39:03.554207   28263 remote_runtime.go:295] ContainerStatus "b7ae929025205a7ea9eeaec24bc0526bf642052edff6c7849bc5cc7b9afb9121" from runtime service failed: rpc error: code = DeadlineExceeded desc = context deadline exceeded
Jun  2 04:39:03 node-k8s-use1-prod-shared-001-kubecluster-3-0a0c5d69 kubelet[28263]: I0602 04:39:03.554252   28263 kuberuntime_container.go:403] ContainerStatus for b7ae929025205a7ea9eeaec24bc0526bf642052edff6c7849bc5cc7b9afb9121 error: rpc error: code = DeadlineExceeded desc = context deadline exceeded
Jun  2 04:39:03 node-k8s-use1-prod-shared-001-kubecluster-3-0a0c5d69 kubelet[28263]: E0602 04:39:03.554265   28263 kuberuntime_manager.go:1122] getPodContainerStatuses for pod "optimus-pr-b-6bgc3_jenkins(f0118c7e-82cb-4825-a01b-3014fe500e1f)" failed: rpc error: code = DeadlineExceeded desc = context deadline exceeded
Jun  2 04:39:03 node-k8s-use1-prod-shared-001-kubecluster-3-0a0c5d69 kubelet[28263]: I0602 04:39:03.554272   28263 generic.go:397] PLEG: Write status for optimus-pr-b-6bgc3/jenkins: (*container.PodStatus)(nil) (err: rpc error: code = DeadlineExceeded desc = context deadline exceeded)
Jun  2 04:39:03 node-k8s-use1-prod-shared-001-kubecluster-3-0a0c5d69 kubelet[28263]: I0602 04:39:03.554285   28263 generic.go:252] PLEG: Ignoring events for pod optimus-pr-b-6bgc3/jenkins: rpc error: code = DeadlineExceeded desc = context deadline exceeded
Jun  2 04:39:03 node-k8s-use1-prod-shared-001-kubecluster-3-0a0c5d69 kubelet[28263]: I0602 04:39:03.554294   28263 generic.go:284] GenericPLEG: Reinspecting pods that previously failed inspection
Jun  2 04:39:17 node-k8s-use1-prod-shared-001-kubecluster-3-0a0c5d69 kubelet[28263]: E0602 04:39:17.277086   28263 pod_workers.go:191] Error syncing pod f0118c7e-82cb-4825-a01b-3014fe500e1f ("optimus-pr-b-6bgc3_jenkins(f0118c7e-82cb-4825-a01b-3014fe500e1f)"), skipping: rpc error: code = DeadlineExceeded desc = context deadline exceeded
Jun  2 04:39:17 node-k8s-use1-prod-shared-001-kubecluster-3-0a0c5d69 kubelet[28263]: I0602 04:39:17.277137   28263 event.go:274] Event(v1.ObjectReference{Kind:"Pod", Namespace:"jenkins", Name:"optimus-pr-b-6bgc3", UID:"f0118c7e-82cb-4825-a01b-3014fe500e1f", APIVersion:"v1", ResourceVersion:"4311315533", FieldPath:""}): type: 'Warning' reason: 'FailedSync' error determining status: rpc error: code = DeadlineExceeded desc = context deadline exceeded
Jun  2 04:39:28 node-k8s-use1-prod-shared-001-kubecluster-3-0a0c5d69 kubelet[28263]: E0602 04:39:28.276905   28263 pod_workers.go:191] Error syncing pod f0118c7e-82cb-4825-a01b-3014fe500e1f ("optimus-pr-b-6bgc3_jenkins(f0118c7e-82cb-4825-a01b-3014fe500e1f)"), skipping: rpc error: code = DeadlineExceeded desc = context deadline exceeded
Jun  2 04:39:28 node-k8s-use1-prod-shared-001-kubecluster-3-0a0c5d69 kubelet[28263]: I0602 04:39:28.276976   28263 event.go:274] Event(v1.ObjectReference{Kind:"Pod", Namespace:"jenkins", Name:"optimus-pr-b-6bgc3", UID:"f0118c7e-82cb-4825-a01b-3014fe500e1f", APIVersion:"v1", ResourceVersion:"4311315533", FieldPath:""}): type: 'Warning' reason: 'FailedSync' error determining status: rpc error: code = DeadlineExceeded desc = context deadline exceeded
Jun  2 04:39:40 node-k8s-use1-prod-shared-001-kubecluster-3-0a0c5d69 kubelet[28263]: E0602 04:39:40.276815   28263 pod_workers.go:191] Error syncing pod f0118c7e-82cb-4825-a01b-3014fe500e1f ("optimus-pr-b-6bgc3_jenkins(f0118c7e-82cb-4825-a01b-3014fe500e1f)"), skipping: rpc error: code = DeadlineExceeded desc = context deadline exceeded
Jun  2 04:39:40 node-k8s-use1-prod-shared-001-kubecluster-3-0a0c5d69 kubelet[28263]: I0602 04:39:40.276858   28263 event.go:274] Event(v1.ObjectReference{Kind:"Pod", Namespace:"jenkins", Name:"optimus-pr-b-6bgc3", UID:"f0118c7e-82cb-4825-a01b-3014fe500e1f", APIVersion:"v1", ResourceVersion:"4311315533", FieldPath:""}): type: 'Warning' reason: 'FailedSync' error determining status: rpc error: code = DeadlineExceeded desc = context deadline exceeded
Jun  2 04:39:51 node-k8s-use1-prod-shared-001-kubecluster-3-0a0c5d69 kubelet[28263]: E0602 04:39:51.276950   28263 pod_workers.go:191] Error syncing pod f0118c7e-82cb-4825-a01b-3014fe500e1f ("optimus-pr-b-6bgc3_jenkins(f0118c7e-82cb-4825-a01b-3014fe500e1f)"), skipping: rpc error: code = DeadlineExceeded desc = context deadline exceeded
Jun  2 04:39:51 node-k8s-use1-prod-shared-001-kubecluster-3-0a0c5d69 kubelet[28263]: I0602 04:39:51.277015   28263 event.go:274] Event(v1.ObjectReference{Kind:"Pod", Namespace:"jenkins", Name:"optimus-pr-b-6bgc3", UID:"f0118c7e-82cb-4825-a01b-3014fe500e1f", APIVersion:"v1", ResourceVersion:"4311315533", FieldPath:""}): type: 'Warning' reason: 'FailedSync' error determining status: rpc error: code = DeadlineExceeded desc = context deadline exceeded
Jun  2 04:40:04 node-k8s-use1-prod-shared-001-kubecluster-3-0a0c5d69 kubelet[28263]: E0602 04:40:04.276869   28263 pod_workers.go:191] Error syncing pod f0118c7e-82cb-4825-a01b-3014fe500e1f ("optimus-pr-b-6bgc3_jenkins(f0118c7e-82cb-4825-a01b-3014fe500e1f)"), skipping: rpc error: code = DeadlineExceeded desc = context deadline exceeded
Jun  2 04:40:04 node-k8s-use1-prod-shared-001-kubecluster-3-0a0c5d69 kubelet[28263]: I0602 04:40:04.276939   28263 event.go:274] Event(v1.ObjectReference{Kind:"Pod", Namespace:"jenkins", Name:"optimus-pr-b-6bgc3", UID:"f0118c7e-82cb-4825-a01b-3014fe500e1f", APIVersion:"v1", ResourceVersion:"4311315533", FieldPath:""}): type: 'Warning' reason: 'FailedSync' error determining status: rpc error: code = DeadlineExceeded desc = context deadline exceeded
Jun  2 04:41:03 node-k8s-use1-prod-shared-001-kubecluster-3-0a0c5d69 kubelet[28263]: E0602 04:41:03.566494   28263 remote_runtime.go:295] ContainerStatus "b7ae929025205a7ea9eeaec24bc0526bf642052edff6c7849bc5cc7b9afb9121" from runtime service failed: rpc error: code = DeadlineExceeded desc = context deadline exceeded
Jun  2 04:41:03 node-k8s-use1-prod-shared-001-kubecluster-3-0a0c5d69 kubelet[28263]: I0602 04:41:03.566543   28263 kuberuntime_container.go:403] ContainerStatus for b7ae929025205a7ea9eeaec24bc0526bf642052edff6c7849bc5cc7b9afb9121 error: rpc error: code = DeadlineExceeded desc = context deadline exceeded
Jun  2 04:41:03 node-k8s-use1-prod-shared-001-kubecluster-3-0a0c5d69 kubelet[28263]: E0602 04:41:03.566554   28263 kuberuntime_manager.go:1122] getPodContainerStatuses for pod "optimus-pr-b-6bgc3_jenkins(f0118c7e-82cb-4825-a01b-3014fe500e1f)" failed: rpc error: code = DeadlineExceeded desc = context deadline exceeded
Jun  2 04:41:03 node-k8s-use1-prod-shared-001-kubecluster-3-0a0c5d69 kubelet[28263]: I0602 04:41:03.566561   28263 generic.go:397] PLEG: Write status for optimus-pr-b-6bgc3/jenkins: (*container.PodStatus)(nil) (err: rpc error: code = DeadlineExceeded desc = context deadline exceeded)
Jun  2 04:41:03 node-k8s-use1-prod-shared-001-kubecluster-3-0a0c5d69 kubelet[28263]: I0602 04:41:03.566575   28263 generic.go:288] PLEG: pod optimus-pr-b-6bgc3/jenkins failed reinspection: rpc error: code = DeadlineExceeded desc = context deadline exceeded
Jun  2 04:41:03 node-k8s-use1-prod-shared-001-kubecluster-3-0a0c5d69 kubelet[28263]: I0602 04:41:03.566604   28263 generic.go:189] GenericPLEG: Relisting
Current PLEG healthy threshold is 3min, so if the PLEG relisting > 3min, which is fairly easy in this case, PLEG will be reported as unhealthy.
I haven't got a chance to see if simply docker rm would correct such state, as after stuck for ~40min, docker unblocks itself
[root@node-k8s-use1-prod-shared-001-kubecluster-3-0a0c5d69:/home/hzhang]# journalctl -u docker | grep b7ae92902520
Jun 01 23:39:03 node-k8s-use1-prod-shared-001-kubecluster-3-0a0c5d69 dockerd[1731]: time="2020-06-01T23:39:03Z" level=info msg="shim docker-containerd-shim started" address="/containerd-shim/moby/b7ae929025205a7ea9eeaec24bc0526bf642052edff6c7849bc5cc7b9afb9121/shim.sock" debug=false pid=11377
Jun 02 03:23:06 node-k8s-use1-prod-shared-001-kubecluster-3-0a0c5d69 dockerd[1731]: time="2020-06-02T03:23:06Z" level=info msg="shim reaped" id=b7ae929025205a7ea9eeaec24bc0526bf642052edff6c7849bc5cc7b9afb9121
Jun 02 03:23:36 node-k8s-use1-prod-shared-001-kubecluster-3-0a0c5d69 dockerd[1731]: time="2020-06-02T03:23:36.433087181Z" level=info msg="Container b7ae929025205a7ea9eeaec24bc0526bf642052edff6c7849bc5cc7b9afb9121 failed to exit within 30 seconds of signal 15 - using the force"
Jun 02 04:41:45 node-k8s-use1-prod-shared-001-kubecluster-3-0a0c5d69 dockerd[1731]: time="2020-06-02T04:41:45.435460391Z" level=warning msg="Container b7ae929025205a7ea9eeaec24bc0526bf642052edff6c7849bc5cc7b9afb9121 is not running"
Jun 02 04:41:45 node-k8s-use1-prod-shared-001-kubecluster-3-0a0c5d69 dockerd[1731]: time="2020-06-02T04:41:45.435684282Z" level=error msg="Handler for GET /containers/b7ae929025205a7ea9eeaec24bc0526bf642052edff6c7849bc5cc7b9afb9121/json returned error: write unix /var/run/docker.sock->@: write: broken pipe"
Jun 02 04:41:45 node-k8s-use1-prod-shared-001-kubecluster-3-0a0c5d69 dockerd[1731]: time="2020-06-02T04:41:45.435955786Z" level=error msg="Handler for GET /containers/b7ae929025205a7ea9eeaec24bc0526bf642052edff6c7849bc5cc7b9afb9121/json returned error: write unix /var/run/docker.sock->@: write: broken pipe"
Jun 02 04:41:45 node-k8s-use1-prod-shared-001-kubecluster-3-0a0c5d69 dockerd[1731]: time="2020-06-02T04:41:45.436078347Z" level=error msg="Handler for GET /containers/b7ae929025205a7ea9eeaec24bc0526bf642052edff6c7849bc5cc7b9afb9121/json returned error: write unix /var/run/docker.sock->@: write: broken pipe"
Jun 02 04:41:45 node-k8s-use1-prod-shared-001-kubecluster-3-0a0c5d69 dockerd[1731]: time="2020-06-02T04:41:45.436341875Z" level=error msg="Handler for GET /containers/b7ae929025205a7ea9eeaec24bc0526bf642052edff6c7849bc5cc7b9afb9121/json returned error: write unix /var/run/docker.sock->@: write: broken pipe"
Jun 02 04:41:45 node-k8s-use1-prod-shared-001-kubecluster-3-0a0c5d69 dockerd[1731]: time="2020-06-02T04:41:45.436570634Z" level=error msg="Handler for GET /containers/b7ae929025205a7ea9eeaec24bc0526bf642052edff6c7849bc5cc7b9afb9121/json returned error: write unix /var/run/docker.sock->@: write: broken pipe"
Jun 02 04:41:45 node-k8s-use1-prod-shared-001-kubecluster-3-0a0c5d69 dockerd[1731]: time="2020-06-02T04:41:45.436770587Z" level=error msg="Handler for GET /containers/b7ae929025205a7ea9eeaec24bc0526bf642052edff6c7849bc5cc7b9afb9121/json returned error: write unix /var/run/docker.sock->@: write: broken pipe"
Jun 02 04:41:45 node-k8s-use1-prod-shared-001-kubecluster-3-0a0c5d69 dockerd[1731]: time="2020-06-02T04:41:45.436905470Z" level=error msg="Handler for GET /containers/b7ae929025205a7ea9eeaec24bc0526bf642052edff6c7849bc5cc7b9afb9121/json returned error: write unix /var/run/docker.sock->@: write: broken pipe"
......
Various issues have been opened regarding to similar phenomenon:
https://github.com/docker/for-linux/issues/397
https://github.com/docker/for-linux/issues/543
https://github.com/moby/moby/issues/41054
however it's claimed to still be seen in docker 19.03, i.e. https://github.com/docker/for-linux/issues/397#issuecomment-515425324
Probably the remediation is to have some watchdog to compare docker ps and ps ax and scrub those containers that don't have a shim process and either force terminate pod to unblock those pods or use docker rm to remove the container
zhan849
on 2 Jun 2020
to continue with the above investigation - thread dump showed that during docker hang, docker is waiting on containerd so it's likely a containerd issue there. (see thread dump below) In this case
- only docker ps will work for these affected container
- docker rm / docker stop / docker inspect will hang
- kubelet pod relist will timeout when it tries to inspect such container, the entire relist latency might or might not exceed 3min so node would "flap"
- this will cause user pod stuck in making progress, as well as kubelet responding slowly as the entire PLEG is slowed down
so what we did in production is that:
- check inconsistency between
psanddocker psand pick affected container, as in our case, all container with operations stuck already have their shim reaped - docker sometimes resolves itself but some times not, so after a timeout, we force delete affected pods to unblock user
- if such inconsistency exists in general after a certain period of time, restart docker
/cc @jmf0526 @haosdent @liucimin @yujuhong @thockin
seems you guys were also actively talking about it in later threads for investigations
goroutine 1707386 [select, 22 minutes]:
--
github.com/docker/docker/vendor/google.golang.org/grpc/transport.(*Stream).waitOnHeader(0xc420609680, 0x10, 0xc420f60fd8)
/go/src/github.com/docker/docker/vendor/google.golang.org/grpc/transport/transport.go:222 +0x101
github.com/docker/docker/vendor/google.golang.org/grpc/transport.(*Stream).RecvCompress(0xc420609680, 0x555ab63e0730, 0xc420f61098)
/go/src/github.com/docker/docker/vendor/google.golang.org/grpc/transport/transport.go:233 +0x2d
github.com/docker/docker/vendor/google.golang.org/grpc.(*csAttempt).recvMsg(0xc4267ef1e0, 0x555ab624f000, 0xc4288fd410, 0x0, 0x0)
/go/src/github.com/docker/docker/vendor/google.golang.org/grpc/stream.go:515 +0x63b
github.com/docker/docker/vendor/google.golang.org/grpc.(*clientStream).RecvMsg(0xc4204fa800, 0x555ab624f000, 0xc4288fd410, 0x0, 0x0)
/go/src/github.com/docker/docker/vendor/google.golang.org/grpc/stream.go:395 +0x45
github.com/docker/docker/vendor/google.golang.org/grpc.invoke(0x555ab6415260, 0xc4288fd4a0, 0x555ab581d40c, 0x2a, 0x555ab6249c00, 0xc428c04450, 0x555ab624f000, 0xc4288fd410, 0xc4202d4600, 0xc4202cdc40, ...)
/go/src/github.com/docker/docker/vendor/google.golang.org/grpc/call.go:83 +0x185
github.com/docker/docker/vendor/github.com/containerd/containerd.namespaceInterceptor.unary(0x555ab57c9d91, 0x4, 0x555ab64151e0, 0xc420128040, 0x555ab581d40c, 0x2a, 0x555ab6249c00, 0xc428c04450, 0x555ab624f000, 0xc4288fd410, ...)
/go/src/github.com/docker/docker/vendor/github.com/containerd/containerd/grpc.go:35 +0xf6
github.com/docker/docker/vendor/github.com/containerd/containerd.(namespaceInterceptor).(github.com/docker/docker/vendor/github.com/containerd/containerd.unary)-fm(0x555ab64151e0, 0xc420128040, 0x555ab581d40c, 0x2a, 0x555ab6249c00, 0xc428c04450, 0x555ab624f000, 0xc4288fd410, 0xc4202d4600, 0x555ab63e07a0, ...)
/go/src/github.com/docker/docker/vendor/github.com/containerd/containerd/grpc.go:51 +0xf6
github.com/docker/docker/vendor/google.golang.org/grpc.(*ClientConn).Invoke(0xc4202d4600, 0x555ab64151e0, 0xc420128040, 0x555ab581d40c, 0x2a, 0x555ab6249c00, 0xc428c04450, 0x555ab624f000, 0xc4288fd410, 0x0, ...)
/go/src/github.com/docker/docker/vendor/google.golang.org/grpc/call.go:35 +0x10b
github.com/docker/docker/vendor/google.golang.org/grpc.Invoke(0x555ab64151e0, 0xc420128040, 0x555ab581d40c, 0x2a, 0x555ab6249c00, 0xc428c04450, 0x555ab624f000, 0xc4288fd410, 0xc4202d4600, 0x0, ...)
/go/src/github.com/docker/docker/vendor/google.golang.org/grpc/call.go:60 +0xc3
github.com/docker/docker/vendor/github.com/containerd/containerd/api/services/tasks/v1.(*tasksClient).Delete(0xc422c96128, 0x555ab64151e0, 0xc420128040, 0xc428c04450, 0x0, 0x0, 0x0, 0xed66bcd50, 0x0, 0x0)
/go/src/github.com/docker/docker/vendor/github.com/containerd/containerd/api/services/tasks/v1/tasks.pb.go:430 +0xd4
github.com/docker/docker/vendor/github.com/containerd/containerd.(*task).Delete(0xc42463e8d0, 0x555ab64151e0, 0xc420128040, 0x0, 0x0, 0x0, 0xc42463e8d0, 0x0, 0x0)
/go/src/github.com/docker/docker/vendor/github.com/containerd/containerd/task.go:292 +0x24a
github.com/docker/docker/libcontainerd.(*client).DeleteTask(0xc4203d4e00, 0x555ab64151e0, 0xc420128040, 0xc421763740, 0x40, 0x0, 0x20, 0x20, 0x555ab5fc6920, 0x555ab4269945, ...)
/go/src/github.com/docker/docker/libcontainerd/client_daemon.go:504 +0xe2
github.com/docker/docker/daemon.(*Daemon).ProcessEvent(0xc4202c61c0, 0xc4216469c0, 0x40, 0x555ab57c9b55, 0x4, 0xc4216469c0, 0x40, 0xc421646a80, 0x40, 0x8f0000069c, ...)
/go/src/github.com/docker/docker/daemon/monitor.go:54 +0x23c
github.com/docker/docker/libcontainerd.(*client).processEvent.func1()
/go/src/github.com/docker/docker/libcontainerd/client_daemon.go:694 +0x130
github.com/docker/docker/libcontainerd.(*queue).append.func1(0xc421646900, 0x0, 0xc42a24e380, 0xc420300420, 0xc4203d4e58, 0xc4216469c0, 0x40)
/go/src/github.com/docker/docker/libcontainerd/queue.go:26 +0x3a
created by github.com/docker/docker/libcontainerd.(*queue).append
/go/src/github.com/docker/docker/libcontainerd/queue.go:22 +0x196
We are seeing very similar issues (docker ps works but docker inspect for example gets stuck). We are running kubernetes v1.17.6 with docker 19.3.8 on Fedora CoreOS.
 TeroPihlaja
on 18 Jun 2020
TeroPihlaja
on 18 Jun 2020
We have also encountered this issue where a container listed by docker ps hung on docker inspect
docker ps -a | tr -s " " | cut -d " " -f1 | xargs -Iarg sh -c 'echo arg; docker inspect arg> /dev/null'
In our case we noticed the affected container was stuck on runc init. We were having trouble attaching or trace the main thread of runc init. It seemed that signals were not being delivered. As far as we could tell the process was stuck in the kernel and not making transitions back to user space. I'm not really a linux kernel debugging expert, but from what I can tell this seems to be an issue with the kernel related to mount cleanup. Here's an example stack trace for what the runc init process is doing in kernel land.
[<0>] kmem_cache_alloc+0x162/0x1c0
[<0>] kmem_zone_alloc+0x61/0xe0 [xfs]
[<0>] xfs_buf_item_init+0x31/0x160 [xfs]
[<0>] _xfs_trans_bjoin+0x1e/0x50 [xfs]
[<0>] xfs_trans_read_buf_map+0x104/0x340 [xfs]
[<0>] xfs_imap_to_bp+0x67/0xd0 [xfs]
[<0>] xfs_iunlink_remove+0x16b/0x430 [xfs]
[<0>] xfs_ifree+0x42/0x140 [xfs]
[<0>] xfs_inactive_ifree+0x9e/0x1c0 [xfs]
[<0>] xfs_inactive+0x9e/0x140 [xfs]
[<0>] xfs_fs_destroy_inode+0xa8/0x1c0 [xfs]
[<0>] __dentry_kill+0xd5/0x170
[<0>] dentry_kill+0x4d/0x190
[<0>] dput.part.31+0xcb/0x110
[<0>] ovl_destroy_inode+0x15/0x60 [overlay]
[<0>] __dentry_kill+0xd5/0x170
[<0>] shrink_dentry_list+0x94/0x1b0
[<0>] shrink_dcache_parent+0x88/0x90
[<0>] do_one_tree+0xe/0x40
[<0>] shrink_dcache_for_umount+0x28/0x80
[<0>] generic_shutdown_super+0x1a/0x100
[<0>] kill_anon_super+0x14/0x30
[<0>] deactivate_locked_super+0x34/0x70
[<0>] cleanup_mnt+0x3b/0x70
[<0>] task_work_run+0x8a/0xb0
[<0>] exit_to_usermode_loop+0xeb/0xf0
[<0>] do_syscall_64+0x182/0x1b0
[<0>] entry_SYSCALL_64_after_hwframe+0x65/0xca
[<0>] 0xffffffffffffffff
Note also that restarting Docker removed the container from Docker which is enough to resolve the PLEG unhealthy issue, but did not remove the stuck runc init.
Edit: Versions for those interested:
Docker 19.03.8
runc 1.0.0-rc10
linux: 4.18.0-147.el8.x86_64
centos: 8.1.1911
 debugmiller
on 25 Jun 2020
debugmiller
on 25 Jun 2020
Is this issue resolved?
I am getting PLEG issues in my cluster and observed this open issue.
Is there any workaround for this?
 cshivashankar
on 26 Jun 2020
cshivashankar
on 26 Jun 2020
I have hit the PLEG issue too in my cluster which is up and in use for few days.
Setup
EKS cluster with K8S v1.15.11-eks-af3caf
Docker version 18.09.9-ce
Instance type is m5ad.4xlarge
Issue
Jul 08 04:12:36 ip-56-0-1-191.us-west-2.compute.internal kubelet[5354]: I0708 04:12:36.051162 5354 setters.go:533] Node became not ready: {Type:Ready Status:False LastHeartbeatTime:2020-07-08 04:12:36.051127368 +0000 UTC m=+4279967.056220983 LastTransitionTime:2020-07-08 04:12:36.051127368 +0000 UTC m=+4279967.056220983 Reason:KubeletNotReady Message:PLEG is not healthy: pleg was last seen active 3m9.146952991s ago; threshold is 3m0s}
Recovery
Kubelet restart recovered the node.
Is there a solution? Upgrading docker version works?
 mak-454
on 10 Jul 2020
mak-454
on 10 Jul 2020
maybe it's the problem of docker containers, eg. lots of zombie processes in container result in "docker ps/inspect " extremely slow
 jonesmith518
on 27 Jul 2020
jonesmith518
on 27 Jul 2020
a systemctl restart docker on all my workers fixed my issue.
 jetersen
on 4 Aug 2020
jetersen
on 4 Aug 2020
@jetersen do you have "live-restore" enabled on Docker?
The default is to restart all containers when you restart Docker, which is a pretty large hammer to hit the problem with.
bboreham
on 4 Aug 2020
@bboreham not as big as destroying and recreating the cluster 😅
jetersen
on 4 Aug 2020
I'm hitting this issue using Kubernetes 1.15.3, 1.16.3 as well as 1.17.9. On docker versions 18.6.3 (Container Linux) and 19.3.12 (Flatcar Linux).
There's about 50 pods on each node.
 FrederikNS
on 4 Sep 2020
FrederikNS
on 4 Sep 2020
We have also encountered this issue where a container listed by docker ps hung on docker inspect
docker ps -a | tr -s " " | cut -d " " -f1 | xargs -Iarg sh -c 'echo arg; docker inspect arg> /dev/null'In our case we noticed the affected container was stuck on
runc init. We were having trouble attaching or trace the main thread ofrunc init. It seemed that signals were not being delivered. As far as we could tell the process was stuck in the kernel and not making transitions back to user space. I'm not really a linux kernel debugging expert, but from what I can tell this seems to be an issue with the kernel related to mount cleanup. Here's an example stack trace for what therunc initprocess is doing in kernel land.[<0>] kmem_cache_alloc+0x162/0x1c0 [<0>] kmem_zone_alloc+0x61/0xe0 [xfs] [<0>] xfs_buf_item_init+0x31/0x160 [xfs] [<0>] _xfs_trans_bjoin+0x1e/0x50 [xfs] [<0>] xfs_trans_read_buf_map+0x104/0x340 [xfs] [<0>] xfs_imap_to_bp+0x67/0xd0 [xfs] [<0>] xfs_iunlink_remove+0x16b/0x430 [xfs] [<0>] xfs_ifree+0x42/0x140 [xfs] [<0>] xfs_inactive_ifree+0x9e/0x1c0 [xfs] [<0>] xfs_inactive+0x9e/0x140 [xfs] [<0>] xfs_fs_destroy_inode+0xa8/0x1c0 [xfs] [<0>] __dentry_kill+0xd5/0x170 [<0>] dentry_kill+0x4d/0x190 [<0>] dput.part.31+0xcb/0x110 [<0>] ovl_destroy_inode+0x15/0x60 [overlay] [<0>] __dentry_kill+0xd5/0x170 [<0>] shrink_dentry_list+0x94/0x1b0 [<0>] shrink_dcache_parent+0x88/0x90 [<0>] do_one_tree+0xe/0x40 [<0>] shrink_dcache_for_umount+0x28/0x80 [<0>] generic_shutdown_super+0x1a/0x100 [<0>] kill_anon_super+0x14/0x30 [<0>] deactivate_locked_super+0x34/0x70 [<0>] cleanup_mnt+0x3b/0x70 [<0>] task_work_run+0x8a/0xb0 [<0>] exit_to_usermode_loop+0xeb/0xf0 [<0>] do_syscall_64+0x182/0x1b0 [<0>] entry_SYSCALL_64_after_hwframe+0x65/0xca [<0>] 0xffffffffffffffffNote also that restarting Docker removed the container from Docker which is enough to resolve the PLEG unhealthy issue, but did not remove the stuck
runc init.Edit: Versions for those interested:
Docker 19.03.8
runc 1.0.0-rc10
linux: 4.18.0-147.el8.x86_64
centos: 8.1.1911
Has this problem been solved? In which version?
 liruishan
on 5 Sep 2020
liruishan
on 5 Sep 2020
mark
 neighbour-oldhuang
on 12 Oct 2020
neighbour-oldhuang
on 12 Oct 2020
Faced the issue again on eks with kubernetes version=v1.16.8-eks-e16311 and docker version=docker://19.3.6
Restarting docker and kubelet recovered the node.
mak-454
on 17 Nov 2020
@mak-454 I also encountered this issue on EKS today - would you mind sharing the region/AZ where your node was running, along with the duration of the issue? I'm curious to see if there might have been some underlying infra issue.
 JacobHenner
on 18 Nov 2020
JacobHenner
on 18 Nov 2020
@JacobHenner my nodes were running in eu-central-1 region.
mak-454
on 18 Nov 2020
encountered this issue on EKS (ca-central-1) with Kubernetes version "1.15.12" and docker version "19.03.6-ce"
After restarting docker/kubelet, there is this line in the node events:
Warning SystemOOM 14s (x3 over 14s) kubelet, ip-10-1-2-3.ca-central-1.compute.internal System OOM encountered
 imriss
on 18 Nov 2020
imriss
on 18 Nov 2020
Related issues
 caniszczyk
·
152Comments
thockin
·
140Comments
caniszczyk
·
152Comments
thockin
·
140Comments
 igorleao
·
181Comments
igorleao
·
181Comments
 shyamjvs
·
142Comments
shyamjvs
·
142Comments
 gjcarneiro
·
142Comments
gjcarneiro
·
142Comments
Most helpful comment
The PLEG health check does very little. In every iteration, it calls
docker psto detect container states changes, and calldocker psandinspectto get the details of those containers.After finishing each iteration, it updates a timestamp. If the timestamp hasn't been updated for a while (i.e., 3 minutes), the health check fails.
Unless your node is loaded with huge number of pods that PLEG can't finish doing all these in 3 minutes (which should not happen), the most probable cause would be that docker is slow. You may not observe that in your occasional
docker pscheck, but that doesn't mean it's not there.If we don't expose the "unhealthy" status, it'd hide many problems from the users and potentially cause more issue. For example, kubelet'd silently not reacting to changes in a timely manner and cause even more confusion.
Suggestions on how to make this more debuggable are welcome...