kube-state-metrics keep serving stale metrics after extended apiserver outage
Is this a BUG REPORT or FEATURE REQUEST?:
/kind bug
What happened:
We wanted to check the metrics for some pods and realised we don't have metrics for the pod in question, then check the deployment and other resources, no metrics are there, but some other pod metrics were available.
We checked the metrics exposed from the /metrics endpoint and we saw metrics exposed for pods which are deleted 2+ weeks ago.
So kube-state-metrics were reporting stale metrics for last 3 weeks.
Here are some relevant logs from kube-state-metrics pod:
2019-02-10T21:56:52.294138617Z E0210 21:56:52.293444       1 streamwatcher.go:109] Unable to decode an event from the watch stream: http2: server sent GOAWAY and closed the connection; LastStreamID=124961, ErrCode=NO_ERROR, debug=""
2019-02-10T21:56:52.295193557Z E0210 21:56:52.293956       1 streamwatcher.go:109] Unable to decode an event from the watch stream: http2: server sent GOAWAY and closed the connection; LastStreamID=124961, ErrCode=NO_ERROR, debug=""
2019-02-10T21:56:52.295465367Z E0210 21:56:52.294137       1 streamwatcher.go:109] Unable to decode an event from the watch stream: http2: server sent GOAWAY and closed the connection; LastStreamID=124961, ErrCode=NO_ERROR, debug=""
2019-02-10T21:56:52.29578788Z E0210 21:56:52.294170       1 streamwatcher.go:109] Unable to decode an event from the watch stream: http2: server sent GOAWAY and closed the connection; LastStreamID=124961, ErrCode=NO_ERROR, debug=""
... There are total of 17 `Unable to decode an event` logs within same second

2019-02-10T21:56:52.321674569Z W0210 21:56:52.321518       1 reflector.go:341] k8s.io/kube-state-metrics/pkg/collectors/collectors.go:91: watch of *v1.Endpoints ended with: very short watch: k8s.io/kube-state-metrics/pkg/collectors/collectors.go:91: Unexpected watch close - watch lasted less than a second and no items received
2019-02-10T21:56:52.322241891Z W0210 21:56:52.322003       1 reflector.go:341] k8s.io/kube-state-metrics/pkg/collectors/collectors.go:91: watch of *v1beta1.CronJob ended with: very short watch: k8s.io/kube-state-metrics/pkg/collectors/collectors.go:91: Unexpected watch close - watch lasted less than a second and no items received
... There are total of 17 `Unexpected watch close` logs within same second

# here the logs pivoted to `TLS handshake timeout`
2019-02-10T21:57:03.330774532Z E0210 21:57:03.330640       1 reflector.go:205] k8s.io/kube-state-metrics/pkg/collectors/collectors.go:91: Failed to list *v1.Pod: Get https://msa-dev-az-xxxxxx.hcp.eastus.azmk8s.io:443/api/v1/pods?limit=500&resourceVersion=0: net/http: TLS handshake timeout
...
... # there are quite many `net/http: TLS handshake timeout` messages here until the logs stop
...
2019-02-10T21:57:25.366656235Z E0210 21:57:25.366563       1 reflector.go:205] k8s.io/kube-state-metrics/pkg/collectors/collectors.go:91: Failed to list *v1.PersistentVolumeClaim: Get https://msa-dev-az-xxxxxx.hcp.eastus.azmk8s.io:443/api/v1/persistentvolumeclaims?limit=500&resourceVersion=0: net/http: TLS handshake timeout
2019-02-10T21:57:25.367127153Z E0210 21:57:25.366998       1 reflector.go:205] k8s.io/kube-state-metrics/pkg/collectors/collectors.go:91: Failed to list *v2beta1.HorizontalPodAutoscaler: Get https://msa-dev--xxxxxx.hcp.eastus.azmk8s.io:443/apis/autoscaling/v2beta1/horizontalpodautoscalers?limit=500&resourceVersion=0: net/http: TLS handshake timeout
# this is the very last log line, current date is 2019-03-04 and still no logs, pod is still up and reporting stale metrics from that time, so last log line was 3 weeks ago
What you expected to happen:
kube-state-metrics should not be serving stale metrics more than a certain time (I'd say at most couple of minutes for our case).
Seems like the kube-state-metrics didn't try to reconnect to the kube-apiserver after having some issues with the kube-apiserver.
Instead of keep serving stale metrics kube-state-metrics should at least panic out our report unhealthy status.
How to reproduce it (as minimally and precisely as possible):
We didn't reproduce it yet. I'll update if we are able to reproduce.
Anything else we need to know?:
Here is a summary of the deployment status:
$ ptc msai msa-dev:seed insight deployment/msa-monitoring-kube-state-metrics -n monitoring   -r
Deployment/msa-monitoring-kube-state-metrics[monitoring], created 2 months ago
  desired:1, existing:1, ready:1, updated:1, available:1
  Available:True for 2 months MinimumReplicasAvailable :'Deployment has minimum availability.' last update was 2 months ago
  Progressing:True for 2 months NewReplicaSetAvailable :'ReplicaSet "msa-monitoring-kube-state-metrics-6bb98dc558" has successfully progressed.' last update was 2 months ago
Pod/msa-monitoring-kube-state-metrics-6bb98dc558-tlfvb[monitoring], created 2 months ago
  Running BestEffort
  Initialized:True for 2 months
  Ready:True for 4 days
  ContainersReady:True
  PodScheduled:True for 2 months
  Container: kube-state-metrics deploys quay.io/coreos/kube-state-metrics:v1.4.0
    ready:True
    state: running for 2 months
Environment:
- Kubernetes version (use
kubectl version):v1.11.5-->Server Version: version.Info{Major:"1", Minor:"11", GitVersion:"v1.11.5", GitCommit:"753b2dbc622f5cc417845f0ff8a77f539a4213ea", GitTreeState:"clean", BuildDate:"2018-11-26T14:31:35Z", GoVersion:"go1.10.3", Compiler:"gc", Platform:"linux/amd64"} - Kube-state-metrics image version:
quay.io/coreos/kube-state-metrics:v1.4.0
 bergerx
All 34 comments
Interesting, thanks for the bug report @bergerx.
We depend on Kubernetes client-go reflectors to keep our caches in sync. Reflectors have the option of specifying a resync interval, which we currently disable. I feel like a first step would be to enable the resync interval to have a periodic full resync cycle next to the adhoc diff notifications.
In addition we should also add proper instrumentation to the metric store implementation to catch issues like this early.
Would this be something you would like to contribute @bergerx? Shouldn't be a big patch, I am happy to guide you along the way.
//CC @mgoodness Crossreferencing this Twitter report: https://twitter.com/opsgoodness/status/1098266699382620160
 mxinden
on 5 Mar 2019
mxinden
on 5 Mar 2019
I came here from a Google search for the same error and posting here in case they're related. I have a single kube-state-metrics pod that has been running for 26 days. I have an alert that started firing
kube_daemonset_status_number_ready{job="kube-state-metrics"}
  / kube_daemonset_status_desired_number_scheduled{job="kube-state-metrics"}
  * 100 < 100
and upon viewing logs for that pod I saw similar entries as the above, without the TLS errors
2019-05-17T16:04:53.573452071Z E0517 16:04:53.573302       1 streamwatcher.go:109] Unable to decode an event from the watch stream: http2: server sent GOAWAY and closed the connection; LastStreamID=2351, ErrCode=NO_ERROR, debug=""
2019-05-17T16:04:53.574364247Z E0517 16:04:53.574288       1 streamwatcher.go:109] Unable to decode an event from the watch stream: http2: server sent GOAWAY and closed the connection; LastStreamID=2351, ErrCode=NO_ERROR, debug=""
2019-05-17T16:04:53.574739793Z E0517 16:04:53.574660       1 streamwatcher.go:109] Unable to decode an event from the watch stream: http2: server sent GOAWAY and closed the connection; LastStreamID=2351, ErrCode=NO_ERROR, debug=""
2019-05-17T16:04:53.575269397Z E0517 16:04:53.575185       1 streamwatcher.go:109] Unable to decode an event from the watch stream: http2: server sent GOAWAY and closed the connection; LastStreamID=2351, ErrCode=NO_ERROR, debug=""
......
2019-05-17T16:04:53.577591604Z W0517 16:04:53.576601       1 reflector.go:341] k8s.io/kube-state-metrics/pkg/collectors/collectors.go:91: watch of *v1.Job ended with: very short watch: k8s.io/kube-state-metrics/pkg/collectors/collectors.go:91: Unexpected watch close - watch lasted less than a second and no items received
2019-05-17T16:04:53.577606944Z E0517 16:04:53.576682       1 reflector.go:322] k8s.io/kube-state-metrics/pkg/collectors/collectors.go:91: Failed to watch *v1.LimitRange: Get https://100.64.0.1:443/api/v1/limitranges?resourceVersion=55151870&timeoutSeconds=398&watch=true: dial tcp 100.64.0.1:443: connect: connection refused
.....
2019-05-17T16:04:53.677478437Z W0517 16:04:53.677302       1 reflector.go:341] k8s.io/kube-state-metrics/pkg/collectors/collectors.go:91: watch of *v1beta1.CronJob ended with: too old resource version: 55151873 (66552376)
2019-05-17T16:04:53.706509998Z W0517 16:04:53.706369       1 reflector.go:341] k8s.io/kube-state-metrics/pkg/collectors/collectors.go:91: watch of *v1.ReplicationController ended with: too old resource version: 55151870 (66552374)
2019-05-17T16:04:53.995074558Z W0517 16:04:53.994876       1 reflector.go:341] k8s.io/kube-state-metrics/pkg/collectors/collectors.go:91: watch of *v1.PersistentVolumeClaim ended with: too old resource version: 55151870 (66552374)
The last log line for my pod is from 5/17, but current date is 5/29.
 transient1
on 29 May 2019
transient1
on 29 May 2019
that means that that hasn't happened since then, that is a good thing :) watches being renewed is a perfectly normal thing, nothing to be worried about
 brancz
on 29 May 2019
brancz
on 29 May 2019
Ah, okay. Then I have a different problem I need to track down. Thanks!
transient1
on 29 May 2019
Issues go stale after 90d of inactivity.
Mark the issue as fresh with /remove-lifecycle stale.
Stale issues rot after an additional 30d of inactivity and eventually close.
If this issue is safe to close now please do so with /close.
Send feedback to sig-testing, kubernetes/test-infra and/or fejta.
/lifecycle stale
 fejta-bot
on 27 Aug 2019
fejta-bot
on 27 Aug 2019
Stale issues rot after 30d of inactivity.
Mark the issue as fresh with /remove-lifecycle rotten.
Rotten issues close after an additional 30d of inactivity.
If this issue is safe to close now please do so with /close.
Send feedback to sig-testing, kubernetes/test-infra and/or fejta.
/lifecycle rotten
fejta-bot
on 26 Sep 2019
/remove-lifecycle stale.
I don't think this is being worked on
bergerx
on 2 Oct 2019
/remove-lifecycle rotten
bergerx
on 2 Oct 2019
Issues go stale after 90d of inactivity.
Mark the issue as fresh with /remove-lifecycle stale.
Stale issues rot after an additional 30d of inactivity and eventually close.
If this issue is safe to close now please do so with /close.
Send feedback to sig-testing, kubernetes/test-infra and/or fejta.
/lifecycle stale
fejta-bot
on 31 Dec 2019
/remove-lifecycle stale
We are not hit by this recently, but the original issue doesn't seem to be solved as per @mxinden s first comment in this issue:, the NewReflector is called with resyncPeriod=0 here:
From https://godoc.org/k8s.io/client-go/tools/cache#NewReflector:
func NewReflector(lw ListerWatcher, expectedType interface{}, store Store, resyncPeriod time.Duration) *Reflector
... If resyncPeriod is non-zero, then lists will be executed after every resyncPeriod, so that you can use reflectors to periodically process everything as well as incrementally processing the things that change.
bergerx
on 31 Dec 2019
Resync is really only for external reconciliation, where something external could be modifying the state we're reconciling, but the state that we're reconciling is entirely in-memory state of kube-state-metrics, which is not prone to that. Resync only re-processes items that we already know about, _relists_ already happen automatically on connection resets or similar, which is what the initial report here was about as the apiserver was actually unavailable.
brancz
on 7 Jan 2020
we hit this issue in ~10 clusters among 45 within ~2 months.
k8s server => v1.14.9-eks-502bfb
kube-state-metrics => quay.io/coreos/kube-state-metrics:v1.9.1
prometheus => prom/prometheus:v2.15.2
 ekesken
on 17 Mar 2020
ekesken
on 17 Mar 2020
Do you run kube-state-metrics in some specific way? With versions pre-1.9.0 you may be experiencing https://github.com/kubernetes/kube-state-metrics/issues/942, if you're configuring individual namespaces. (note 1.14 is not supported by ksm 1.9.0)
Is anyone able to reliably reproduce this issue?
brancz
on 18 Mar 2020
Issues go stale after 90d of inactivity.
Mark the issue as fresh with /remove-lifecycle stale.
Stale issues rot after an additional 30d of inactivity and eventually close.
If this issue is safe to close now please do so with /close.
Send feedback to sig-testing, kubernetes/test-infra and/or fejta.
/lifecycle stale
fejta-bot
on 16 Jun 2020
/remove-lifecycle stale
we're still observing this issue in our clusters.
ekesken
on 16 Jun 2020
@ekesken can you answer the question from Frederic if you are still running into this issue? :)
 lilic
on 16 Jun 2020
lilic
on 16 Jun 2020
@brancz
Do you run kube-state-metrics in some specific way?
we use 10.4.0 version of prometheus helm chart: https://github.com/helm/charts/blame/3944b1421eb039725816c905c00608193226b001/stable/prometheus/Chart.yaml
This is our diff for the settings:
kubeStateMetrics:
  podDisruptionBudget:
    enabled: true

  priorityClassName: "some-class"

  args:
   port: 8080
   telemetry-port: 8081
   namespace: some-namespace,kube-system,argo-cd,default

  tolerations:
    - key: "some-internal-name.com/dedicated"
      operator: "Equal"
      value: "cluster-management"
      effect: "NoSchedule"

  nodeSelector:
    unicron.mpi-internal.com/role: "mgmt"

  resources:
    limits:
      cpu: 200m
      memory: 256Mi
    requests:
      cpu: 100m
      memory: 200Mi
With versions pre-1.9.0 you may be experiencing #942
we're using 1.9.1
if you're configuring individual namespaces. (note 1.14 is not supported by ksm 1.9.0)
yes we do, and as I can see 1.16 is the only supported version for 1.9.5, unfortunately we don't have 1.16 clusters to observe the situation.
Is anyone able to reliably reproduce this issue?
we don't have a clue about the reason to reproduce it, but we keep observing the issue in our clusters in AWS EKS with the version v1.14.9-eks-f459c0
ekesken
on 16 Jun 2020
cc @tariq1890 don't have much experience with the ksm helm chart can you have a look.
lilic
on 16 Jun 2020
Aha i just came across this in https://github.com/kubernetes/kube-state-metrics/blob/1dfe6681e990623a4078b4e53a2e3c8761e213c6/docs/design/metrics-store-performance-optimization.md:
Kube-state-metrics listens on add, update and delete events via Kubernetes client-go reflectors. On add and update events kube-state-metrics generates all time series related to the Kubernetes object based on the event’s payload, concatenates the time series to a single byte slice and sets / replaces the byte slice in the store at the uuid of the Kubernetes object. One can precompute the length of a time series byte slice before allocation as the sum of the length of the metric name, label keys and values as well as the metric value in string representation. On delete events kube-state-metrics deletes the uuid entry of the given Kubernetes object in the cache map.
I didn't check the code but if this optimisation went in, and the deletion of the cached object are now depending on the events, could it be that the stale pod metrics persist if a pod delete event is missed by the ksm while it's trying to reconnecting to api-server restart right after an api-server disconnect for whatever reason.
bergerx
on 24 Jun 2020
It always depended on delete's to remove objects from cache before and after the optimizations. What was optimized was the cache itself. Is anyone still experiencing this with the latest patch release of kube-state-metrics 1.9 and a Kubernetes 1.18 cluster?
brancz
on 26 Jun 2020
Oh, so you mean ksm has always been edge triggered only, as in level-vs-edge-triggered, not level.
I can't comment on your question as we are not yet on Kubernetes 1.18. But here is a scenario that can likely happen for AKS case:
- api-server outages are not something really rare
- api-server (master components) are hosted by azure and they are not visible to users
- master components (including apiserver and controller manager) and nodes are in different networks, and so Nodes (kubelets) and workloads running on the nodes (which includes operators running in the cluster and also ksm), are reaching out to the apiserver through en external LB,
- api-server and controller-manager may be up and running at a given time, but api-server may not yet be available to the workload on the node pools e.g. during cluster updates
- if somehow a pod is deleted and the event is fired during this time ksm can miss some delete events, not likely on small clusters, but can happen on busy clusters with frequent api-server outages.
bergerx
on 27 Jun 2020
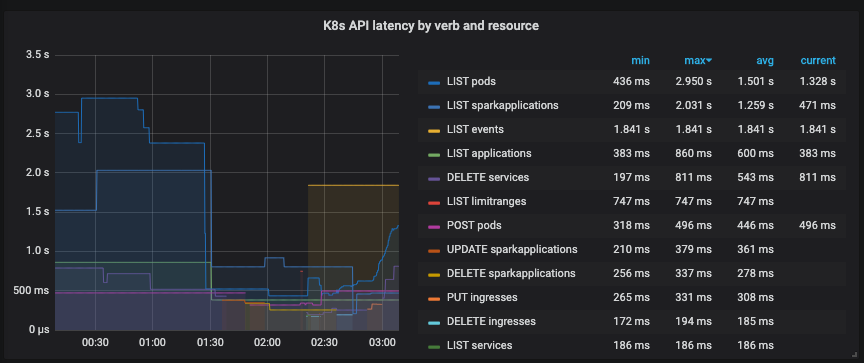
we had the problem again, and we can observe the latency increase in "LIST events" calls during the incident, supporting the theory of @bergerx:
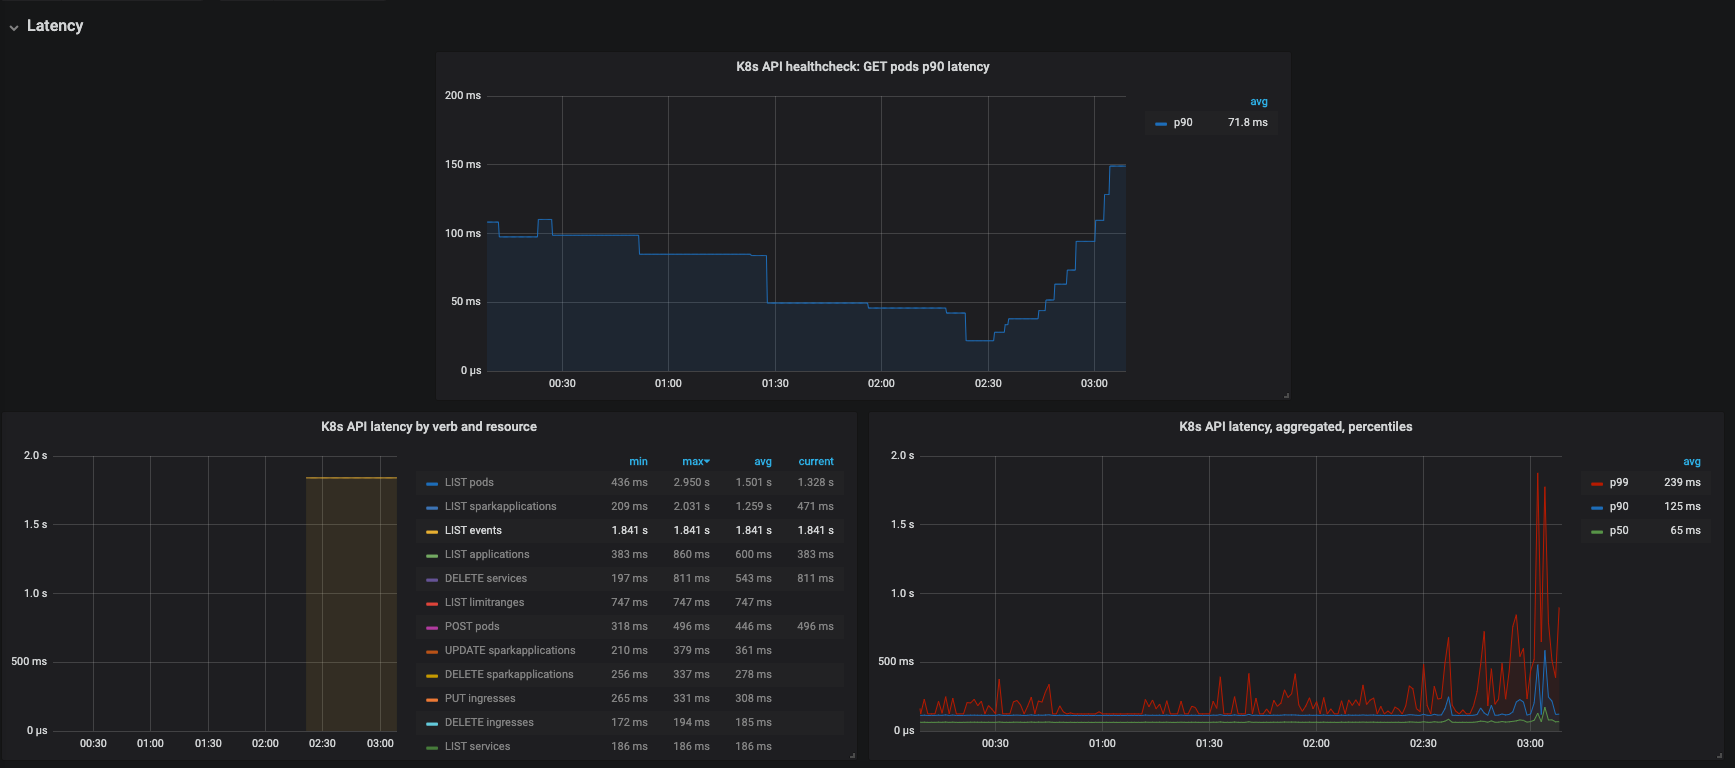
and top latencies for all the operations at that time (the problem was starting at ~2:15):
ekesken
on 24 Jul 2020
Issues go stale after 90d of inactivity.
Mark the issue as fresh with /remove-lifecycle stale.
Stale issues rot after an additional 30d of inactivity and eventually close.
If this issue is safe to close now please do so with /close.
Send feedback to sig-testing, kubernetes/test-infra and/or fejta.
/lifecycle stale
fejta-bot
on 22 Oct 2020
Seems like still impacting.
bergerx
on 5 Nov 2020
I know that there are a lot of optimisations are in the ksm for covering huge clusters or clusters with lots of resources on those. But i'm curious if would it be possible to catch the apiserver reconnections and trigger some kind of full reconcile. Or maybe just fail out in case of apiserver unavailability, this keeps giving us stale and misleading information in so many different ways.
bergerx
on 5 Nov 2020
We have a hunch on what might be going on, but we're currently 100% focused on the 2.0 release. After that's finished up, we'll get right on this.
brancz
on 11 Nov 2020
Ah i just came across this from https://kubernetes.io/docs/reference/using-api/api-concepts/#efficient-detection-of-changes:
A given Kubernetes server will only preserve a historical list of changes for a limited time. Clusters using etcd3 preserve changes in the last 5 minutes by default. When the requested watch operations fail because the historical version of that resource is not available, clients must handle the case by recognizing the status code 410 Gone, clearing their local cache, performing a list operation, and starting the watch from the resourceVersion returned by that new list operation. Most client libraries offer some form of standard tool for this logic. (In Go this is called a Reflector and is located in the k8s.io/client-go/cache package.)
Could this issue be triggered when the apiserver is not reachable by ksm for more than this 5 minute window?
bergerx
on 20 Nov 2020
Stale issues rot after 30d of inactivity.
Mark the issue as fresh with /remove-lifecycle rotten.
Rotten issues close after an additional 30d of inactivity.
If this issue is safe to close now please do so with /close.
Send feedback to sig-testing, kubernetes/test-infra and/or fejta.
/lifecycle rotten
fejta-bot
on 20 Dec 2020
/remove-lifecycle rotten
bergerx
on 20 Dec 2020
@bergerx I tried to reproduce on my cluster and asked our Red Hat OpenShift QE to try to reproduce but we have not had any luck so far. We also did not get any reports from our customers so far that I know of for this bug. Can you possibly provide with exact steps, this would make it easier to fix it. thanks!
Note to anyone in this issue, you are welcome to also give it a try in fixing this, PRs are always welcome, we can backport the fix to 1.9 as well as into 2.0!
lilic
on 8 Jan 2021
I started to think this issue to be mainly happening on to hosted Kubernetes services like AKS and EKS. There are many here using it without any issue, and there is another set of users who are repeatedly experiencing issues.
Also see this weird issue stops suddenly stopping for some set of users in a python implementation.
https://github.com/kiwigrid/k8s-sidecar/issues/85
Maybe the issue is lying in the way how the apiserver is hosted behind a managed load balancer.
@lilic I belive you can reproduce this if you try this on an AKS cluster. Most users complaining here are using AKS/EKS.
bergerx
on 11 Feb 2021
Actually lets do a quick poll among AKS/EKS users, can you vote this entry with:
- upvote (:+1: ) if you are experiencing issue on AKS/EKS
- downvote (:-1: ) if you are not experincing this issue on AKS/EKS
bergerx
on 11 Feb 2021
@bergerx Found an issue that manifests only when the sharded implementation is used (see #1390 ). This could explain why only a subset of the users see this.
 andreihagiescu
on 22 Feb 2021
andreihagiescu
on 22 Feb 2021
Hello! I am not sure, whether this issue has the similar root casue with the one that we are now facing ( please see #1467 ). We also have AKS, and we have multiple pods (jobs) that run for a short period of time (a couple of seconds for some of them) and then terminate (with reason Completed), and when we make a query with kube_pod_start_time for every pod - we get the expected result (that is the timestamp when the pod started). But now we want to get the timestamps when the Containers were started, so we use kube_pod_container_state_started and it appears that it works for some pods and doesn't show the result for others (while other queries, including kube_pod_start_time show the result for all of the pods). If we check the pods with kubectl describe pod [pod_name] - the values we need (container start time) are present.
Maybe our issue is also somehow connected to caching? But we don't see any warnings, or timeout, or error in the kube-state-metrics pod's logs.
And the most interesting part is that we can successfully get metrics for the pods in question with kube_pod_start_time , while kube_pod_container_state_started doesn't work for the same pods (but it work for some other pods in the same namespace).
 AnastasiaBlack
on 28 Apr 2021
AnastasiaBlack
on 28 Apr 2021
Related issues
 loveyang2012
·
7Comments
lilic
·
3Comments
loveyang2012
·
7Comments
lilic
·
3Comments
 mikekap
·
8Comments
mikekap
·
8Comments
 towolf
·
8Comments
towolf
·
8Comments
 tariq1890
·
6Comments
tariq1890
·
6Comments
Most helpful comment
Actually lets do a quick poll among AKS/EKS users, can you vote this entry with: