Kube-state-metrics: kube_pod_container_resource_requests_cpu_cores shows evicted pods
Just noticed that the kube_pod_container_resource_requests_cpu_cores shows evicted pods causing issues in trying to monitor the status of just running pods.
I tried looking at kube_pod_labels to see if I can ignore evicted pods but that does not show it as well.
 ptagr
ptagr
All 35 comments
You can use the condition metrics to only show running pods.
 brancz
on 24 May 2018
brancz
on 24 May 2018
The phase of kube_pod_status_phase metrics should tell whether the pod is running or not.
 andyxning
on 24 May 2018
andyxning
on 24 May 2018
Issues go stale after 90d of inactivity.
Mark the issue as fresh with /remove-lifecycle stale.
Stale issues rot after an additional 30d of inactivity and eventually close.
If this issue is safe to close now please do so with /close.
Send feedback to sig-testing, kubernetes/test-infra and/or fejta.
/lifecycle stale
 fejta-bot
on 22 Aug 2018
fejta-bot
on 22 Aug 2018
This is a problem for me too. @brancz what do you mean by the condition metrics?
 2rs2ts
on 7 Sep 2018
2rs2ts
on 7 Sep 2018
join kube_pod_container_resource_requests_cpu_cores with kube_pod_status_phase and then filter by phase label.
andyxning
on 10 Sep 2018
Is kube_pod_status_phase a "condition metric"?
My company uses the datadog integration for these metrics and I plan on reporting this as an issue to them, so more details will help.
2rs2ts
on 10 Sep 2018
According to the code in https://github.com/kubernetes/kube-state-metrics/blob/master/pkg/collectors/pod.go#L351-L359, it actually reflects the pod phase.
andyxning
on 11 Sep 2018
What is the purpose of collecting cpu requests on evicted pods? Would you accept a PR that removes those pods from the metric?
 mariusgrigoriu
on 27 Sep 2018
mariusgrigoriu
on 27 Sep 2018
Stale issues rot after 30d of inactivity.
Mark the issue as fresh with /remove-lifecycle rotten.
Rotten issues close after an additional 30d of inactivity.
If this issue is safe to close now please do so with /close.
Send feedback to sig-testing, kubernetes/test-infra and/or fejta.
/lifecycle rotten
fejta-bot
on 27 Oct 2018
/remove-lifecycle rotten
2rs2ts
on 29 Oct 2018
I'm interested in this too.
We're using kube-state-metrics with the datadog agent and would like to monitor when our clusters are close having unschedulable pods due to resource constraints (primarily CPU or memory).
For now, we're monitoring whether the sum of kube_pod_container_resource_requests_cpu_cores is close to the sum of kube_node_status_capacity_cpu_cores. That gives us a rough approximation, but isn't quite right because kube_pod_container_resource_requests_cpu_cores includes the CPU requests for pods that are in the Completed (and presumably evicted) state.
That makes it possible for our monitoring to say the cluster is approaching 100% capacity, even when there's enough room for pods to be scheduled.
join kube_pod_container_resource_requests_cpu_cores with kube_pod_status_phase and then filter by phase label.
This is interesting. Is the recommendation to open a PR or issue on the datadog agent (https://github.com/DataDog/integrations-core/blob/master/kubernetes_state/datadog_checks/kubernetes_state/kubernetes_state.py) so it creates derivative metrics that combine values from KSM?
 yob
on 7 Nov 2018
yob
on 7 Nov 2018
@yob I would expect DataDog's query engine to support join operations, but I'm not familiar enough with DataDog to answer if or how.
brancz
on 7 Nov 2018
Thanks @brancz, I've opened an feature request on the datadog agent https://github.com/DataDog/integrations-core/issues/2521
yob
on 7 Nov 2018
I would expect DataDog's query engine to support join operations
it doesn't. I asked their support. they told me it'd have to be done client-side, and basically told me to build it myself if I wanted it in our lifetimes.
edit: I was thinking of a different request that they deprioritized. this one they told me would be high priority. it's been a few months though :(
2rs2ts
on 7 Nov 2018
DataDog aside, it is misleading to include evicted and completed pods in this metric. Under what cases would anyone want to use the metric as is? I can’t think of one. Rather than force all users to remember to join in order to use this metric correctly, shall we just make it work the way we would expect?
mariusgrigoriu
on 7 Nov 2018
The rule we stick consistently with is we create metrics for any object that the Kubernetes API returns. If a Pod stays for long in an eviction state that sounds like no suitable host is found, and therefore that pod would still take up resource on the current host. I don’t think even if we didn’t have that rule, that there would be a clear answer.
For what it’s worth, if DataDog decides to build an integration on the assumption of a different monitoring system, then DataDog should ensure to satisfy those (I realize this doesn’t change that they probably won’t implement it, but want to make sure we’re looking at the whole picture).
brancz
on 8 Nov 2018
Thanks @2rs2ts and @yob for raising https://github.com/DataDog/integrations-core/issues/2521. You're right, our query system doesn't allow join operations on different timeseries, we usually solve that client side (see the label_join option in the openmetrics check).
For other users interested in this, we fixed it for kubernetes.*.limits and kubernetes.*.requests metrics (which we get from the kubelet) by excluding pods that are in a phase where they won't count against node limits. This fix will go out with agent 6.8 in a few weeks.
The missing phase tag on pod metrics from kube-state-metrics is an oversight from us and we'll fix that shortly as well.
 hkaj
on 20 Nov 2018
hkaj
on 20 Nov 2018
@hkaj, as you work at DataDog, could I ask you to remove reference to kube-state-metrics in your offering? We get numerous bug reports from DataDog users along the same lines as this one and I totally understand that DataDog does the changes such as the one you have described above, but that makes it not equivalent to kube-state-metrics, yet we still get the bug reports. It would be nice if we could turn this around and bug reports from datadog users first go to you instead and you can weed out that it is not because of datadog or the shim you have between datadog and kube-state-metrics. Of course whenever there is a bug in kube-state-metrics we’re more than happy to address it :) .
brancz
on 20 Nov 2018
Hi @brancz,
We're big fans of kube-state-metrics and consider the metrics it provides to be a critical part of monitoring any k8s environment. Whether our own internal Kubernetes clusters or those of our customers.
With that in mind we provide information for how to use kube-state-metrics in our docs, and list the kube-state-metrics chart as a requirement in our datadog chart.
We never expected our users to come to you directly for help with how to use the two together. Apologies if we're causing pain here, that was never our intention.
Will you be at CloudNativeCon / KubeCon in a few weeks? It would be great to meetup and talk through how we can reduce/eliminate any burden we might be placing on you and the other KSM maintainers. Alternatively, we're happy to do it on the next sig-instrumentation call. We have some ideas on how we contribute to KSM in terms of time, people and code.
hkaj
on 21 Nov 2018
That sounds wonderful! Either works for me I will be at KubeCon in Seattle and I will be at the sig-instrumentation meetings :slightly_smiling_face: .
brancz
on 21 Nov 2018
Issues go stale after 90d of inactivity.
Mark the issue as fresh with /remove-lifecycle stale.
Stale issues rot after an additional 30d of inactivity and eventually close.
If this issue is safe to close now please do so with /close.
Send feedback to sig-testing, kubernetes/test-infra and/or fejta.
/lifecycle stale
fejta-bot
on 19 Feb 2019
Hello I just had the same issue and wanted to fully understand this.
From @brancz 's https://github.com/kubernetes/kube-state-metrics/issues/458#issuecomment-436893103
The rule we stick consistently with is we create metrics for any object that the Kubernetes API returns. If a Pod stays for long in an eviction state that sounds like no suitable host is found, and therefore that pod would still take up resource on the current host. I don’t think even if we didn’t have that rule, that there would be a clear answer.
This brings up two points for me:
If a Pod stays for long in an eviction state that sounds like no suitable host is found
What if a new pod was created by a replication controller, deployment, ... and it was succesfully allocated while the old one was never removed? I just want to make sure that this assumption is solid enough for all cases.
And finally note the differences when I describe a particular node
kubectl describe no <node>
...

Allocated resources:
  (Total limits may be over 100 percent, i.e., overcommitted.)
  CPU Requests  CPU Limits    Memory Requests  Memory Limits
  ------------  ----------    ---------------  -------------
  4877m (61%)   8565m (108%)  12280Mi (46%)    23428Mi (88%)
But when I look at the kube-state-metrics metrics for this node I get:
- Requested memory:
sum(kube_pod_container_resource_requests_memory_bytes{node="<node>"})= 90185924608 ~90GB - Allocatable Memory kube_node_status_allocatable_memory_bytes{node="node"} = 27865522176 ~27GB
The ~90GB requested memory from kube-state-metrics is indeed due to evicted pods but my point here is that for my usecase it would be more useful if the reported data matched the answer I got from kubelet while doing kubectl describe no <node> or at least allow me to filter it in a simple way with the phase label.
On a side note, if anyone wants to see a consistent response with the current metrics, here is your query
sum(sum(kube_pod_container_resource_requests_memory_bytes) by (namespace, pod, node) * on (pod) group_left() (sum(kube_pod_status_phase{phase="Running"}) by (pod, namespace) == 1)) by (node)
@brancz Before I leave I'd like to know if there is a posibility to change the way its working right now, if there is just let me know and I might be able to find the time to help you guys do it in a PR.
Thanks!
 jesusvazquez
on 5 Mar 2019
jesusvazquez
on 5 Mar 2019
As we do want metrics for any state of pods, I don't think there is a way to improve this, but your query looks great. I would suggest we document it here: https://github.com/kubernetes/kube-state-metrics/tree/master/docs#join-metrics. What do you think?
brancz
on 5 Mar 2019
Sure I'll add it to the docs! Right before that could you please expand a bit on this
As we do want metrics for any state of pods, I don't think there is a way to improve this,
I think I'm still missing a bit your goal here and I want to fully understand it.
jesusvazquez
on 5 Mar 2019
We for example want to be able to aggregate the amount of resources of pods that are in Pending state, for example because the cluster currently does not have capacity to schedule them. There are countless scenarios, which is why early on we decided in kube-state-metrics we would always expose unmodified raw data.
brancz
on 5 Mar 2019
That makes a lot of sense, however if you added the phase label to all this metrics wouldn't you have the same? And you will avoid doing countless joins for countless scenarios.
jesusvazquez
on 5 Mar 2019
Having the phase label on the time-series would mean that we break time-series when the phase changes, as that uniquely identifies the time-series. What this would look like to users is that graphs would look broken, when they're not.
brancz
on 5 Mar 2019
Hi!
First I'd like to thank you again for dedicating your time and helping me get to the bottom of this.
Allow me to quote
would mean that we break time-series when the phase changes
and
graphs would look broken
If I'm getting this right you're afraid that users will see a behaviour like
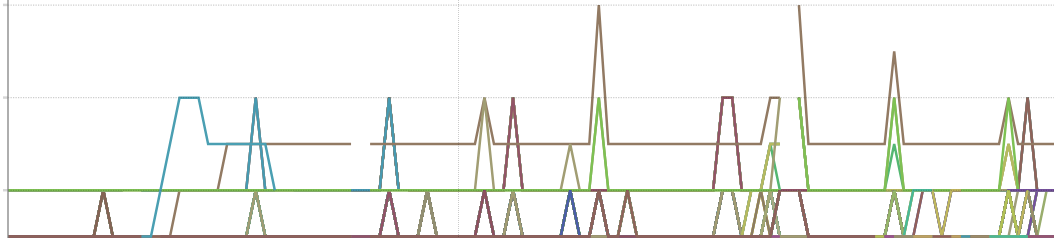
as something that is broken.
By adding the phase label to the kube_pod_container_resource_requests_memory_bytes metric we would be adding the 5th dimension to all related time series. This would mean that everything that was possible before would still be with queries like:
sum(kube_pod_container_resource_requests_memory_bytes) by (namespace, pod, node)
or
sum(kube_pod_container_resource_requests_memory_bytes) without (phase)
And then this 5th dimension opens up a new set of possibilities where you can simplify queries like :
sum(sum(kube_pod_container_resource_requests_memory_bytes) by (namespace, pod, node) * on (pod) group_left() (sum(kube_pod_status_phase{phase="Running"}) by (pod, namespace) == 1)) by (node)
into:
sum(kube_pod_container_resource_requests_memory_bytes{phase="Running"}) by (node)
Before you mentioned the idea aggregate the amount of resources of pods that are in Pending state. In the case of memory that would look like
sum(kube_pod_container_resource_requests_memory_bytes{phase="Pending"}) by (node)
So what we're gaining is a lot of flexibility in terms of querying capabilities and as a user I'd love this.
Now in terms of cardinality, which is the only downside I see right now, we would be adding at most 7 phases acording to the Official Documentation Pod Lifecycle. I don't see this as a potential cardinality bomb becuase there probably won't be a explosion of new states since the pod lifecycle is a well known and defined process.
jesusvazquez
on 5 Mar 2019
Now in terms of cardinality, which is the only downside I see right now, we would be adding at most 7 phases acording to the Official Documentation Pod Lifecycle. I don't see this as a potential cardinality bomb becuase there probably won't be a explosion of new states since the pod lifecycle is a well known and defined process.
But it would multiply the existing amount of metrics by 7, which is a lot given that the cardinality is already the amount of pods.
Other queries then become practically impossible, like aggregating all defined resource requests, which today is just:
sum(kube_pod_container_resource_requests_memory_bytes)
If we were to always have the phase dimension, then doing this would give us 7 times the amount we expect, dividing by 7 is a fragile thing, and removing the dimension wouldn't work as that would result in non-unique time-series.
We expose raw data at true detail to allow users to do anything. Some things may be harder to do than others, and if you want this de-normalization, it needs to be your choice and you can do it in recording rules.
That said I do think your case is a common thing people want to do, so documenting those queries is a very good thing! :slightly_smiling_face:
brancz
on 5 Mar 2019
Thanks for the explanation @brancz I did some math on our side aswell and with a x7 in cardinality this metrics will quickly become the highest offenders in the cardinality table.
For small clusters that won't be a problem but for large ones it will complicate things.
Since I find this usecases the bread and butter of pod observability in kubernetes I'll come up with a PR with some examples for useful recording rules :+1:
jesusvazquez
on 5 Mar 2019
That sounds fantastic! Thanks!
brancz
on 6 Mar 2019
Stale issues rot after 30d of inactivity.
Mark the issue as fresh with /remove-lifecycle rotten.
Rotten issues close after an additional 30d of inactivity.
If this issue is safe to close now please do so with /close.
Send feedback to sig-testing, kubernetes/test-infra and/or fejta.
/lifecycle rotten
fejta-bot
on 5 Apr 2019
Rotten issues close after 30d of inactivity.
Reopen the issue with /reopen.
Mark the issue as fresh with /remove-lifecycle rotten.
Send feedback to sig-testing, kubernetes/test-infra and/or fejta.
/close
fejta-bot
on 5 May 2019
@fejta-bot: Closing this issue.
In response to this:
Rotten issues close after 30d of inactivity.
Reopen the issue with/reopen.
Mark the issue as fresh with/remove-lifecycle rotten.Send feedback to sig-testing, kubernetes/test-infra and/or fejta.
/close
Instructions for interacting with me using PR comments are available here. If you have questions or suggestions related to my behavior, please file an issue against the kubernetes/test-infra repository.
 k8s-ci-robot
on 5 May 2019
k8s-ci-robot
on 5 May 2019
Since there was some discussion that an evicted pod is a problem to look into, I would add that completed Jobs exhibit the same issue - you have to know to filter them out when using this metric.
 bboreham
on 23 Sep 2019
bboreham
on 23 Sep 2019
Related issues
 sayarg
·
4Comments
sayarg
·
4Comments
 therc
·
4Comments
therc
·
4Comments
 jackzampolin
·
8Comments
jackzampolin
·
8Comments
 derekwaynecarr
·
4Comments
derekwaynecarr
·
4Comments
 stvnwrgs
·
7Comments
stvnwrgs
·
7Comments
Most helpful comment
Thanks for the explanation @brancz I did some math on our side aswell and with a x7 in cardinality this metrics will quickly become the highest offenders in the cardinality table.
For small clusters that won't be a problem but for large ones it will complicate things.
Since I find this usecases the bread and butter of pod observability in kubernetes I'll come up with a PR with some examples for useful recording rules :+1: