Kube-prometheus: Can I set the time zone to CST or other time zones, because utc is too unfriendly to us. I've tried changing the container's time zone. it's no good.
What did you do?
What did you expect to see?
What did you see instead? Under which circumstances?
Environment
Prometheus Operator version:
insert image tag or Git SHA here
Kubernetes version information:
insert output of
kubectl versionhereKubernetes cluster kind:
insert how you created your cluster: kops, bootkube, tectonic-installer, etc.
Manifests:
insert manifests relevant to the issue
- Prometheus Operator Logs:
insert Prometheus Operator logs relevant to the issue here
 li-sen
All 14 comments
Could you be more precise in which container, which features you expected to be timezone aware?
 brancz
on 20 Aug 2018
brancz
on 20 Aug 2018
I want to set the time zone of Prometheus and Alertmanger to CST, but I tried to change the time zone of these two containers to CST, but I did not change it successfully.
li-sen
on 21 Aug 2018
I want to set the time zone of Prometheus and Alertmanger to CST
@li-sen can you elaborate further why you would like to set the timezone for Prometheus and Alertmanager?
 mxinden
on 22 Aug 2018
mxinden
on 22 Aug 2018
Everyone knows that the accuracy of alarm information is very important, and many users of Prometheus-operator are scattered all over the world. their servers and applications are all based on local timezone time. if the alarm time is utc, it is inconvenient to convert the alarm information into local time. it is very unfriendly and cannot locate the alarm reason timely and accurately. I believe many users also have this demand.
li-sen
on 23 Aug 2018
@li-sen I see your point, thanks for the details.
I am advocating for keeping your server time on UTC. I think timezone adjustments should be handled in user facing interfaces, like the Alertmanager UI, as they know what timezone the particular client is in.
As of today the Alertmanager UI only shows UTC: https://github.com/prometheus/alertmanager/issues/363. If you like the approach of adjusting the timezone in client interfaces, feel free to follow up with an issue on github.com/prometheus/alertmanager. We could e.g. add a toggle to the Alertmanager UI, which switches everything to the particular timezone.
mxinden
on 23 Aug 2018
I don't agree that only utc time zone is supported. it is best to allow users to choose freely. I agree that the default time zone is utc, but there is no other option. I think this is not a good way. It is a compromise way to make the time of alarm information consistent with the local time.
li-sen
on 24 Aug 2018
I have the same question
you may need edit statefulsets for change UTC
kubectl -n monitoring edit statefulsets.apps prometheus-k8s
        - name: host-time
          mountPath: /etc/localtime
          readOnly: true

      - name: host-time
        hostPath:
          path: /etc/localtime
 vsxen
on 28 Aug 2018
vsxen
on 28 Aug 2018
Could @brancz or @mxinden (or anyone) please tell me if there's a way (with kube-prometheus) to change the timezone for the grafana web ui from UTC to something else (e.g. CDT - my own local timezone)?
- I don't see any option in http://docs.grafana.org/installation/configuration/ for specifying the timezone to use (so i assume there's no way to specify the timezone in my k-p
*.jsonnetfile - like how auth.anonymous is configured in examples/minikube.jsonnet). - I Googled and found this comment describing clicking the cog icon, but in order to get that icon to show up I had to remove
"auth.anonymous": {enabled: true},from my k-p*.jsonnetfile - and i ran into more obstacles (see more details below). - just wondering if there's any other (preferably automated) options?
In the Configuration for my entire grafana instance I changed "Timezone" from "UTC" to "Local browser time":

But each dashboard still shows time in UTC (my current local CDT time is 3:45pm - AKA 15:45; but the top right corner of the following screenshot ays "UTC" - and the right-hand side of the graph says "20:45", note that UTC is 5 hours ahead of CDT):

For that particular dashboard, i clicked its cogwheel icon, then on the General tab i tried to change the Timezone to "Local browser time"...:
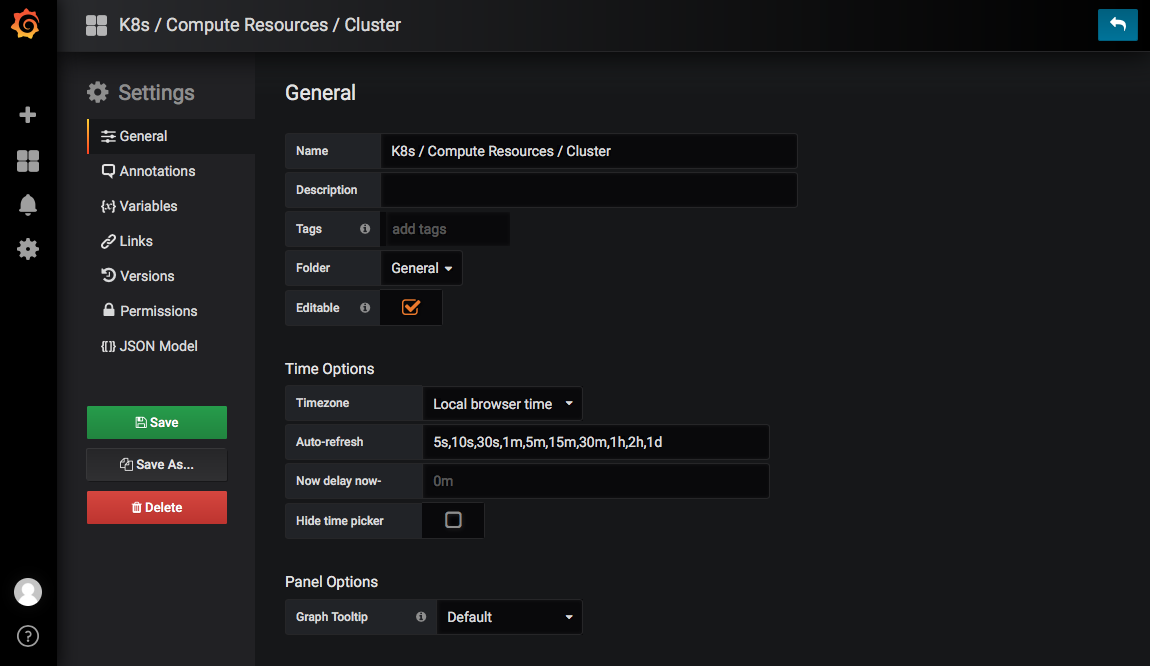
...but when I clicked Save i got the following...:
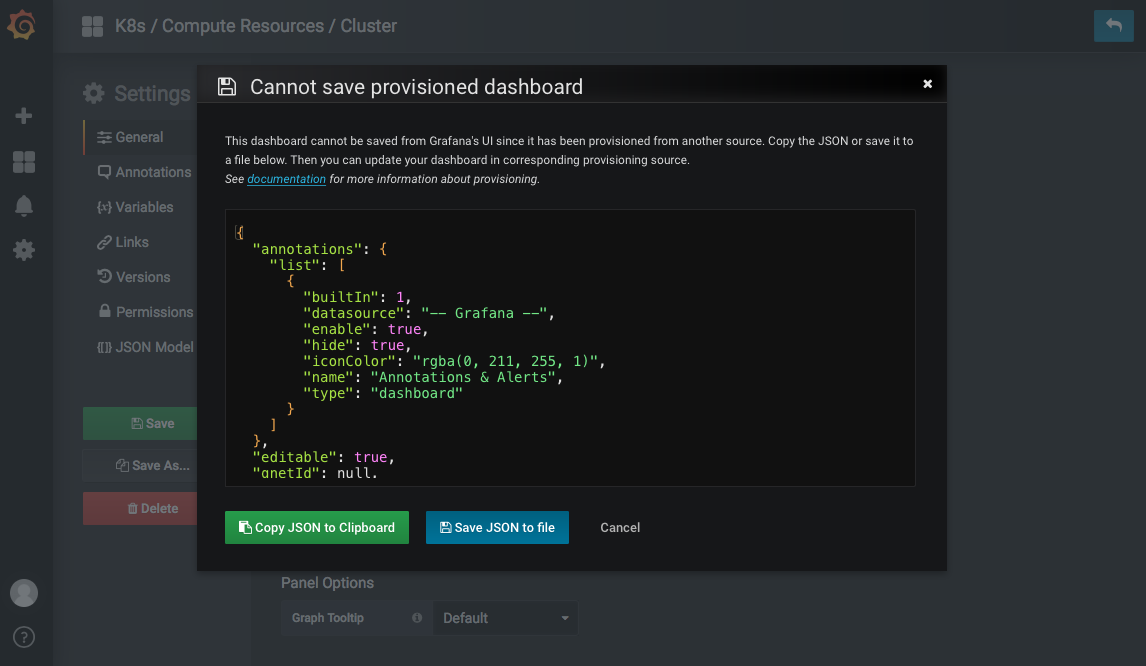
but then the dashboard did display data in local/CDT time:

but then i opened the same dashboard again in a new browser tab, and it was back to UTC.
 jolson490
on 29 Aug 2018
jolson490
on 29 Aug 2018
I just looked into this and found that the dasbboards themselves set the timezone explicitly, but inconsistently (some explicitly define utc and some browser timezone). I would propose to change all dashboards to "default", that would make it use the global setting defined in preferences. This should be discussed in the kubernetes-mixin though as that's where the dashboards are defined.
brancz
on 31 Aug 2018
I have the same question
you may need edit statefulsets for change UTC
kubectl -n monitoring edit statefulsets.apps prometheus-k8s- name: host-time mountPath: /etc/localtime readOnly: true - name: host-time hostPath: path: /etc/localtime
I try to edit statefulsets directly like what you said, but it reported 'error: statefulsets.apps "alertmanager-prometheus-operator-alertmanager" is invalid'. Did you encounter the same issue, how to solved this issue?
 shangjin92
on 25 Nov 2018
shangjin92
on 25 Nov 2018
@brancz Excuse me, is there any way to set volumeMounts for alertmanager container in prometheus operator. I can not find how to configure. Thank you.
shangjin92
on 25 Nov 2018
@shangjin92 please open a new issue as your problem seems to be an entirely different one.
brancz
on 26 Nov 2018
@shangjin92 please open a new issue as your problem seems to be an entirely different one.
Ok, I opened a new issue here.
https://github.com/coreos/prometheus-operator/issues/2164
shangjin92
on 26 Nov 2018
issue is fix?
 Lincoln-dac
on 26 Aug 2019
Lincoln-dac
on 26 Aug 2019
Related issues
 HubbeKing
·
3Comments
HubbeKing
·
3Comments
 rupadhya1
·
3Comments
rupadhya1
·
3Comments
 alam0rt
·
5Comments
alam0rt
·
5Comments
 DimitrijeManic
·
3Comments
DimitrijeManic
·
3Comments
 tewing-riffyn
·
4Comments
tewing-riffyn
·
4Comments
Most helpful comment
I just looked into this and found that the dasbboards themselves set the timezone explicitly, but inconsistently (some explicitly define utc and some browser timezone). I would propose to change all dashboards to "default", that would make it use the global setting defined in preferences. This should be discussed in the kubernetes-mixin though as that's where the dashboards are defined.