Kotlin-dsl-samples: KT-28037 - Memory leak in Kotlin Gradle Plugin when using `in-process` strategy
Today I noticed a Out of memory: Metaspace on our CI: https://builds.gradle.org/viewLog.html?buildId=17204292&buildTypeId=Gradle_Check_Platform_Java10_Oracle_Windows_buildInit
After analyzing the dump https://drive.google.com/open?id=1ejlar1v47BOo7iVXE0bHrxEBANmuCilw it seems like some memory leak in Kotlin. I'm not 100% sure - @eskatos and @bamboo may have more insights on this.
There're several suspicious classloaders which each holds 40000+ classes:
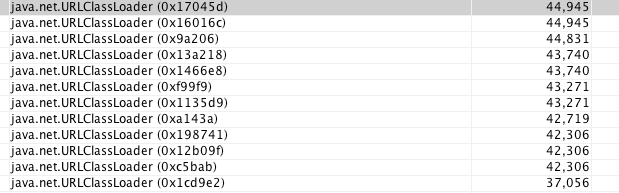
Almost all of them connect to the GC root via some kotlin classes. Plus, these failures happen in kotlin init tests, so I think it might be related to kotlin dsl.

 blindpirate
All 16 comments
My guess is:
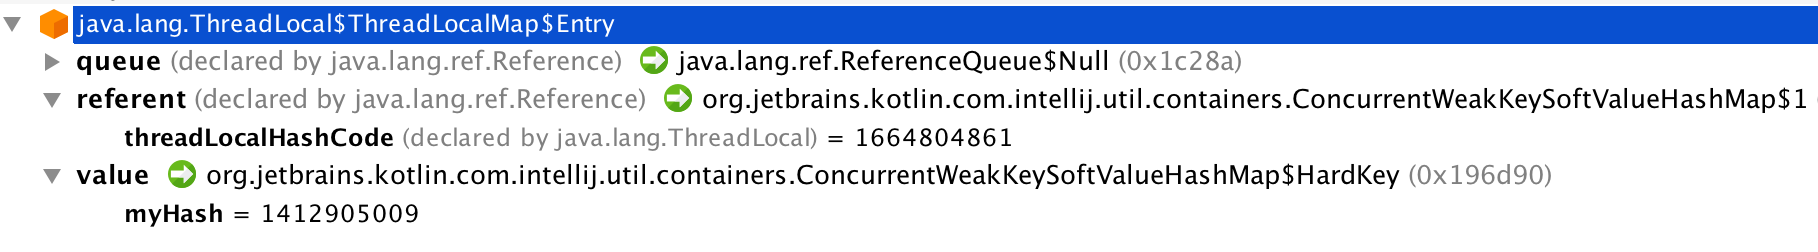
Somehow, we use Daemon worker thread to load ConcurrentWeakKeySoftValueHashMap class, then a a strong reference to ConcurrentWeakKeySoftValueHashMap$HardKey is retained in the worker thread's threadLocals field via this line because first get() operation will set initialValue. As long as the worker thread exists, this path to GC root will exist. I still don't know where ConcurrentWeakKeySoftValueHashMap comes from.
blindpirate
on 1 Nov 2018
blindpirate
on 2 Nov 2018
Heapdump isn't publicly visible just FYI.
 JLLeitschuh
on 2 Nov 2018
JLLeitschuh
on 2 Nov 2018
@JLLeitschuh Thanks, I'm aware of this - seems like I can't share it publicly - I didn't find the option. I'd like to share with anyone if you apply for permission.
blindpirate
on 2 Nov 2018
Using ThreadLocal without calling remove when you are done is a bug. You either need a lifecycle where you call remove at some point (e.g. when compilation is finished) or you can't use a ThreadLocal. There are several more instances of this problem in the Kotlin plugin/compiler. This will become a bigger issue in Gradle 5.0, since we now limit metaspace by default.
We may want to consider this a blocker for 5.0 if this affects the Kotlin DSL
 oehme
on 5 Nov 2018
oehme
on 5 Nov 2018
A quick option that doesn't require a new Kotlin release: Reflectively remove all the threadlocals when the build session ends.
oehme
on 6 Nov 2018
Two questions:
- Isn't the Kotlin Compiler run in it's own daemon and, as such, inaccessible with reflection?
- Is there a YouTrack issue where this problem has been reported?
JLLeitschuh
on 6 Nov 2018
@JLLeitschuh, a daemon is reused running several build sessions, each build session end can be handled by the daemon. No youtrack issue yet afaik but Kotlin folks are aware of this one.
@oehme, it affects the Gradle Kotlin DSL when using the kotlin-dsl plugin, e.g. in buildSrc. It also affects all builds using the kotlin-gradle-plugin.
 eskatos
on 6 Nov 2018
eskatos
on 6 Nov 2018
The leak is in the main Gradle daemon though, not in the compiler worker. So there must be some Kotlin code called in the main daemon.
oehme
on 6 Nov 2018
Issue in the Kotlin issue tracker: https://youtrack.jetbrains.com/issue/KT-28037
 h0tk3y
on 6 Nov 2018
h0tk3y
on 6 Nov 2018
@eskatos A few of these classloaders are suspicious: "ClassLoaderScopeIdentifier.Id{root:C:\tcagent1\work\668602365d1521fc\subprojects\build-init\build\tmp\test files\unknown-test-class\q4upj\some-thing\buildSrc:root-project(export)}".
Why is the main daemon creating a classloader scope for something that is clearly the output of a test?
Edit: Nevermind, the heap dump is not from the main daemon - It's from a test VM, running the embedded Gradle executer. That also explains the many classloaders with the same Kotlin version - It's many different projects being built by the same process.
oehme
on 6 Nov 2018
FWIW and AFAIK the failure happened on Windows only on our CI:
eskatos
on 7 Nov 2018
Note that the above are only the failures in the buildInit project. I've seen others, including our main daemon failing.
oehme
on 7 Nov 2018
Another instance
https://builds.gradle.org/viewLog.html?buildId=17396138&buildTypeId=Gradle_Check_Platform_Java10_Oracle_Windows_buildInit
That's :buildInit integration tests again. I just noticed that some tests in there set -Dkotlin.compiler.execution.strategy=in-process which will create a leak in the Gradle daemon from the kotlin-gradle-plugin usage of the kotlin compiler. Because those daemons run several different builds, the kotlin compiler classes are loaded from many different classloaders.
@oehme there're also tests in :modelCore that set that problematic property, is it there you also observed the leak?
eskatos
on 8 Nov 2018
No more failures due to metaspace exhaustion can be observed since I removed the in-process strategy
eskatos
on 12 Nov 2018
Fixed in 1.3.20
https://youtrack.jetbrains.com/issue/KT-28037
eskatos
on 25 Apr 2019
Related issues
 wuchengithub
·
4Comments
wuchengithub
·
4Comments
 iNikem
·
3Comments
iNikem
·
3Comments
 xmlking
·
3Comments
eskatos
·
3Comments
xmlking
·
3Comments
eskatos
·
3Comments
 AlexCzar
·
3Comments
AlexCzar
·
3Comments
Most helpful comment
Using ThreadLocal without calling
removewhen you are done is a bug. You either need a lifecycle where you callremoveat some point (e.g. when compilation is finished) or you can't use a ThreadLocal. There are several more instances of this problem in the Kotlin plugin/compiler. This will become a bigger issue in Gradle 5.0, since we now limit metaspace by default.We may want to consider this a blocker for 5.0 if this affects the Kotlin DSL