Kong: Memory leak or overly-agressive consumption
Summary
We are seeing Kong consume memory at about 1G/week and fail to release. We limit our instances over the
Steps To Reproduce
- Run Kong (in our case, in docker)
- Watch memory usage graphs
Here's what ours looks like
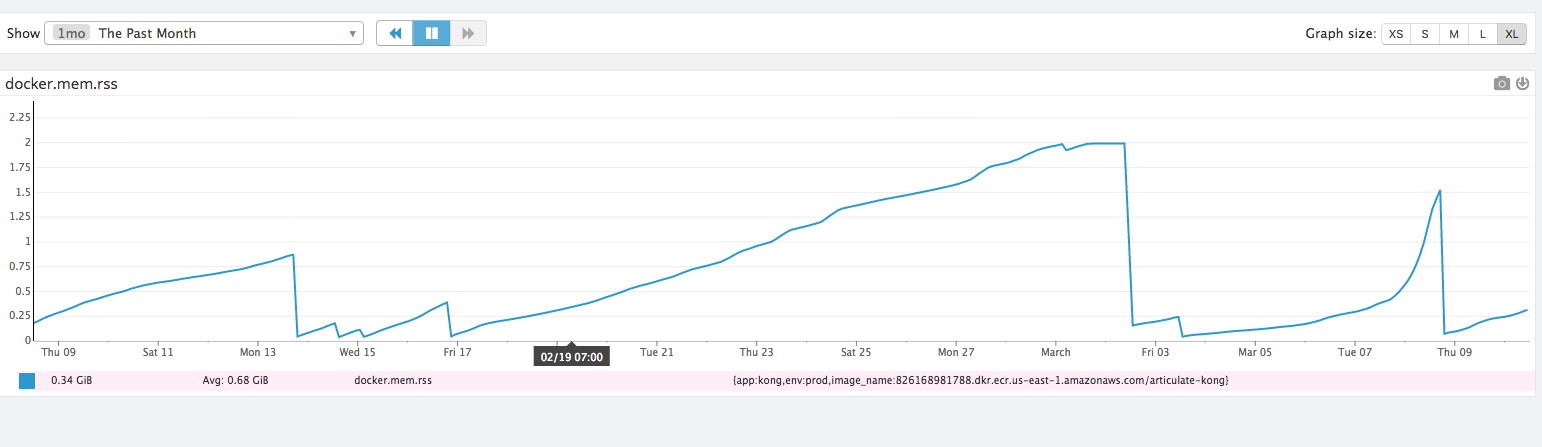
The exponential spike seen in the farthest right was due to a flood of requests during a DoS-like event. So the rate of climb appears to be related to traffic, meaning memory consumption is connected to something within the request cycle.
Additional Details & Logs
- Kong versions:
0.9.4&0.9.9 - Kong debug-level startup logs
- Kong configuration:
- JWT
- Datadog
- Logstash
- CORS
- ACL
- Basic Auth
- Docker
FROM kong:0.9.9
 plukevdh
All 52 comments
Also note, where the graphs drop are related specifically to deploys or instance reboots. So far it's the only way we've found to reset the memory consumption.
plukevdh
on 10 Mar 2017
Do you see any logs at /usr/local/kong/logs/error.log ?
 subnetmarco
on 10 Mar 2017
subnetmarco
on 10 Mar 2017
This could very well be the lack of LRU cache mechanism in the Lua-land caching implemented in database_cache.lua. A high priority for us at this time.
 thibaultcha
on 10 Mar 2017
thibaultcha
on 10 Mar 2017
@thefosk I will check the error logs, but we've been running without error for quite some time. We only just noticed this memory issue.
plukevdh
on 13 Mar 2017
@thefosk the only lines in the error log are:
2017/03/13 14:03:03 [notice] 97#0: signal 17 (SIGCHLD) received
@plukevdh as part of the 0.10.1 release, we included an LRU mechanism in per-worker memory caches to eliminate this sort of unbounded growth. Can you have a try of the latest release and let us know if you still see the same behavior?
 p0pr0ck5
on 17 Apr 2017
p0pr0ck5
on 17 Apr 2017
We'll give it a go as soon as we can. I know the 0.9 -> 0.10 caused some other bumps so we've held off upgrading just now.
plukevdh
on 18 Apr 2017
@plukevdh can you share some more details about your config when you experience this problem? How many data store entities (APIs, consumers, plugins, etc) are you using? What is the value of the mem_cache_size directive in your config? Any other details you can share about your environment?
p0pr0ck5
on 29 Apr 2017
@plukevdh any update on the questions above, or any chance on moving to 0.10.1?
p0pr0ck5
on 18 May 2017
We've tried a couple of times and still had some fairly significant backwards compat breakages or bugs in those releases that have slowed our progress on this.
As an aside, breaking changes are _supposed_ to be in major point releases when using semver, but I realize sometimes the rules don't apply to pre 1.0 releases (although imo, they should).
plukevdh
on 18 May 2017
Sorry to butt in @plukevdh but ...
We can upgrade to 1.10, however we're blocked by #2512
Everything else works, so backwards compat isn't an issue.
 tecnobrat
on 18 May 2017
tecnobrat
on 18 May 2017
@tecnobrat @plukevdh just a note that #2519 contains a fix for #2512, and will likely make its way into 0.10.4.
p0pr0ck5
on 8 Jun 2017
^ BTW this change was merged in and will be in the 0.10.4 release, which will likely be out in a few weeks. Would love your feedback on this if you can!
p0pr0ck5
on 12 Jun 2017
We're experiencing the same issue running 0.10.3.
In one of our 3 nodes cluster, one node is now stuck at 95% RAM (3.34 of 3.67 GB) usage receiving exactly the same amount of traffic than the other 2 nodes. We're monitoring it and no GC seems to be triggered at any time that will evict the RAM load.
Has someone solved this by upgrading to 0.10.4?
BTW, let me know if you want me to provide profiling data.
Cheers
 pachico
on 4 Oct 2017
pachico
on 4 Oct 2017
Facing the Same Issue. (Very High Memory Utilization)
Running Kong in Docker (using https://github.com/Mashape/docker-kong/tree/master/compose)
Host : Ubuntu & docker-ce
 rajasoun
on 8 Oct 2017
rajasoun
on 8 Oct 2017
@pachico @rajasoun I would strongly recommend updating to 0.11.x because there were lots of changes that may have positively affected this issue.
subnetmarco
on 9 Oct 2017
@thefosk, thanks for your reply. We're in the process of upgrading now.
I will reply here if it solved the issue.
pachico
on 10 Oct 2017
We have upgrade to 0.11 three days ago and we are still experiencing the same problem.
We are actually expecting some of our instances running Kong (and only Kong) to crash due to memory exhaustion.
Is there some way you can call the GC?
If we didn't have an auto-scaling solution we would already be looking for alternatives.
Help would be highly appreciated.
pachico
on 20 Oct 2017
I tried and was unable to reproduce this using https://github.com/Kong/docker-kong/tree/master/compose, the plugins mentioned on Ubuntu 16.04.2
I only configured a single API and hammered the Kong cluster with https://github.com/wg/wrk but never had the memory problems indicated.
 hutchic
on 20 Oct 2017
hutchic
on 20 Oct 2017
It takes some days for the instance to crash for memory exhaustion.
This is the typical life cycle of an instance and, as you can imagine, we're quite worried about it.

pachico
on 23 Oct 2017
@pachico can you share your configuration? what plugins do you use?
 Tieske
on 23 Oct 2017
Tieske
on 23 Oct 2017
@pachico any updates on this?
Tieske
on 30 Oct 2017
If you are encountering this issue, please do share:
- Your Kong version (
kong version -a) - OpenResty version and compilation flags (
nginx -V) - Your Kong configuration: underlying datastore, plugins in use, rough estimate of the number of Consumers, and type of APIs matching in use (URI, regex URI, host, wildcard host, etc.).
While we are very eager to get this to a resolution, we need to narrow down the scope of search because such a leak could be hidden anywhere: in Kong core, in a plugin, in a dependency (C or Lua), in OpenResty itself, in a third-party NGINX module.
At least getting such information for each one of you who observed this leak would help us make correlations if we see a common piece of functionality you are all using. This is very important to help us resolve this issue.
Additionally, if you are familiar enough with NGINX/OpenResty, I suggest using tools such as Valgrind, the OpenResty SystemTap scripts (https://github.com/openresty/stapxx#lj-gc), or gdb utils (https://github.com/openresty/openresty-gdb-utils#lgc) to help us narrow this down between the Lua VM or the C land of NGINX and lua-nginx-module.
Your report is greatly appreciated, and so is your help!
Thanks
thibaultcha
on 14 Nov 2017
Hello @Tieske. I'm glad to tell you that it seems the problem was not caused by Kong's core but by one of our custom plugins.
We have finally solved it and the RAM consumption is back to a stable and low level.
Sorry for the inconveniences.
pachico
on 15 Nov 2017
@pachico Thank you for letting us know.
We'll keep this thread open for now, hoping to get answers from @rajasoun, @plukevdh and/or @tecnobrat as well, or for anybody else who might be encountering this. Please do follow the steps/provide the details I asked for in my above message if you think you are still encountering a memory leak. Thanks!
thibaultcha
on 15 Nov 2017
@pachico would you mind providing some details on what exactly went wrong with your custom plugin? (for future reference here)
Tieske
on 16 Nov 2017
@Tieske We are running a stack which uses XML as external document model (mostly dictated by the industry standard) but we wanted to use Kong as API gateways. This forced us to develop most of the plugins in order to return proper XML response formats.
One of these plugins validates input XML against XSD using Xerces-C++ lua wrapper. It turns out we ended up having a memory leak for every document validated.
Anyway, now we're quite happy with it, despite to change the format of the response required us to completely duplicate the built-in plugins since there was no view "template" we could modify.
pachico
on 16 Nov 2017
@pachico did you just "hack them to xml" or did you implement a template? in the latter case, I'd love to see a PR! 😄
Tieske
on 21 Nov 2017
@Tieske we "hack them to xml", and yes, this means we had to re do some of the work every time these built-in plugins changed over versions :)
pachico
on 21 Nov 2017
Hey all,
I'm a colleague of plukevdh who originally opened this issue.
We've finally been able to upgrade to kong 0.11.2, we had issues with 0.10.0 with it breaking URL encoding so we had to wait for 0.11.
We are still seeing the memory leak on 0.11.
We run kong 0.11.2 based on the released docker image. We run this in docker in production.
We are using the following plugins:
aclbasic-authcorsdatadogjwttcp-logresponse-transformer
We have about 60 APIs configured. We peak at about 8 requests per second, and the memory consumption does appear to be based somewhat on traffic volume. On our staging servers the consumption increases very slowly (very little traffic) where is on our production system, it increases roughly at an exact factor increase based on the traffic increase. (2x traffic = 2x memory consumption)
Regards
tecnobrat
on 21 Dec 2017
@tecnobrat if you disable the response-transformer plugin, what behavior do you see?
subnetmarco
on 21 Dec 2017
@thefosk I'll see what I can do, that's easier said than done because we use it to set a header on every response and I'll need to make sure that doesn't break a bunch of things to test it properly.
Is there any particular reason why you make that suggestion?
tecnobrat
on 21 Dec 2017
@tecnobrat if you are changing the response body Kong will have to parse the content in-memory (https://github.com/Kong/kong/blob/master/kong/plugins/response-transformer/handler.lua#L40-L42), but that should only happen when changing the body of the response (not when adding only headers)
subnetmarco
on 21 Dec 2017
@thefosk yea, this is what we have it configured as:
{"created_at":1494441618000,"config":{"replace":{"json":{},"headers":{}},"add":{"json":{},"headers":["X-Content-Type-Options:nosniff"]},"remove":{"json":{},"headers":{}},"append":{"json":{},"headers":{}}},"id":"eaf18c1a-5759-48b8-8969-d3ef44940e33","enabled":true,"api_id":"a96a49fa-b230-409a-a899-de5f212eb9b3","name":"response-transformer"}
tecnobrat
on 21 Dec 2017
Another test would be to disable the tcp-log plugin first, and the datadog plugin later if the problem still continues. The logging plugins are taking up memory for every request and they could also be the cause, we should try by trial and error.
subnetmarco
on 21 Dec 2017
We're also experiencing this issue. Our symptoms are quite similar to those that @tecnobrat described: the rate of memory consumption appears to be tied to request rate.
Kong 0.10.2 from the Kong-provided .deb packages.
APIs: ~60
Peak requests: 150/s
API matching: URI (non-regexp)
Plugins:
- cors
- jwt
- rate-limiting (
localpolicy) - request-transformer
- syslog
We're using modified copies of the jwt and request-transformer plugins. The modifications are quire simple, but that complicates things a bit. The jwt plugin is configured to add claims as HTTP headers, and the request-transformer plugin to run at a different priority. We're only using request-transformer to modify headers.
I'm hoping to be able to work through some of @thibaultcha's debugging recommendations early in the new year.
 cosmopetrich
on 21 Dec 2017
cosmopetrich
on 21 Dec 2017
Disabling syslog is a good idea too. I'll try that after Christmas.
cosmopetrich
on 21 Dec 2017
The logging plugins don't implement batching (which is a feature in our roadmap) - if turns out the problem is caused by them we might be able to give it a higher priority. Currently they send a logging request for every incoming Kong request and that may be affecting the memory consumption, but we should try.
subnetmarco
on 21 Dec 2017
Looking at both lists of plugins, the cors one is in both. And both have logging plugins (those share the serializer code), so those would be most suspect imo.
@tecnobrat since you seem to have it reproduced in a non-prod environment, could you experiment to see whether any of those could be the culprit?
Tieske
on 28 Dec 2017
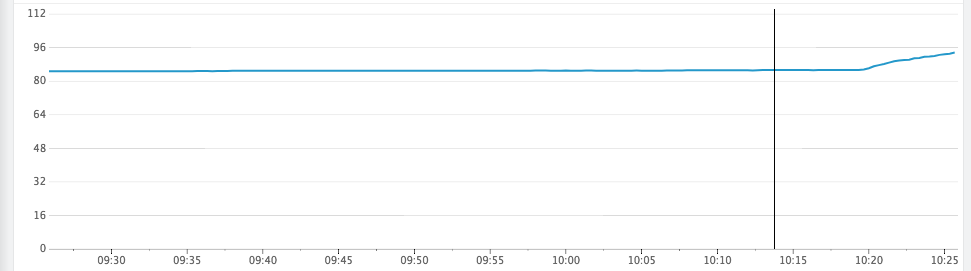
Sorry for the verbosity of this, but I wanted to explain how I tested and confirmed everything.
TLDR: its the jwt plugin.
I've testing hitting some API endpoints with lots of traffic on our staging server (about 50 concurrent connections) to see if I can reproduce the memory leak with just lots of traffic:
Tested on a simple health endpoint which had these plugins enabled:
datadogtcp-logresponse-transformer
There was no visible "leak". While memory did increase a very small amount when I started the test (0.25MB), it didn't continue to ramp up as I ran the test.
Then I tested on another heavier endpoint (bigger response objects) which has these plugins enabled:
datadogtcp-logresponse-transformercors
Again no visible leak on our graphs, no increase at all.
So I tried an endpoint which contains:
datadogtcp-logresponse-transformercorsbasic-authacl
Nothing leaking.
Then testing with a JWT plugin enabled API:
datadogtcp-logresponse-transformercorsjwtacl
And boom, memory leak.
Our JWT plugin is configured with the following (we load our kong config with a tool which takes yaml, but I'm sure you can figure it out):
    config:
      key_claim_name: aud
      secret_is_base64: false
      claims_to_verify: exp
      uri_param_names: jwt
      anonymous: ''
With this ACL/credential:
- username: 'articulate-id'
  acls:
  - group: 'articulate-id'
  credentials:
  - name: 'jwt'
    attributes:
      key: 'KEY'
      rsa_public_key: "PUBLIC_KEY"
      algorithm: 'RS256'
If I can provide any more info, please let me know.
tecnobrat
on 2 Jan 2018
I wonder if this is related:
https://github.com/mkottman/luacrypto/pull/43/files
and
https://github.com/mkottman/luacrypto/issues/45
While kong doesn't use to_pem .. it does use from_pem, which I believe would suffer from the same memory leak.
tecnobrat
on 2 Jan 2018
@tecnobrat would you be able to try your setup with the 0.12.0rc1 release? The next release is slated to replace luacrypto with luaossl: https://github.com/Kong/kong/commit/5f9ccbc81209e7f20a9f977ea0893436a67ee07c
p0pr0ck5
on 2 Jan 2018
Great investigation @tecnobrat, thanks a lot!
As @p0pr0ck5 said, it would seem like 0.12.0rc1 would take care of this, if the leak is found to be caused by luacrypto.
thibaultcha
on 2 Jan 2018
Can you get a 0.12.0rc1 docker release up on dockerhub?
tecnobrat
on 2 Jan 2018
@tecnobrat it's on my to-do list for this afternoon :) (if you like, you can also build a local image via the pending release Dockerfile: https://github.com/Kong/docker-kong/tree/chore/bump-0.12.0rc1)
p0pr0ck5
on 2 Jan 2018
FYI, Kong CE 0.12.0 has been released yesterday (and replaces luacrypto with luaossl) and is available in deb, rpm packages as well as on Docker Hub.
thibaultcha
on 17 Jan 2018
Hello @plukevdh / @tecnobrat , did you have time to try 0.12 and see if it solved your memory issue?
 kikito
on 20 Feb 2018
kikito
on 20 Feb 2018
We're currently in the process of updating to 0.12. I should be able to let you know if we've seen any improvement by early next week.
cosmopetrich
on 22 Feb 2018
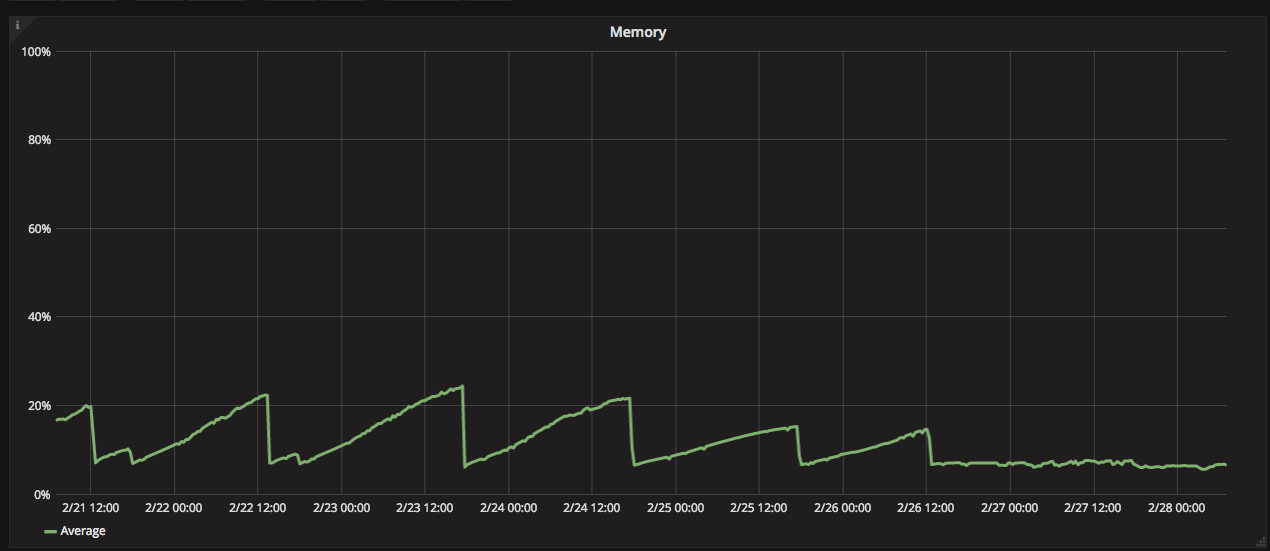
We cut the cluster shown on this chart over to 0.12 just after 12:00 on 2018-02-26. The new release definitely looks to have resolved the problem for us. Big thanks to everyone involved. If you're ever in Sydney I'll buy you a drink.
cosmopetrich
on 27 Feb 2018
@daurnimator ^^^ free :beers: !
Tieske
on 27 Feb 2018
👏 👏 👏
p0pr0ck5
on 27 Feb 2018
Closing this now, thanks everybody for the feedback.
thibaultcha
on 11 Apr 2018
Related issues
 lavoiedn
·
3Comments
lavoiedn
·
3Comments
 hos7ein
·
3Comments
hos7ein
·
3Comments
 xiaochai
·
3Comments
xiaochai
·
3Comments
 Voronenko
·
3Comments
Tieske
·
4Comments
Voronenko
·
3Comments
Tieske
·
4Comments
Most helpful comment
We cut the cluster shown on this chart over to 0.12 just after 12:00 on 2018-02-26. The new release definitely looks to have resolved the problem for us. Big thanks to everyone involved. If you're ever in Sydney I'll buy you a drink.