Hi
I am using the Docker method and it seems like it is using about 4gb atm
komga 0.34% 3.514GiB / 11.78GiB 29.83%
Is there a way to lower this mem usage beside removing libraries? I was even planning to add more books but as of now I probbaly should not since my system is almost full mem wise after most is used up by Komga.
thanks
 gerroon
All 12 comments
Hello,
Java memory within Docker container is not necessarily properly reported, nor a good measure of the actual memory used. This is because the JVM heap memory isn't always going through GC if the system doesn't need the memory elsewhere. Also, at startup, without specified constraint, the JVM will always allocate 1/4 of the total memory of the system.
The memory shouldn't grow linearly with the number of books. Actually the memory footprint grows when opening files (so during scan and when serving pages), but those files are closed afterwards. The memory footprint though doesn't necessarily go down afterwards, but that doesn't mean the JVM wouldn't release it if it's needed by your system.
That being said, you can limit the JVM memory in a few ways:
- when using Docker, you can add an environment variable:
JAVA_TOOL_OPTIONS=-Xmx2g. That will limit the JVM heap size to 2gb. - when using Docker, since the base image is using JDK 11, you can use the Docker native resource limitations, which will be honored by the JVM.
- when using the
jarfile directly, you can use a command line argument:-Xmx2g.
You can try limiting the heap size as mentioned above, and check your logs for any OutOfMemoryException that would occur.
To give you some insight, i am running Komga inside Docker with ~6000 books, and the memory footprint is around 1-2gb. I successfully ran this setup using the above mentioned 2g limit.
How many books do you have at the moment?
 gotson
on 17 Nov 2019
gotson
on 17 Nov 2019
Thanks for the reply. I will take a look at how I can limit memory in docker based on your input.
What I see happening is that the memory usage is slowly creeping up. For instance I restarted Docker image and it started around 700mb now it is up to 1.1 gb and 1.2gb etc I think that is how it went up to 3.5gb in one day. That is concerning to me because it did not look like it was releasing the memory at all. Sure Docker might not be reporting properly but top was showing that kind of usage too and if the memory usage goes as at this trajectory it might max out my system.
All I did was to read couple books and I am the only user so the mem going up does not seem to have a clear reason.
I do not knoiw the exact number since I cant see the number of books in the ui, I added 4 different libs probbaly not less than couple thousand books.
gerroon
on 17 Nov 2019
I'm not sure top would report properly JVM memory usage, but I'm not expert enough.
I'm running 2 Komga instances, along with 20 other containers on my server (16gb ram total) and haven't had any problems so far.
gotson
on 17 Nov 2019
for java inside docker I think those jvm flags can be useful :
-XX:+UseContainerSupport -XX:MaxRAMPercentage=70.0 -XX:InitialRAMPercentage=40.0 -XX:MinRAMPercentage=40.0
I'm no expert though
 bayang
on 18 Nov 2019
bayang
on 18 Nov 2019
It shouldn't be needed since the docker image is using jdk11, which is docker aware.
gotson
on 19 Nov 2019
I'm also curious if there are more precautions that can be taken to limit memory utilization. My system has over 100gb of ram so it's not critical, but expecting a 20gb ram spike while analyzing is pretty intense. In the screenshot below you can see what happened when I launched Komga.
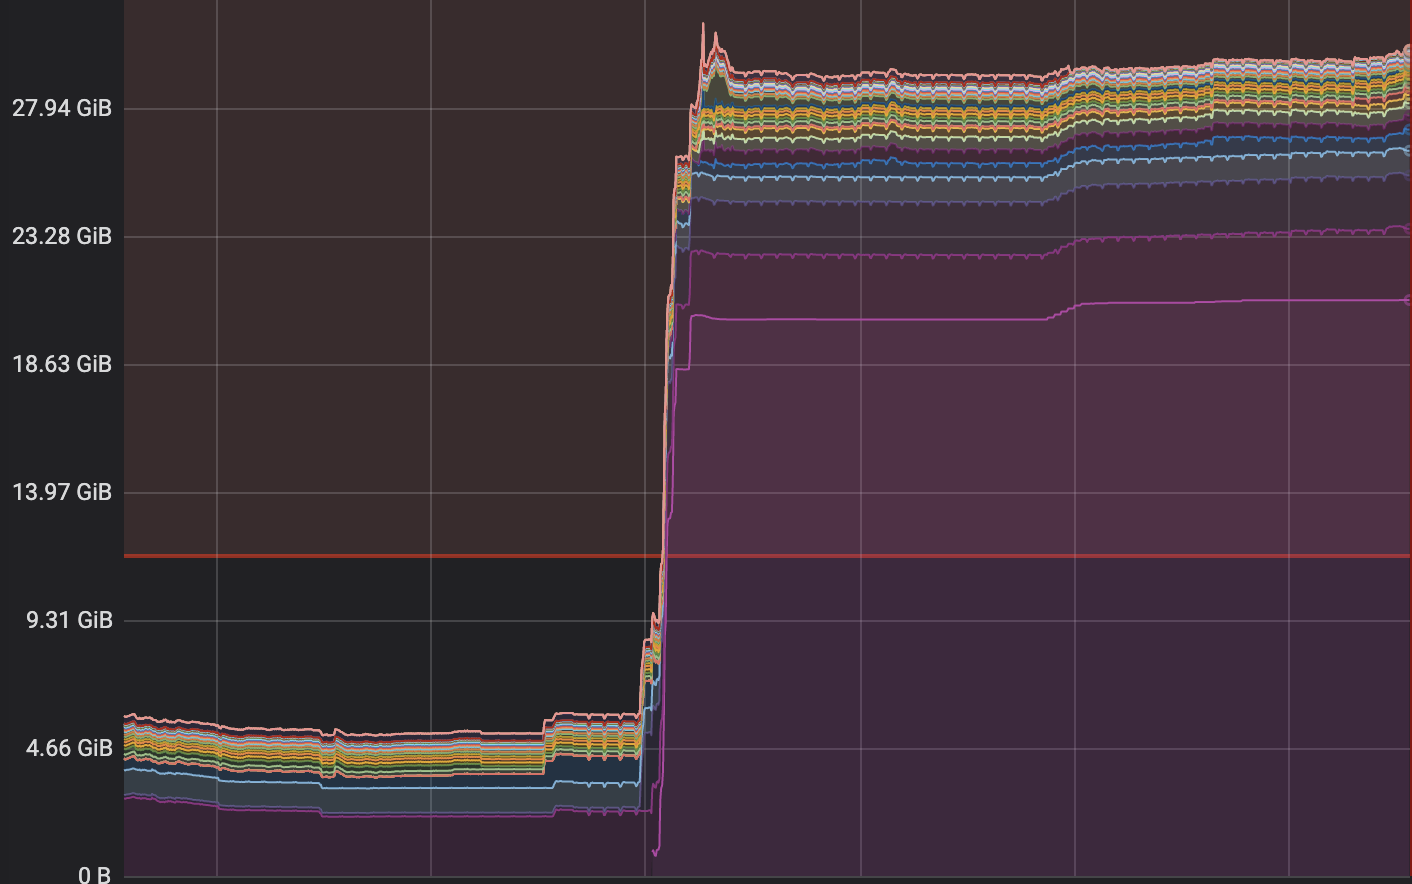
I'm running via docker in unraid.
 ddwag1
on 28 Apr 2020
ddwag1
on 28 Apr 2020
I'm also curious if there are more precautions that can be taken to limit memory utilization. My system has over 100gb of ram so it's not critical, but expecting a 20gb ram spike while analyzing is pretty intense. In the screenshot below you can see what happened when I launched Komga.
I'm running via docker in unraid.
The JVM will by default allocate 1/4 of your ram as the max memory. Which metric are you looking at exactly ?
gotson
on 28 Apr 2020
In the screenshot? That is gb of ram per docker container I have running. The bottom one being komga. (The red line is just an alert I have setup, ignore that)
ddwag1
on 28 Apr 2020
In the screenshot? That is gb of ram per docker container I have running. The bottom one being komga. (The red line is jut an alert I have setup, ignore that)
Those are mostly irrelevant, a JVM on Docker will show its max memory, but it does not reflect the actual memory used.
You can limit the max memory used if you want.
gotson
on 28 Apr 2020
Understood. The env variable did work for me. I've just never encountered a docker container on unraid reserve 1/4 of my ram by default before.
Those metrics may be irrelevant to display an exact current utilization but for most people I believe it's a pretty solid metric to see what's going on with their system. I would suggest adding the JAVA_TOOL_OPTIONS as a default optional variable in the unraid template as I feel this may be a common question users will bring up.
ddwag1
on 28 Apr 2020
I don't have anything to do with Unraid, but feel free to check with the community on their repo!
gotson
on 28 Apr 2020
Closing this, most of the questions have been answered. Since then there have been some major changes that reduced the ram used.
gotson
on 10 Jun 2020
Related issues
 Arno500
·
6Comments
Arno500
·
6Comments
 muchtea
·
6Comments
gotson
·
5Comments
muchtea
·
7Comments
gotson
·
7Comments
muchtea
·
6Comments
gotson
·
5Comments
muchtea
·
7Comments
gotson
·
7Comments
Most helpful comment
Hello,
Java memory within Docker container is not necessarily properly reported, nor a good measure of the actual memory used. This is because the JVM heap memory isn't always going through GC if the system doesn't need the memory elsewhere. Also, at startup, without specified constraint, the JVM will always allocate 1/4 of the total memory of the system.
The memory shouldn't grow linearly with the number of books. Actually the memory footprint grows when opening files (so during scan and when serving pages), but those files are closed afterwards. The memory footprint though doesn't necessarily go down afterwards, but that doesn't mean the JVM wouldn't release it if it's needed by your system.
That being said, you can limit the JVM memory in a few ways:
JAVA_TOOL_OPTIONS=-Xmx2g. That will limit the JVM heap size to 2gb.jarfile directly, you can use a command line argument:-Xmx2g.You can try limiting the heap size as mentioned above, and check your logs for any
OutOfMemoryExceptionthat would occur.To give you some insight, i am running Komga inside Docker with ~6000 books, and the memory footprint is around 1-2gb. I successfully ran this setup using the above mentioned
2glimit.How many books do you have at the moment?