I can easily use plotly's interactive charts by below 2 lines of code:
import pandas as pd
pd.options.plotting.backend = "plotly"
However, unable to use Plotly with Koalas Dataframes. Is there a workaround or can there be an enhancement to include this feature?
 jainayush007
All 20 comments
I don't think there is an easy workaround at this moment.
 HyukjinKwon
on 3 Jul 2020
HyukjinKwon
on 3 Jul 2020
So, what is an alternative, of a visualization library which works both on pandas and koalas without needing much of code change? Visualization is an important component during EDA and Data Analysis and right now I feel this is a limitation for being able to move pandas codes to koalas.
jainayush007
on 3 Jul 2020
Currently the only alternative is to use matplotlib for now. I am happy to review and merge if somebody works on it in Koalas.
HyukjinKwon
on 3 Jul 2020
I am running this on a colab environment. Unfortunately getting an interactive plot from matplotlib on colab is not supported. So, I need to get back to pandas to be able to create interactive plots.
jainayush007
on 3 Jul 2020
I'd like to work on implementing the matplotlib features for plotly, if this is a required feature.
 DumbMachine
on 7 Jul 2020
DumbMachine
on 7 Jul 2020
Thanks Ratin. Interactive visualization is the way to go in my opinion and
matplotlib has lot of limitations when it comes to that.
On Wed 8 Jul, 2020, 12:26 AM Ratin Kumar, notifications@github.com wrote:
I'd like to work on implementing the matplotlib features for plotly, if
this is a required feature.—
You are receiving this because you authored the thread.
Reply to this email directly, view it on GitHub
https://github.com/databricks/koalas/issues/1626#issuecomment-655057833,
or unsubscribe
https://github.com/notifications/unsubscribe-auth/AHQROEMQDLPCUUBU5B4ES6TR2NVWVANCNFSM4OPLA75Q
.
jainayush007
on 7 Jul 2020
@DumbMachine Please feel free to go ahead and submit a PR. Thanks for working on this!
 ueshin
on 7 Jul 2020
ueshin
on 7 Jul 2020
Plotly backend for pandas currently supports:
linescatterareabarboxhistogram
So I will start by implementing these.
DumbMachine
on 8 Jul 2020
Small update, Made some changes to get plotly up and working. Below is a small example. If this does it, then I will open the PR.
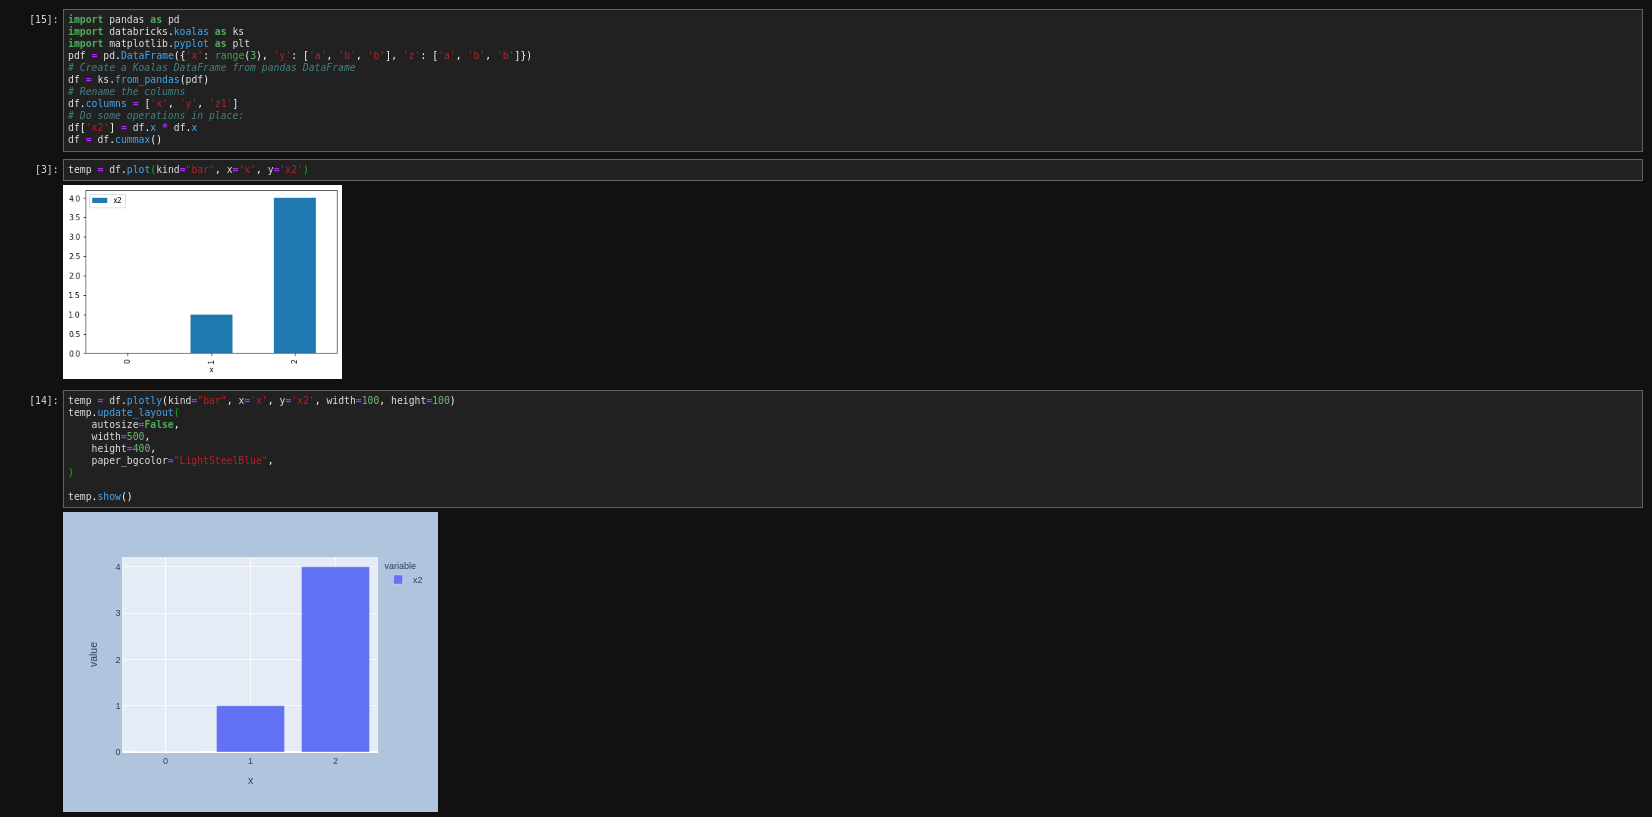
(sorry about the image size)
DumbMachine
on 8 Jul 2020
Great start! Pandas has a feature to enable a visualization library by
selection -
import pandas as pd
pd.options.plotting.backend = "plotly"
Would we be able to setup something similar for Koalas? This would also,
enable a pandas-like approach to visualization. I would think this would
keep the syntax closer and similar to pandas style of enabling and using
plotly.
On Wed, Jul 8, 2020 at 5:32 PM Ratin Kumar notifications@github.com wrote:
Small update, Made some changes to get plotly up and working. Below is a
small example. If this does it, then I will open the PR.
[image: image]
https://user-images.githubusercontent.com/23381512/86916108-b52e4e80-c140-11ea-828a-15206814d6a0.png
(sorry about the image size)—
You are receiving this because you authored the thread.
Reply to this email directly, view it on GitHub
https://github.com/databricks/koalas/issues/1626#issuecomment-655475589,
or unsubscribe
https://github.com/notifications/unsubscribe-auth/AHQROEKOQWVBFF5X4SWUQFLR2RN6BANCNFSM4OPLA75Q
.
jainayush007
on 8 Jul 2020
Koalas support such options - https://koalas.readthedocs.io/en/latest/user_guide/options.html. We could implement this in a similar way.
HyukjinKwon
on 8 Jul 2020
Awesome work!
Yeah, shall we have a conf ks.options.plotting.backend = "plotly" and switch the behavior to follow the pandas' usage?
FYI: the file for options is https://github.com/databricks/koalas/blob/master/databricks/koalas/config.py
ueshin
on 8 Jul 2020
Have opened a PR. The plotting works as expected. I have tested the
ks.options.plotting.backend = "plotly"ks.options.plotting.backend = "pandas_bokeh"
options. Using the options strategy allows for compatibility with other libraries as well like pandas_altair.
DumbMachine
on 8 Jul 2020
Hi,
I am on Koalas 1.0.1. But unable to use the feature -
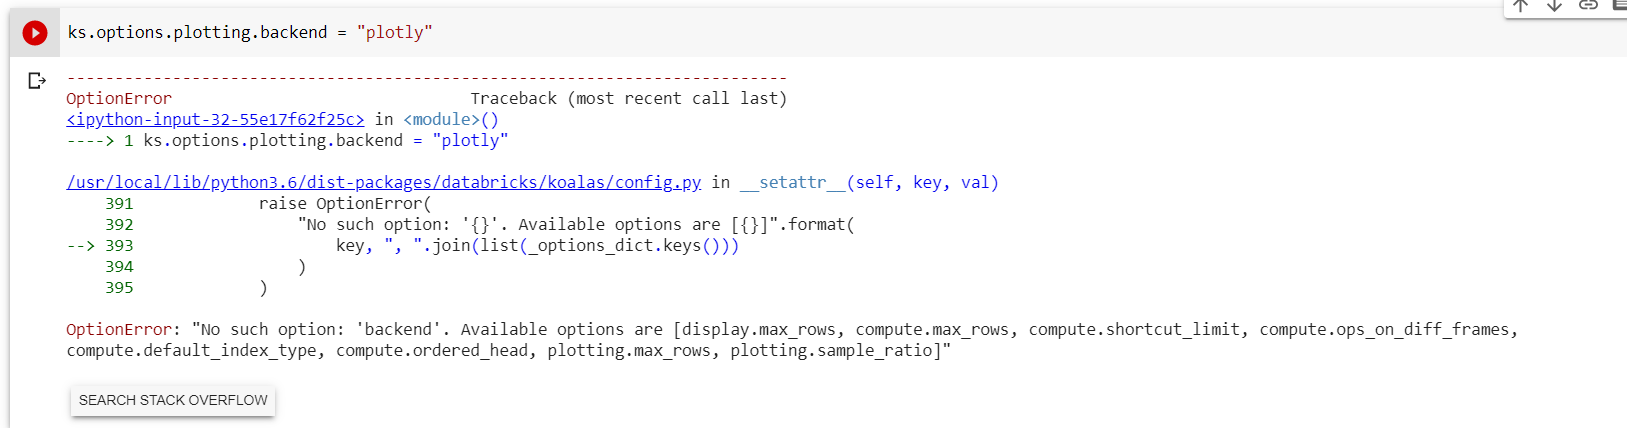
Thanks
Ayush Jain
On Tue, Jul 14, 2020 at 4:15 PM Hyukjin Kwon notifications@github.com
wrote:
Closed #1626 https://github.com/databricks/koalas/issues/1626 via #1639
https://github.com/databricks/koalas/pull/1639.—
You are receiving this because you authored the thread.
Reply to this email directly, view it on GitHub
https://github.com/databricks/koalas/issues/1626#event-3543597470, or
unsubscribe
https://github.com/notifications/unsubscribe-auth/AHQROEJR5JZY2PGDFR227QDR3QZMPANCNFSM4OPLA75Q
.
jainayush007
on 14 Jul 2020
@jainayush007 This feature will be available in the next release.
ueshin
on 14 Jul 2020
Ah I see! Do we know when would the next release happen?
On Tue, Jul 14, 2020 at 11:17 PM Takuya UESHIN notifications@github.com
wrote:
@jainayush007 https://github.com/jainayush007 This feature will be
available in the next release.—
You are receiving this because you were mentioned.
Reply to this email directly, view it on GitHub
https://github.com/databricks/koalas/issues/1626#issuecomment-658319801,
or unsubscribe
https://github.com/notifications/unsubscribe-auth/AHQROENEWIFPKS2OWENPIB3R3SKZLANCNFSM4OPLA75Q
.
jainayush007
on 14 Jul 2020
The current target is 7/16 2020. https://koalas.readthedocs.io/en/latest/development/contributing.html#release-cadence
ueshin
on 14 Jul 2020
Hi,
I started using this. Seems like is a scale issue here. Here is an example -
This is the URL of the dataset - '
https://raw.githubusercontent.com/srivatsan88/YouTubeLI/master/dataset/coronavirus/corona_dataset_latest.csv
'
Koalas + Plotly -
[image: image.png]
Pandas + Plotly -
[image: image.png]
Thanks
Ayush Jain
On Tue, Jul 14, 2020 at 11:36 PM Takuya UESHIN notifications@github.com
wrote:
The current target is 7/16 2020.
https://koalas.readthedocs.io/en/latest/development/contributing.html#release-cadence—
You are receiving this because you were mentioned.
Reply to this email directly, view it on GitHub
https://github.com/databricks/koalas/issues/1626#issuecomment-658329448,
or unsubscribe
https://github.com/notifications/unsubscribe-auth/AHQROEOGGJBZPFR567JFY6LR3SNC5ANCNFSM4OPLA75Q
.
jainayush007
on 2 Oct 2020
Hi, we can't see the images.
Could you upload the image somewhere we can see, and also could you elaborate what the issue is?
Btw, I guess opening a new issue would be better?
Thanks.
ueshin
on 2 Oct 2020
Sure, I just created issue #1817
jainayush007
on 3 Oct 2020
Related issues
 rodneyjoyce
·
4Comments
rodneyjoyce
·
4Comments
 sorenmc
·
3Comments
sorenmc
·
3Comments
 hanzigs
·
5Comments
hanzigs
·
5Comments
 chunyang
·
6Comments
ueshin
·
4Comments
chunyang
·
6Comments
ueshin
·
4Comments
Most helpful comment
Plotlybackend forpandascurrently supports:linescatterareabarboxhistogramSo I will start by implementing these.