Kibana: [APM] Transaction names ending in a "/" shows no transactions details
Kibana version:
Elastic Cloud - v6.6.1
Browser version:
Chrome 72.0.3626.119
Safari 12.0.3
Browser OS version:
MacOS 10.14.3
Original install method (e.g. download page, yum, from source, etc.):
Elastic Cloud
Describe the bug:
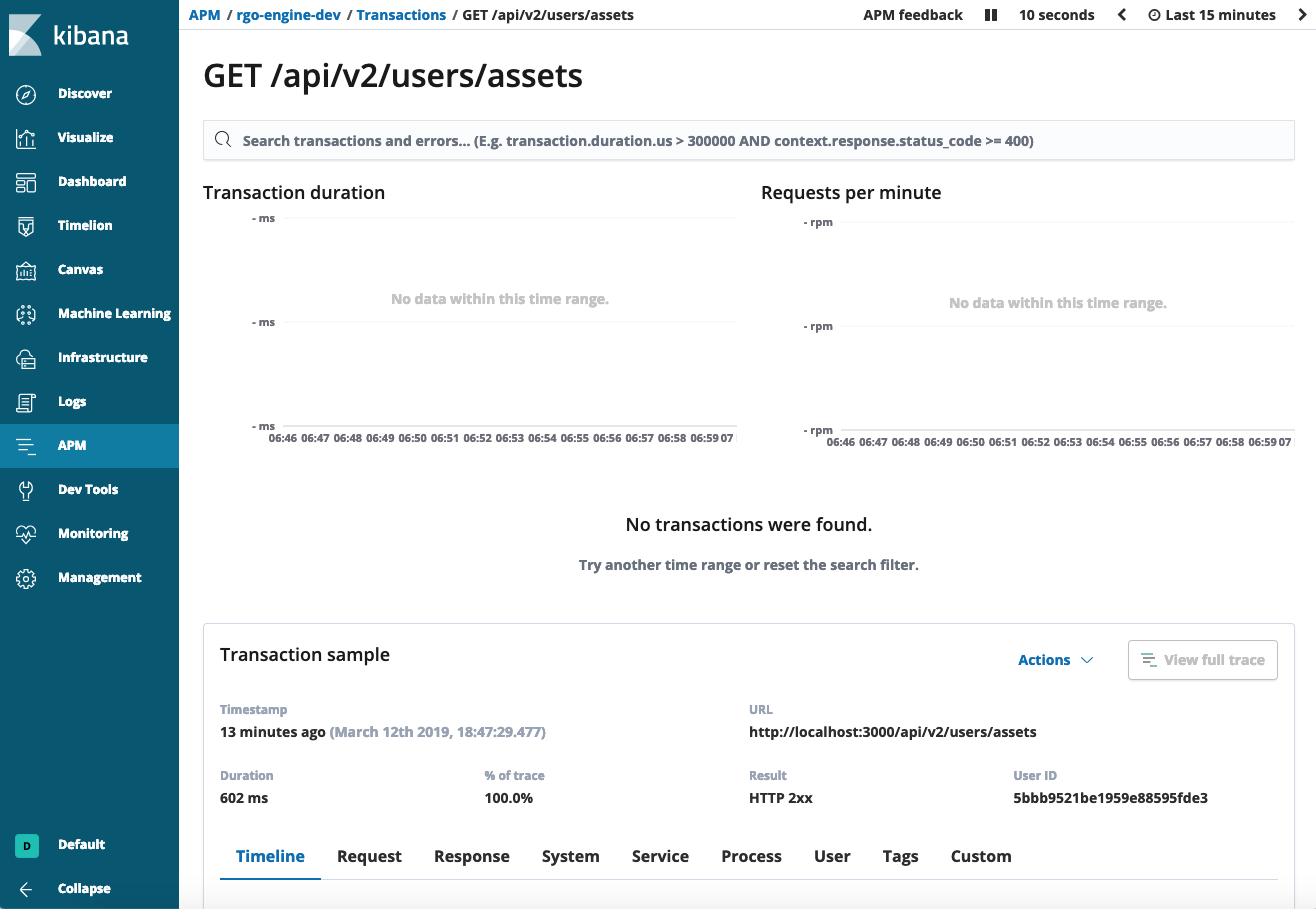
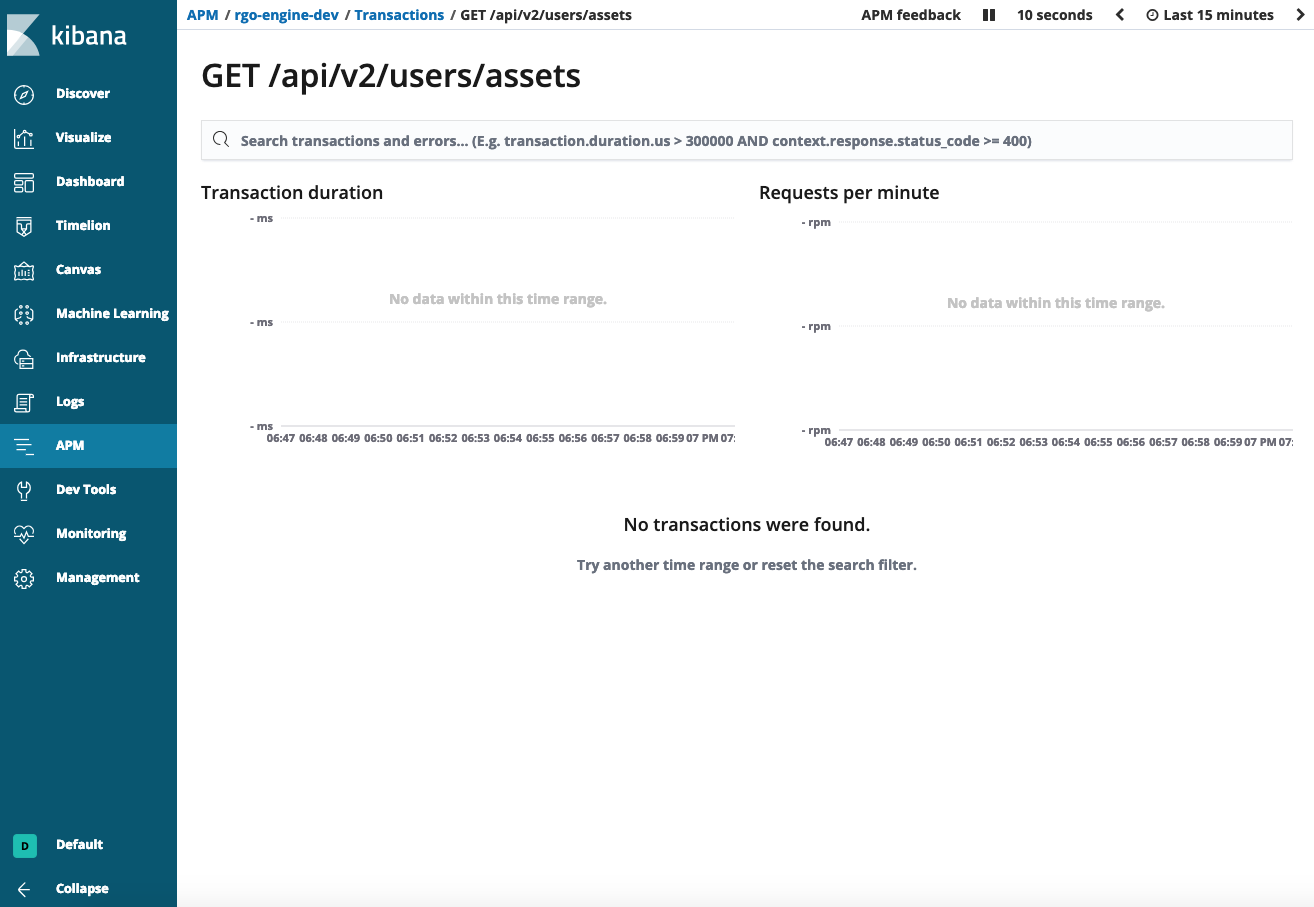
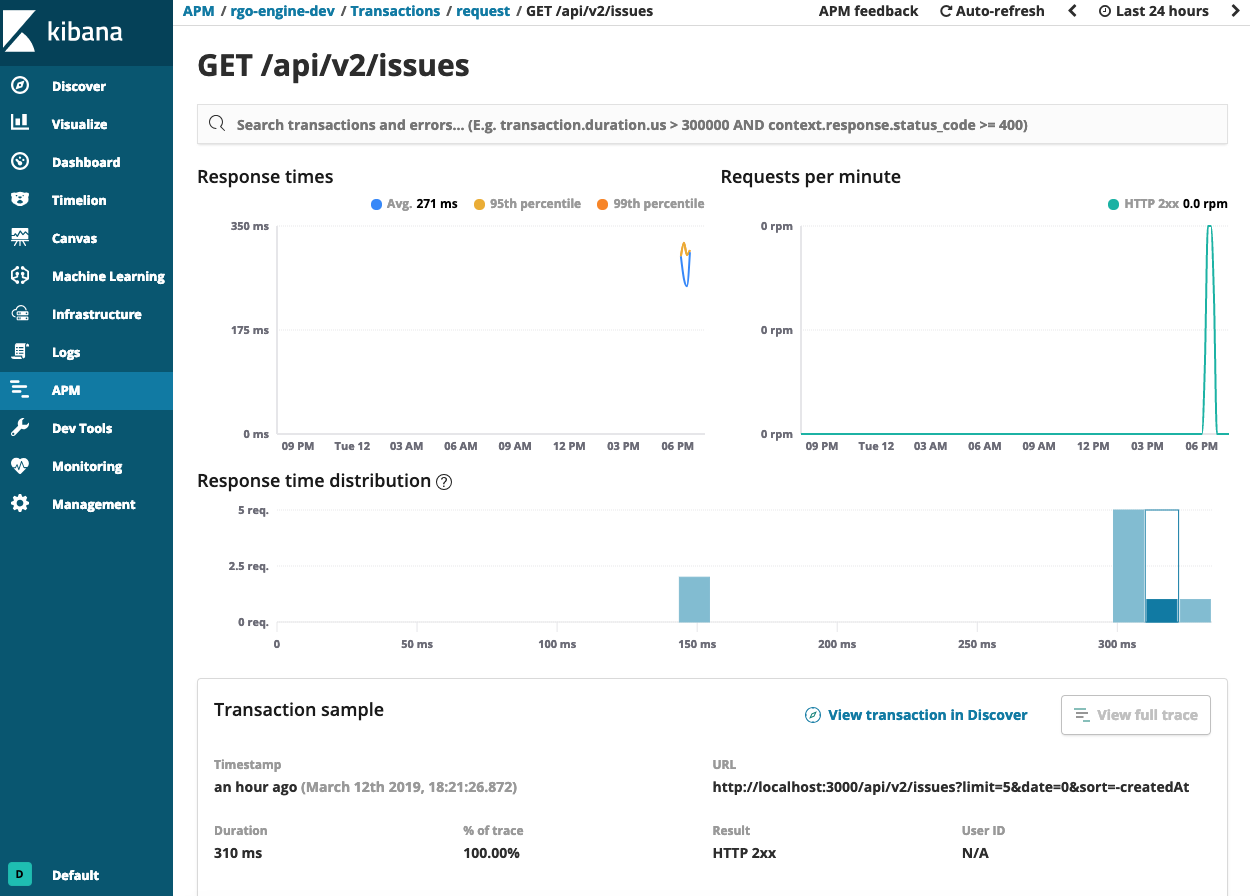
In the APM Dashboard when selecting a transaction name (route) ending in a / (for example POST /). The resulting detail screen will show "No transactions were found."
Steps to reproduce:
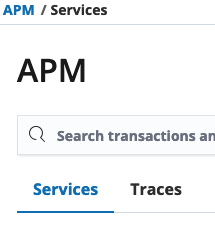
- Open Kibana and go to the APM dashboard (see img1)
- Click a transaction / route ending in a
/(see img 1) - The resulting screen does not find the correct data and shows "No transactions were found." (see img2)
Expected behavior:
The transaction details should show up like it does with any other transaction not ending in a /
Screenshots


 jornki
All 29 comments
Pinging @elastic/apm-ui
 elasticmachine
on 9 Mar 2019
elasticmachine
on 9 Mar 2019
Hello :)
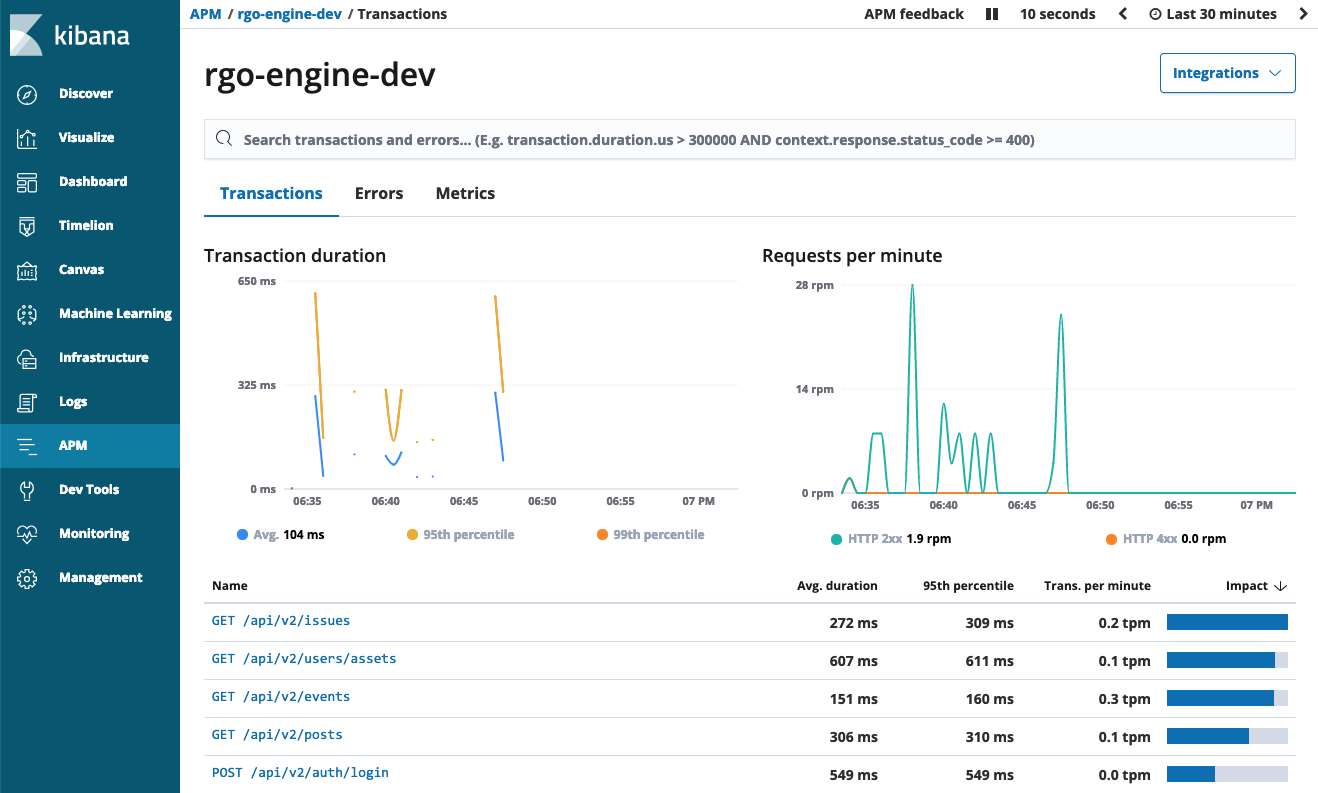
The same bug I have on Kibana 6.6.2, but also "No transactions were found." is when accessing ANY kind of transaction. But what is more interesting, when I click APM / Services , and select "Traces", and then select one of "transaction" that ends or not ends with "/" it will show details, but not all unfortunately.
Screen when access via "Traces" link:
Screen when accessed via APM / Services -> "rgo-engine-dev"
I did not have any problems with that in Kibana 6.5.
 pdanysz
on 12 Mar 2019
pdanysz
on 12 Mar 2019
Hi @jornki @pdanysz
Thanks for providing details. I'll look into this issue sometime this week and get back to you.
 sqren
on 12 Mar 2019
sqren
on 12 Mar 2019
Hi @jornki @pdanysz
Thanks for providing details. I'll look into this issue sometime this week and get back to you.
Thanks ! :)
I can confirm that Kibana 6.5.4 works correctly (I checked it few minutes ago), so in 6.6+ is some kind of buuug :)
pdanysz
on 12 Mar 2019
Hi @jornki @pdanysz
We have located the issue to be an overly eager forward proxy that was rewriting the urls. A fix has been rolled out, and it should be working again.
Can you do me a favour and try it out, and let me know how it goes?
Thanks!
sqren
on 14 Mar 2019
Neat! Seems to be working now. Thanks @sqren.
jornki
on 15 Mar 2019
Great, I'll close for now. Feel free to open if this pops up again.
sqren
on 15 Mar 2019
Hi just for clarity - the proxies were regressed rather than fixed :-)
The real fix however is coming and will probably be rolled out early next week and is in cloud staging now if anyone wants to try it there.
I'll update again back here when production is updated.
 franekrichardson
on 15 Mar 2019
franekrichardson
on 15 Mar 2019
FYI - proxy is now in all production ECE regions
franekrichardson
on 19 Mar 2019
@sqren When new release 6.6+ roll out which fix this bug ?
 cuiweiqiang
on 26 Mar 2019
cuiweiqiang
on 26 Mar 2019
@cuiweiqiang The fix was not made to Kibana but the Elastic Cloud infrastructure, so it has already been rolled out. You don't need to do anything on your end if you are using Elastic Cloud.
sqren
on 27 Mar 2019
@sqren I'm not using Elastic Cloud, but I found same situation like @pdanysz says, can I do sth ?
cuiweiqiang
on 27 Mar 2019
@cuiweiqiang If you are using a reverse proxy in front of Kibana, I'd suggest you temporarily remove it to see if that's causing the problems.
sqren
on 27 Mar 2019
@sqren Thx, the problem was fixed when I remove reverse proxy. But I can't use kibana without reverse proxy because of some reason... Emmm, this is in an awkward position :-(
cuiweiqiang
on 27 Mar 2019
@cuiweiqiang That's unfortunate. Is it by any chance a proxy written in Go? http.ServeMux has an issue where it decodes encoded forward slashes (%2F) in urls.
sqren
on 27 Mar 2019
@sqren Sorry,we are using nginx in our production and pre-production,so we can't change reverse proxy.Thanks for your help,I'm thinking about the other way.
cuiweiqiang
on 27 Mar 2019
We're experiencing the same issue with a nginx reverse proxy on Kubernetes, and it appears that there isn't really a way to turn off decoding https://github.com/kubernetes/ingress-nginx/issues/1615
In our case we can live with this as the only url it affects is the root / path (which doesn't really do anything on our API), but I don't think it's possible to fix it even if we wanted to.
 kpsuperplane
on 10 Apr 2019
kpsuperplane
on 10 Apr 2019
I dont believe the ingress-nginx decodes the url - only if you use a rewrite rule. If you're using an ingress-nginx in GCP, however, the GCP load balancer does seem to decode the url - causing the issues highlighted here. Preventing nginx from decoding is relatively trivial fix
 gingerwizard
on 16 Apr 2019
gingerwizard
on 16 Apr 2019
@gingerwizard ah ok, it must be our GCP load balancer too then. I checked again and don't believe we're using any rewrite rules haha.
For what it's worth, we worked around this on RUM by having the agent append a ? to the end of every url.
kpsuperplane
on 16 Apr 2019
Further analysis actually determined it wasn’t a gcp load balancer but a proxy higher up in our stack. Provided you don’t use rewrite rules the nginx ingress should be fine. This is usually used with a tcp loadblancer which doesn’t rewrite or manipulate the http layer.
Do you mean you appended ? To the transaction name?
gingerwizard
on 17 Apr 2019
Hey All, I am having the same issue in kibana 7.1.0. Can somebody take a look? Or do I need to reopen the ticket?
 alogishetty
on 23 May 2019
alogishetty
on 23 May 2019
@alogishetty Please elaborate. What is the problem you are having, which views and urls are affected? Do you use a proxy? If so which one, and have you tried removing it?
sqren
on 23 May 2019
Hey Sqren,
I am using Kibana out of the box for on-premise software. My transaction names are like below,
- api.v1/users_user_info_api
- api.v1/organizations_org_service_instances_api
- api.v1/users_user_info_by_org_by_environment_api
When I click on a particular transaction to see the details, the charts and distribution urls fail with 404
- /api/apm/services/service-dev/transaction_groups/custom/api.v1%2Fusers_user_info_api/charts?start=2019-05-22T20%3A35%3A24.704Z&end=2019-05-23T20%3A35%3A24.70
- /api/apm/services/service-dev/transaction_groups/custom/api.v1%2Fusers_user_info_api/distribution?start=2019-05-22T20%3A35%3A24.704Z&end=2019-05-23T20%3A35%3A24.704Z
I think the correct URLs should be
- /api/apm/services/service-dev/transaction_groups/custom/api.v1~2Fusers_user_info_api/charts?start=2019-05-22T20%3A35%3A24.704Z&end=2019-05-23T20%3A35%3A24.70
- /api/apm/services/service-dev/transaction_groups/custom/api.v1~2Fusers_user_info_api/distribution?start=2019-05-22T20%3A35%3A24.704Z&end=2019-05-23T20%3A35%3A24.704Z
I hope this information helps
alogishetty
on 23 May 2019
@alogishetty Thanks! The first urls (/api.v1%2Fusers_user_info_api/charts) actually look fine. I'd expect something else to rewrite them.
Are you calling kibana directly? Eg. By default kibana listens on 5601, so in that case you should access it via localhost:5601.
sqren
on 23 May 2019
Yes @sqren, kibana is running on 5601.
For the 1st urls, I get 404 response code and for the 2nd urls I get 200 response code with data.
alogishetty
on 23 May 2019
@sqren , please look at the transaction detail page URL, it is "api.v1~2Fusers_user_info_api" instead of "api.v1%2Fusers_user_info_api"
- /app/apm#/service-dev/transactions/custom/api.v1~2Fusers_user_info_api?rangeFrom=now-24h&rangeTo=now&refreshPaused=true&refreshInterval=0
alogishetty
on 23 May 2019
@sqren, yes, there was a proxy which was causing the issue. It is fixed now. Thank you!
alogishetty
on 24 May 2019
@alogishetty Good to hear. What did you do to fix it? Did you configure the proxy to not rewrite urls or remove it entirely? And what proxy was it?
I'm working on a fix on our end so this shouldn't cause problems for proxies so the more info I can get the better.
sqren
on 24 May 2019
A fix for this issue has been merged to master and will be available in Kibana 7.3: https://github.com/elastic/kibana/pull/37072
sqren
on 24 May 2019
Related issues
 timroes
·
3Comments
timroes
·
3Comments
 socialmineruser1
·
3Comments
socialmineruser1
·
3Comments
 LukeMathWalker
·
3Comments
LukeMathWalker
·
3Comments
 stacey-gammon
·
3Comments
stacey-gammon
·
3Comments
stacey-gammon
·
3Comments
stacey-gammon
·
3Comments