Kibana: [Uptime] ICMP not showing as an option when present in Heartbeat index
Kibana version:
6.7 branch
Elasticsearch version:
6.7 snapshot
Server OS version:
macOS
Browser version:
Chrome 72
Browser OS version:
macOS
Original install method (e.g. download page, yum, from source, etc.):
from source
Describe the bug:
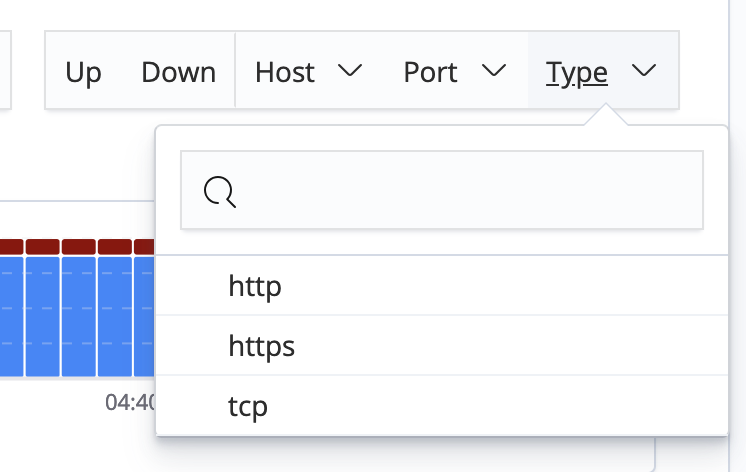
When tracking an ICMP monitor in Heartbeat, the corresponding monitor type does not appear as an option in the filter dropdown.
Steps to reproduce:
- Start up Heartbeat with an ICMP monitor (you'll need super user privileges)
- Load the Uptime UI
- Attempt to filter by monitor type: ICMP
Expected behavior:
ICMP will be a filter option
Screenshots (if relevant):
Define a configuration like:
heartbeat.monitors:
- type: icmp
  schedule: '@every 5s'
  hosts:
    - "www.elastic.co"
    - "localhost"
- type: tcp
  schedule: '@every 30s'
  hosts:
    - "8.8.8.8:53"
- type: http
  schedule: '@every 5s'
  urls:
    - "https://www.google.com"
    - "http://www.google.com"
    - "https://discuss.elastic.co/"
    - "https://www.elastic.co"
    - "https://demo.elastic.co"
    - "http://fake.elastic.co"
    - "https://github.com/elastic/kibana"
  check.response.status: 200
Errors in browser console (if relevant):
N/A
Provide logs and/or server output (if relevant):
N/A
Any additional context:
N/A
 justinkambic
All 9 comments
Pinging @elastic/uptime
 elasticmachine
on 20 Feb 2019
elasticmachine
on 20 Feb 2019
FWIW, ICMP monitors seem to be filtered out by some of the UI components at the moment:

 roncohen
on 25 Feb 2019
roncohen
on 25 Feb 2019
The reason we are experiencing the lack of ICMP as an option on the _Type_ dropdown is because we are using monitor.scheme at the moment. This allows us to filter on things like TCP, HTTP, and HTTPS, but ICMP won't show up in there. We are going to change it to use the monitor.type field, which will cause us to lose HTTPS, but include ICMP.
The second issue, ICMP monitors excluded from some lists, is because we are using a composite aggregation on monitor.id and tcp.port. ICMP monitors don't have a tcp.port field, so we will likely have to run a separate query for them or add a new aggregation to the existing queries to make sure we have them showing up in the results.
justinkambic
on 25 Feb 2019
just making sure?:
will cause us to lose
HTTPS
it will cause HTTP and HTTPS to generally be grouped together, but HTTPS monitors will still show up, correct?
using a composite aggregation on
monitor.idandtcp.port
I see. The same monitor.id can have multiple tcp.port?
roncohen
on 25 Feb 2019
it will cause HTTP and HTTPS to generally be grouped together, but HTTPS monitors will still show up, correct?
Yes, sorry, I should've phrased that better. This should not cause us to lose HTTPS monitors in any way, just the ability to filter directly on them. I think users can still enter filters for this field manually, but that is something else worth checking.
I see. The the same
monitor.idcan have multipletcp.port?
In 6.7 this is true; we modified the values provided for the ID field in 7.x.
justinkambic
on 25 Feb 2019
Progress on fixing this is hampered by the lack of a unique identifier for ICMP ES documents.
Best-case for 6.7 I can think of is we will be able to identify ICMP uniquely on monitor.ip. Hoping to publish a PR later today.
justinkambic
on 26 Feb 2019
@justinkambic we don't need a separate query, but we do need to set the missing option on the agg. See the terms agg docs for more info here.
 andrewvc
on 1 Mar 2019
andrewvc
on 1 Mar 2019
@andrewvc that is a much nicer solution; I'll come back around to it ASAP. Feel free to jump in if you have time.
justinkambic
on 1 Mar 2019
I've fixed the missing monitor.id field here: https://github.com/elastic/beats/pull/11036 . Hopefully it will make 6.7. I don't think it's quite bad enough to be a blocker.
andrewvc
on 1 Mar 2019
Related issues
 bradvido
·
3Comments
bradvido
·
3Comments
 snide
·
3Comments
snide
·
3Comments
 stacey-gammon
·
3Comments
stacey-gammon
·
3Comments
 bhavyarm
·
3Comments
bhavyarm
·
3Comments
 cafuego
·
3Comments
cafuego
·
3Comments