Kibana: Pipeline overview showing 0 events emitted rate on recent Last N minutes timepicker selection
Not sure if this has the same underlying cause as https://github.com/elastic/kibana/issues/19429.
The issue reported here is the opposite behavior of 19429.
In the pipeline overview screen, it shows all pipelines having 0 e/s emitted rate:

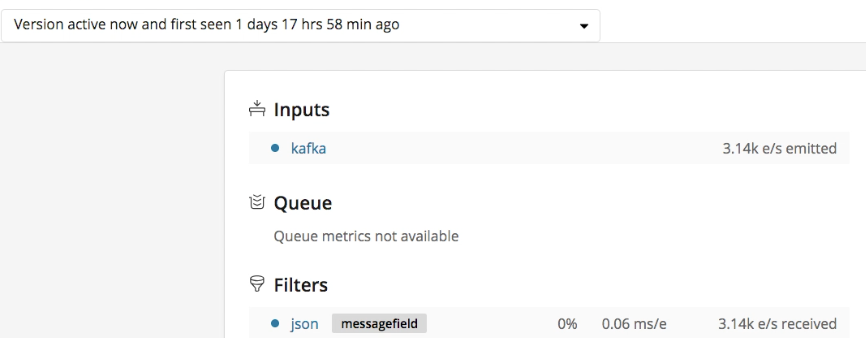
But when clicking into a pipeline to look at the "version active now", it does show positive e/s:
If we switch the pipeline overview screen to show Last 30 minutes instead of Last 15 minutes, then positive e/s metrics started showing up.
This suggests that looking at a longer time range with larger buckets is the key to allow metrics to show up in the pipeline overview screen. Is this the expected behavior? If so, can we add a mouseover indicator letting the end user know that they will have to increase the time range in order to see e/s, etc..?
 ppf2
ppf2
All 6 comments
I encountered the same issue today. Any solution?
 iShiBin
on 30 Sep 2018
iShiBin
on 30 Sep 2018
@iShiBin if you check the last few sentences, we have discovered that changing the bucket size from 15 minutes to 30 minutes does cause e/s metrics to start appearing. More work will be needed to figure out why this bug takes place, but that is the workaround we're employing at the moment. cc @ppf2
 justinkambic
on 1 Oct 2018
justinkambic
on 1 Oct 2018
I figured it out later on. Thanks for the feedback. Have a good day.
iShiBin
on 2 Oct 2018
Hey @justinkambic, do you have any update on this bug?
 fdartayre
on 2 May 2019
fdartayre
on 2 May 2019
Hi - I am generally not working on Logstash issues as much these days as I have been assigned to a different team, which has obviously reduced my bandwidth. As far as I know there hasn't been much movement here, maybe @elastic/logstash or @elastic/stack-monitoring has a better update?
justinkambic
on 2 May 2019
We (@elastic/stack-monitoring) will take this one.
 cachedout
on 3 May 2019
cachedout
on 3 May 2019
Related issues
 spalger
·
3Comments
spalger
·
3Comments
 ctindel
·
3Comments
ctindel
·
3Comments
 socialmineruser1
·
3Comments
socialmineruser1
·
3Comments
 stacey-gammon
·
3Comments
stacey-gammon
·
3Comments
 cafuego
·
3Comments
cafuego
·
3Comments
Most helpful comment
We (@elastic/stack-monitoring) will take this one.