Kibana: Login screen is shown when ES down, regardless of security
Kibana version: 6.3.0
Elasticsearch version: 6.3.0
Describe the bug:
If the elasticsearch cluster is down, Kibana shows the following screen:
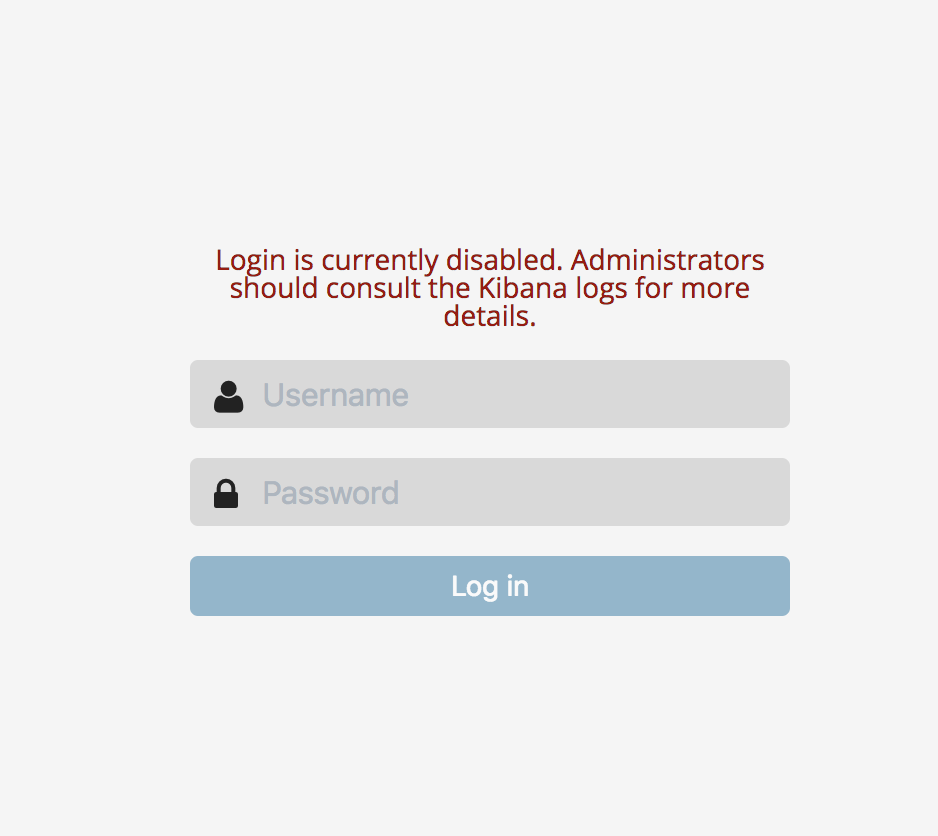
.... which doesn't make much sense if you don't have security enabled. Perhaps we should just show a cluster-unreachable message instead? Also, there's no indication of the need to refresh that page in order to continue after the ES cluster is back up. Could we not keep trying to reach the cluster (and make obvious that we are doing so on this page?)
 clintongormley
All 8 comments
Do you see this when security is disabled in Kibana or just when it is disabled in Elasticsearch?
 epixa
on 23 Jun 2018
epixa
on 23 Jun 2018
I see this with the default settings in Kibana 6.3.0. If I look at the log, I see that the security plugin is enabled, and I see no (obvious) way of disabling it in the config.
clintongormley
on 24 Jun 2018
This was the intended experience with security enabled in Kibana, but now that security is technically enabled by default for most users, it doesn't really make sense.
I think your proposal of having a dedicated elasticsearch-inaccessible page makes a lot of sense. Folks with security didn't want the whole status page being shown in this scenario since they felt there was too much information about their install to show to unauthenticated users, but I think a simple notice that Elasticsearch is not accessible and that admins should consult the logs for details makes sense.
This is another area where I really wish we had a definitive production/non-production mode in Kibana similar to how it works in Elasticsearch. I'd love to show detailed information and even steps to rectify the problem in the error page when not in production and just point people to logs otherwise, but alas we have no such flexibility at the moment.
epixa
on 25 Jun 2018
@elastic/kibana-platform
epixa
on 25 Jun 2018
@tylersmalley @jinmu03 Is it possible to fix this for 6.4 ?
 jimgoodwin
on 23 Jul 2018
jimgoodwin
on 23 Jul 2018
@jimgoodwin We're working hard to try and get this in for 6.4, but no guarantees. I expect to have a PR up today.
 tylersmalley
on 23 Jul 2018
tylersmalley
on 23 Jul 2018
Following a quick sync with @tylersmalley trying to fit this into 6.4,
Once ES is down Kibana will refer to a page with a similar layout but without the login form and button, instead, we will show a message explaining that Kibana couldn't reach Elasticsearch, this situation might happen since:
- Elasticsearch is down and can't be reached, please make sure Elasticsearch is up and running
- Kibana is pointing to a wrong
elasticsearch.urlin the yml file, please make sure the yml file is pointing to the right URL
cc: @gchaps can you please help with the error message
 AlonaNadler
on 24 Jul 2018
AlonaNadler
on 24 Jul 2018
Stepping in for @gchaps since she's out this week. Here's my recommendation:
Cannot connect to Elasticsearch
The cluster might be down or Kibana might have failed to connect due to a network or configuration problem.
Administrators, verify that the Elasticsearch cluster is available and elasticsearch.url is configured correctly in kibana.yml. See the Kibana logs for more information.
 debadair
on 24 Jul 2018
debadair
on 24 Jul 2018
Related issues
 timroes
·
3Comments
timroes
·
3Comments
 timmolter
·
3Comments
timmolter
·
3Comments
 snide
·
3Comments
snide
·
3Comments
 spalger
·
3Comments
spalger
·
3Comments
 tbragin
·
3Comments
tbragin
·
3Comments