Kibana: Line chart can clip or fail to show point at the top of the range
Kibana version: 6.0.0-beta1
Elasticsearch version: 6.0.0-beta1
Server OS version: CentOS
Browser version: Chrome
Browser OS version: Windows 10
Original install method (e.g. download page, yum, from source, etc.): .rpm packages
Description of the problem including expected versus actual behavior:
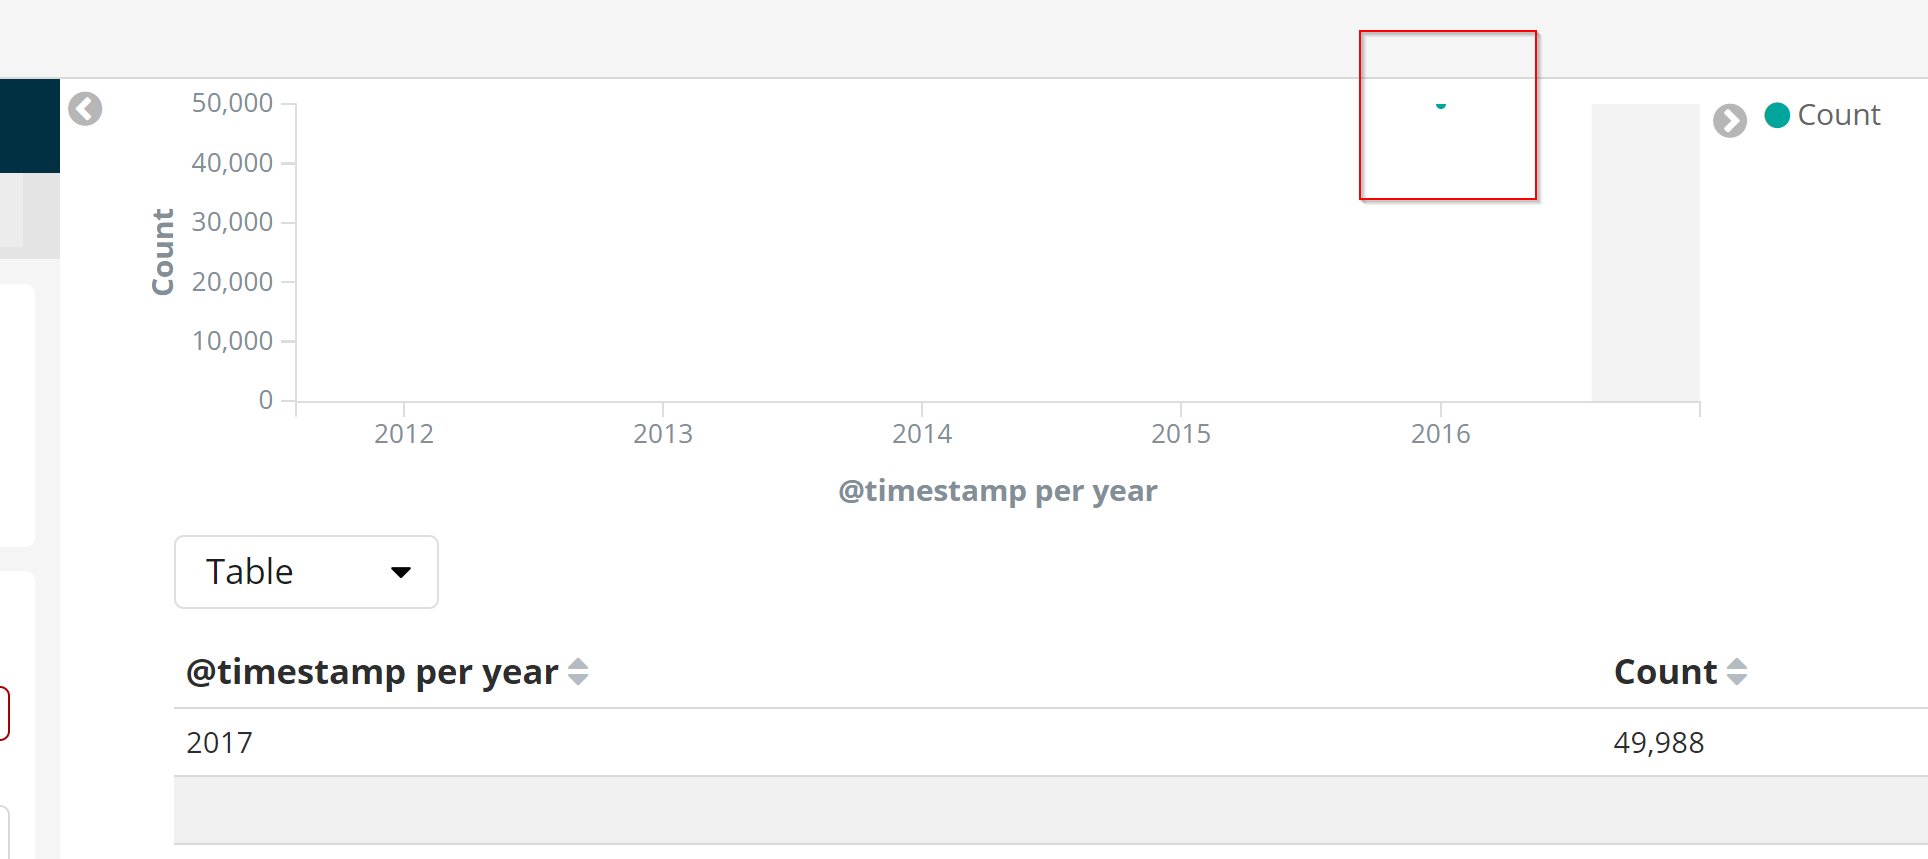
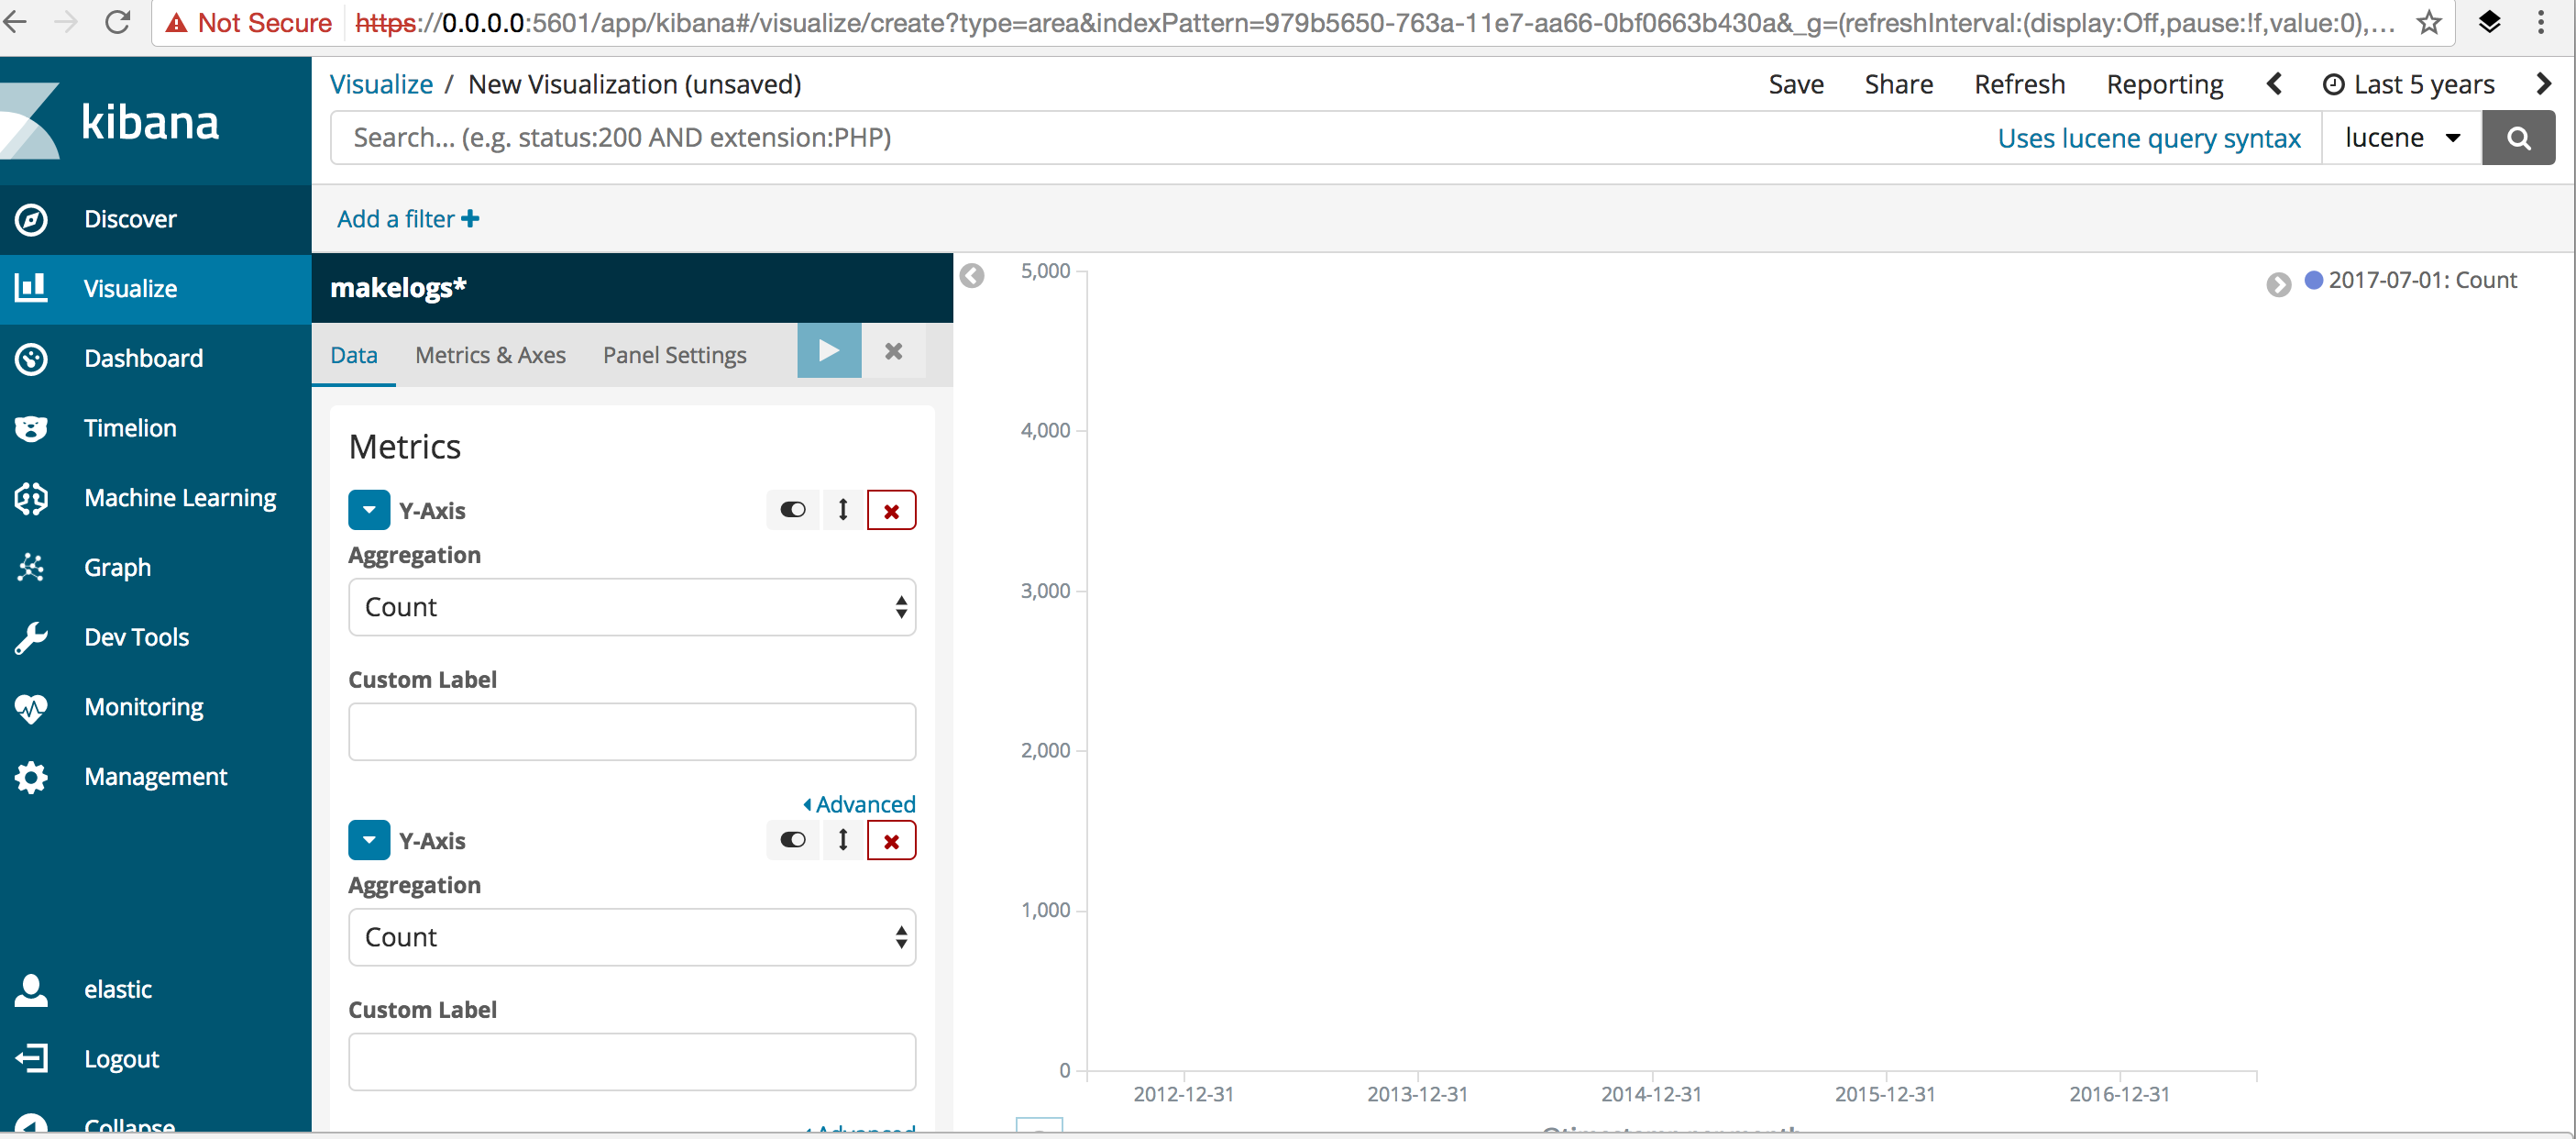
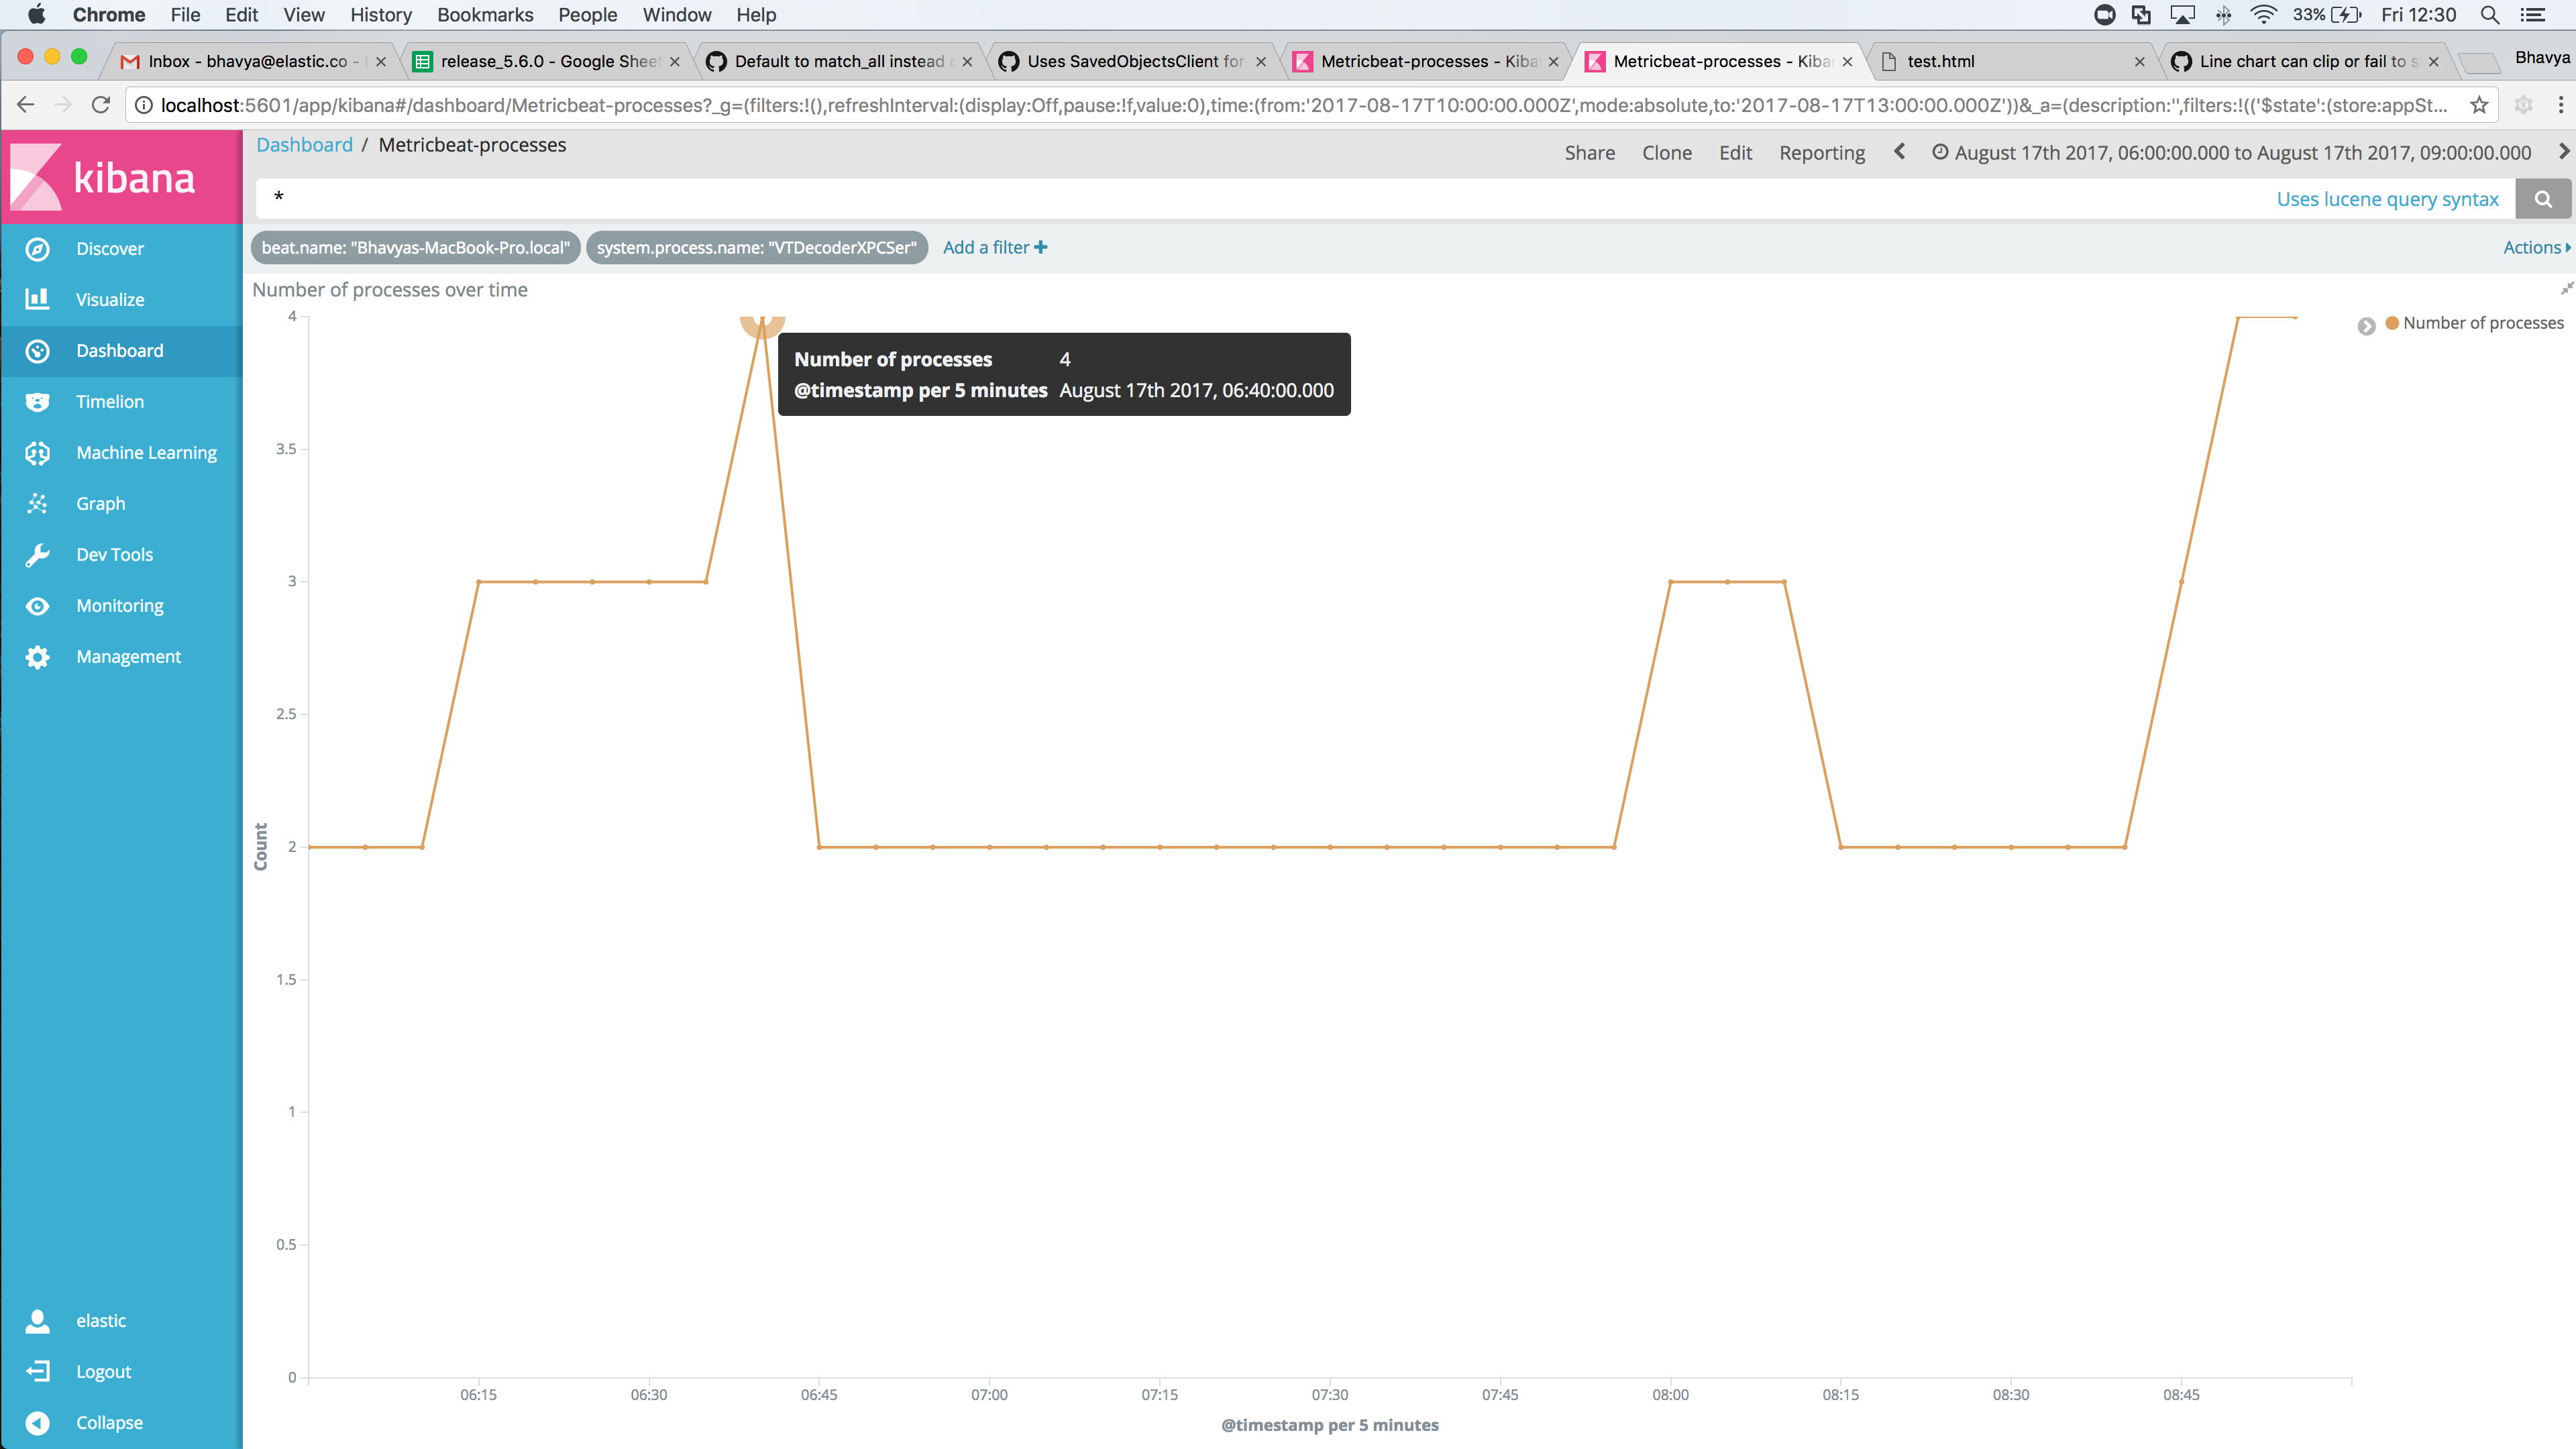
In my case I had selected a large timespan (Last 5 years) and large Interval for a Date Histogram (yearly) which resulted in 1 data point for my metricbeat data. The Count was 49,988 and the y-Axis scale was 0 - 50,000. So in this case the one data point is half cut off in the visualization (see screenshot).
@rasroh had a very similar case where we couldn't even see the data point. We had to look at the data in the spy panel to figure out that the point was near the y-axis max value.
Steps to reproduce:
- Load some data for a short timespan
- Create a Line visualization on that data. Select a large timespan and large interval so you only have 1 data point. I don't know if this is really required. It might be that there can be multiple data points and the highest ones will be clipped or missing.
3.
Here's the screenshot with the spy panel open showing the circle data point clipped in half. It looks the same when the spy pnel is closed.
Errors in browser console (if relevant):
Provide logs and/or server output (if relevant):
 LeeDr
LeeDr
All 10 comments
The only suggestion is that we add some small padding percentage to the highest value when determining the Y-Axis scale.
Maybe in the case above, we still keep 50,000 as the highest label on the axis, but extend the chart a little bit above that.
Think of the case where all the values are either 0 or 1. You could have 1 as the highest mark on the Y-Axis, but you don't want to show half a circle for all of the 1s (or the 0s).
LeeDr
on 1 Aug 2017
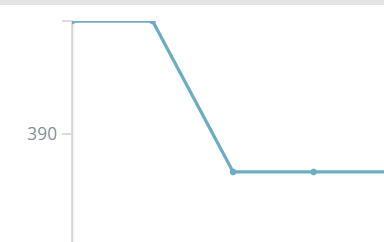
I went back to see if this was a regression and I see some similar issues as far back as 5.2. In this case I set the option Scale Y-Axis to Data Bounds and the circles and connecting line are clipped in half.
LeeDr
on 1 Aug 2017
@rasroh had a very similar case where we couldn't even see the data point. We had to look at the data in the spy panel to figure out that the point was near the y-axis max value.
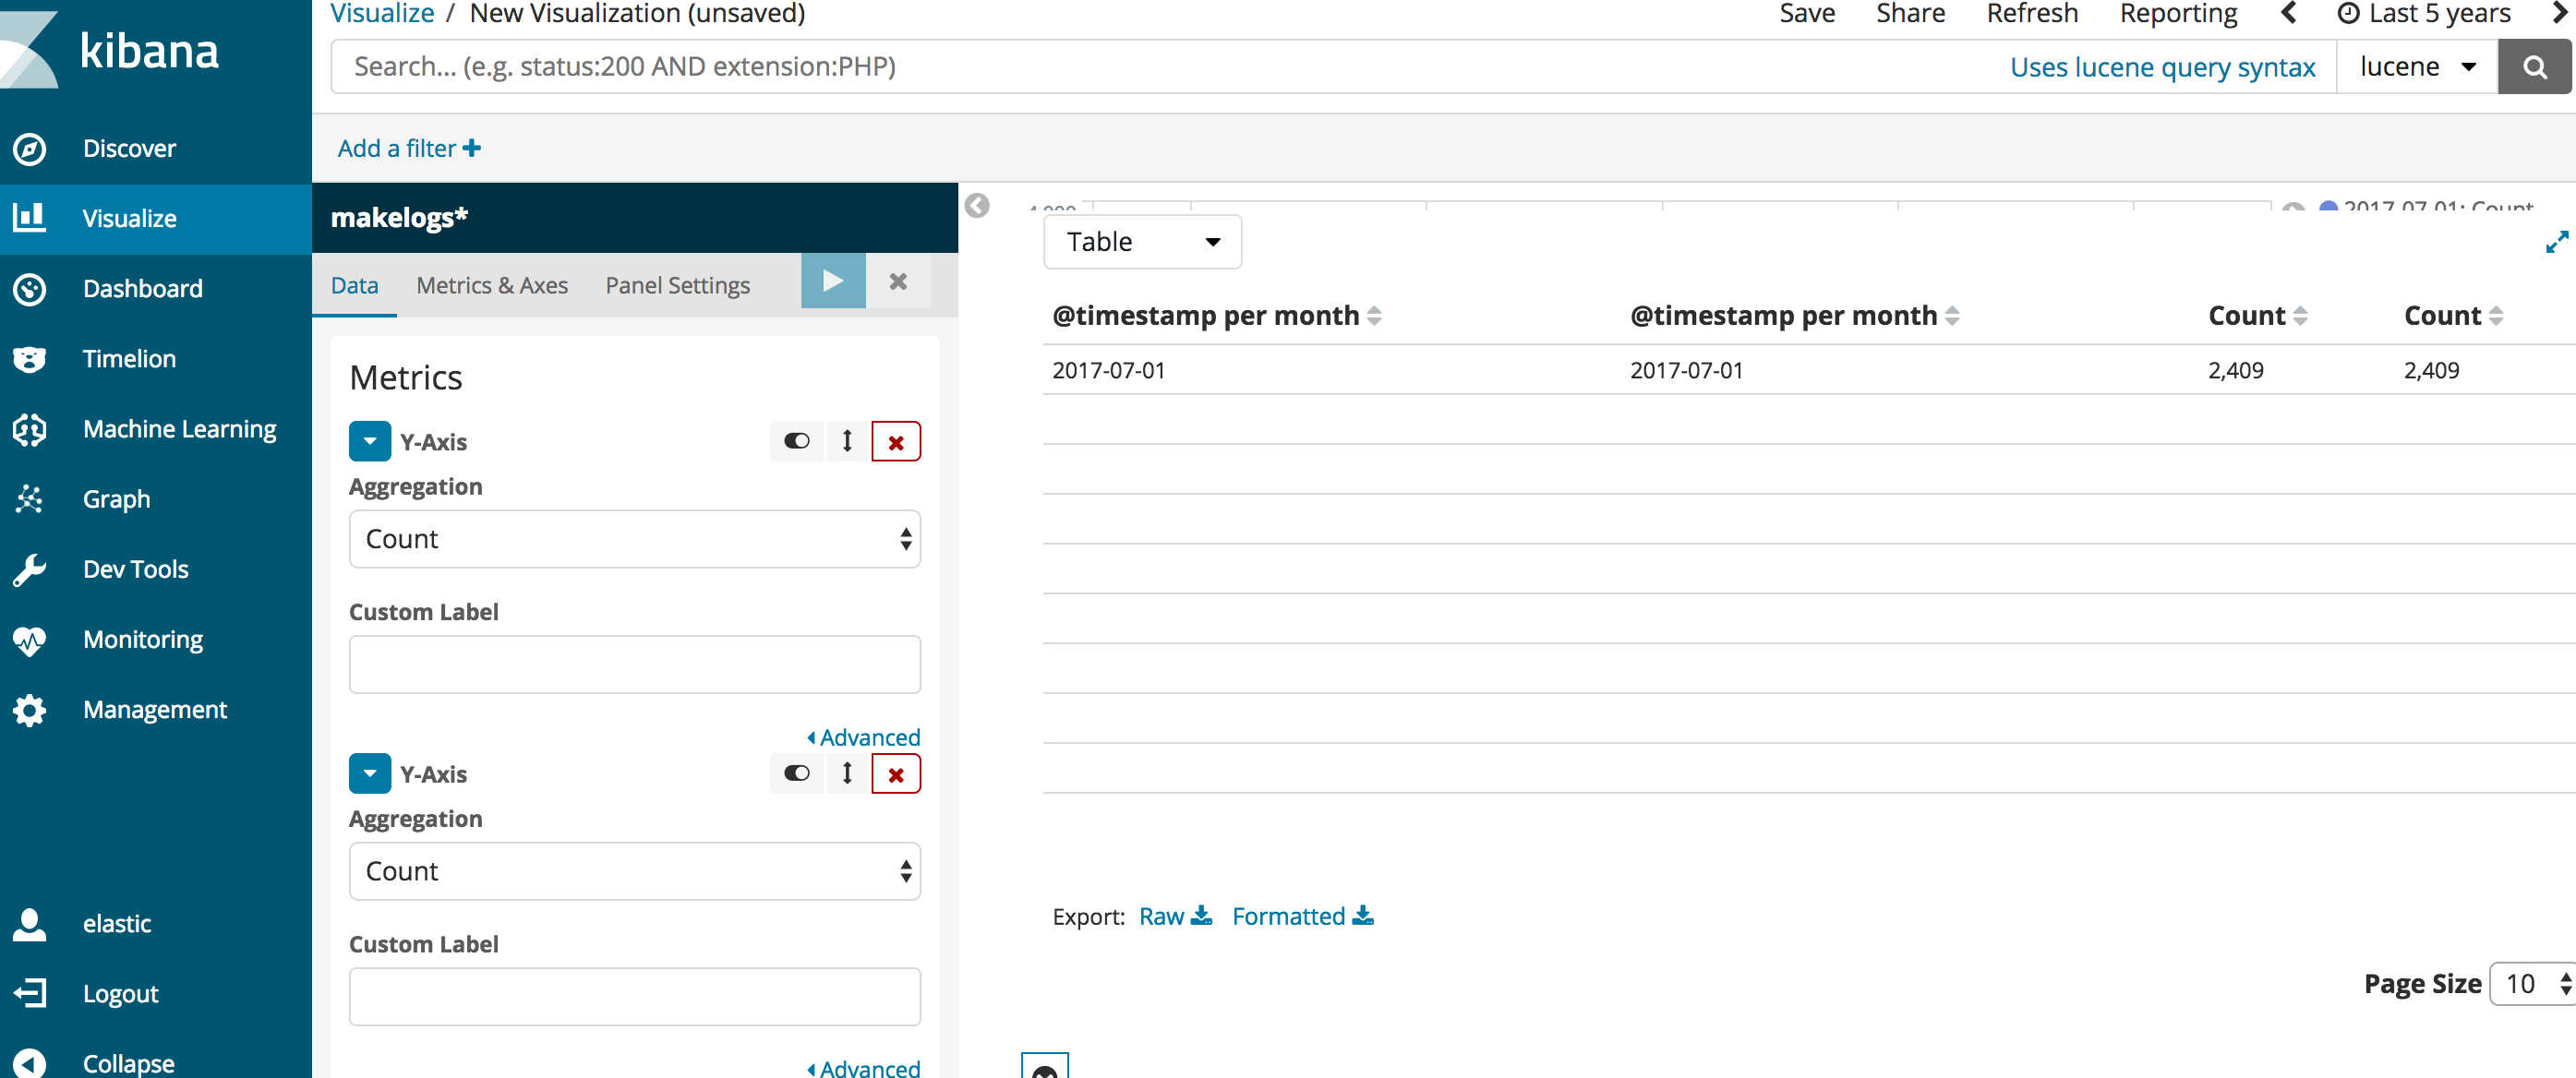
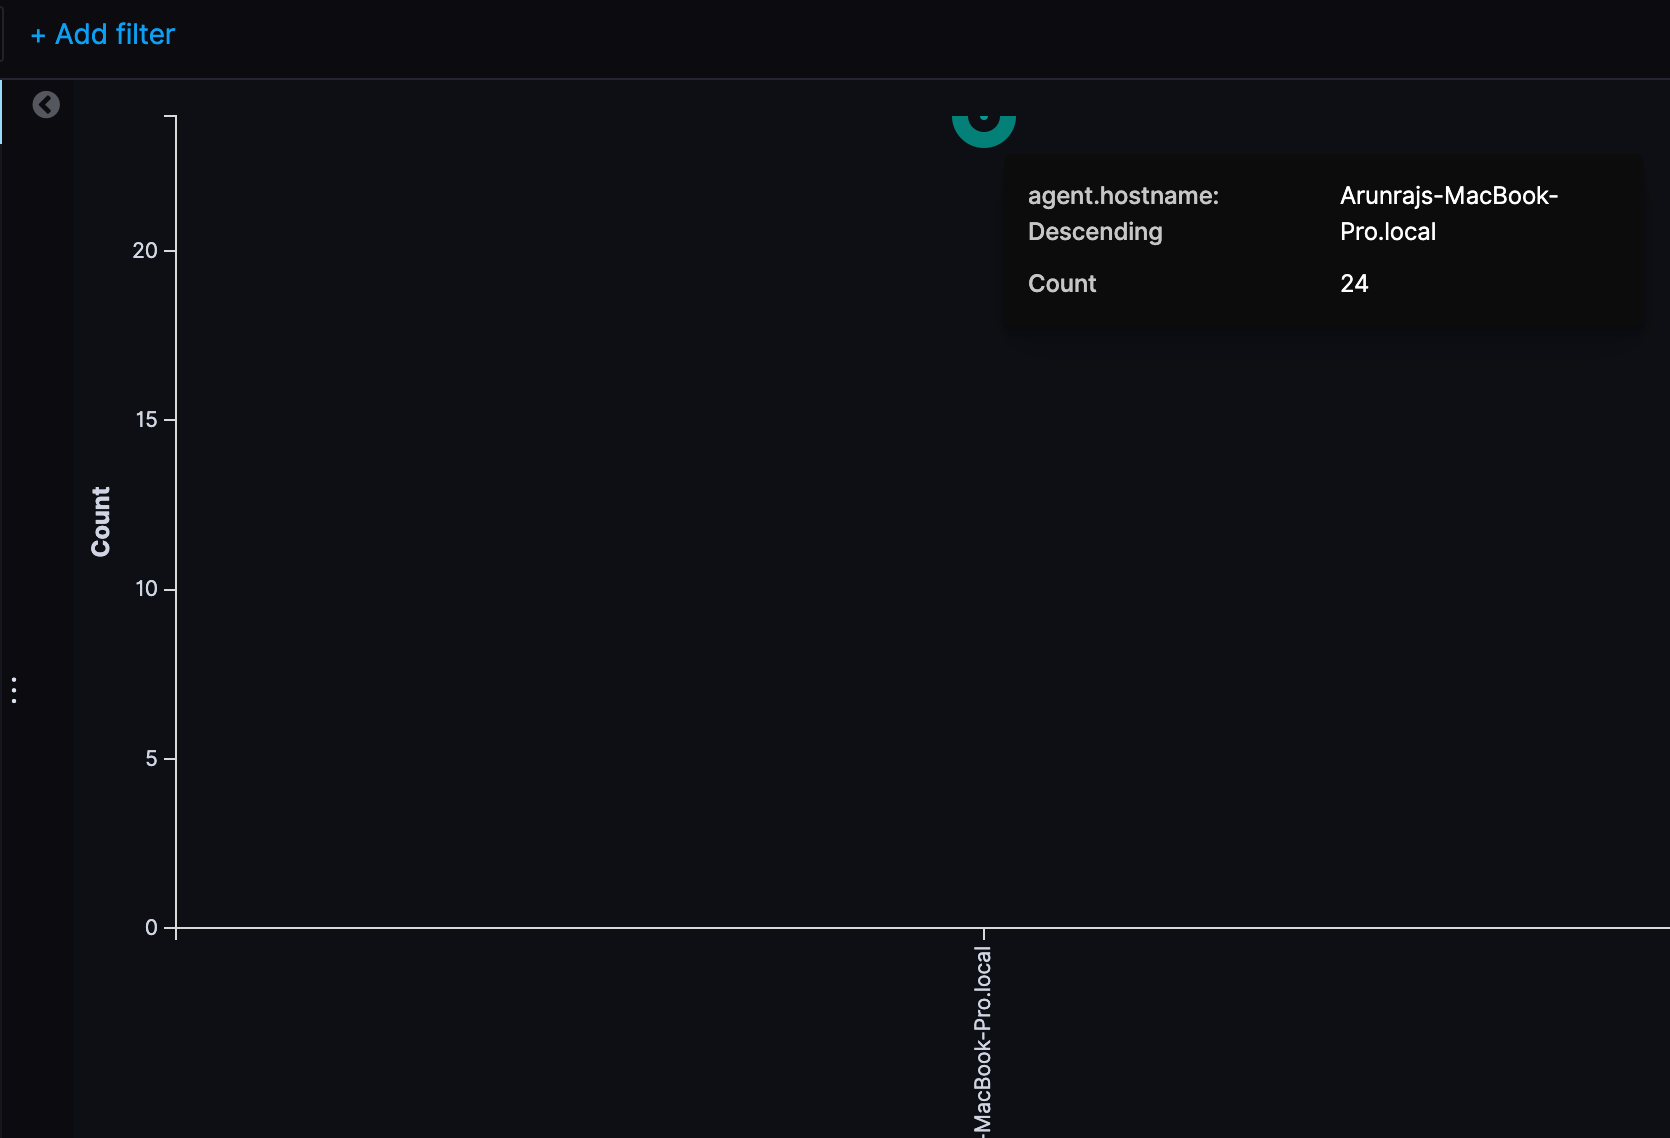
Yes, to elaborate more further on this...this is what I saw in the charts . Data is seen in the spy panel but not in the charts...
 rashmivkulkarni
on 1 Aug 2017
rashmivkulkarni
on 1 Aug 2017
@rasroh Your issue looks to be the same as mine but instead of clipping off the data on the top of the chart, yours must be clipped off on the right side of the chart. In fact, I'm not sure why your Y-Axis goes to 5000 when you only have one data point with a value of 2409.
Yours looks like a case where 2017-07-01 would be on the very far right edge of the chart but isn't being shown.
LeeDr
on 1 Aug 2017
Half moon circle on 5.6.0.
 bhavyarm
on 18 Aug 2017
bhavyarm
on 18 Aug 2017
Hi, this is still an issue in Kibana 6.5.0. Have you got any plans to fix it in new releases?
I can't think of a single downside on including just a little padding on the top and bottom of the chart? It should be at least the size of the circle or the line.
 alexweil
on 3 Dec 2018
alexweil
on 3 Dec 2018
This issue is still there in Kibana-7.1.1
 arunraj88
on 12 Jun 2019
arunraj88
on 12 Jun 2019
7.3
@markov00 FYI if the issue is believed fixed by elastic/elastic-charts#20
 benbuzbee
on 23 Sep 2019
benbuzbee
on 23 Sep 2019
@benbuzbee it's fixed on elastic-charts but this visualization is not yet using elastic-chart as the underlying library. We are replacing Discover and TSVB charts with elastic-charts in 7.5, soon after we will replace also other Visualize charts
 markov00
on 24 Sep 2019
markov00
on 24 Sep 2019
Understood, the different underlying visualization libraries were not known to me :) thank you for the info and for fixing the issue!!
benbuzbee
on 25 Sep 2019
Related issues
 bradvido
·
3Comments
bradvido
·
3Comments
 ynux
·
3Comments
ynux
·
3Comments
 snide
·
3Comments
snide
·
3Comments
 MaartenUreel
·
3Comments
MaartenUreel
·
3Comments
 mark54g
·
3Comments
mark54g
·
3Comments
Most helpful comment
Hi, this is still an issue in Kibana 6.5.0. Have you got any plans to fix it in new releases?
I can't think of a single downside on including just a little padding on the top and bottom of the chart? It should be at least the size of the circle or the line.