Kibana: Heatmap: There are too many series defined (Ref:#10132)
Kibana version: 5.4
Elasticsearch version: 5.4
Server OS version: SLES 12 x64
Browser version: Chrome
Browser OS version: Windows 7
Original install method (e.g. download page, yum, from source, etc.): Download page
Reference issue: #10132
Description of the problem including expected versus actual behavior:
I'm trying to visualise data with heatmap. If I set in aggrigation show me top 6 terms in X-Axis and top 8 terms on the Y-Axis then I recive message "There are too many series defined"
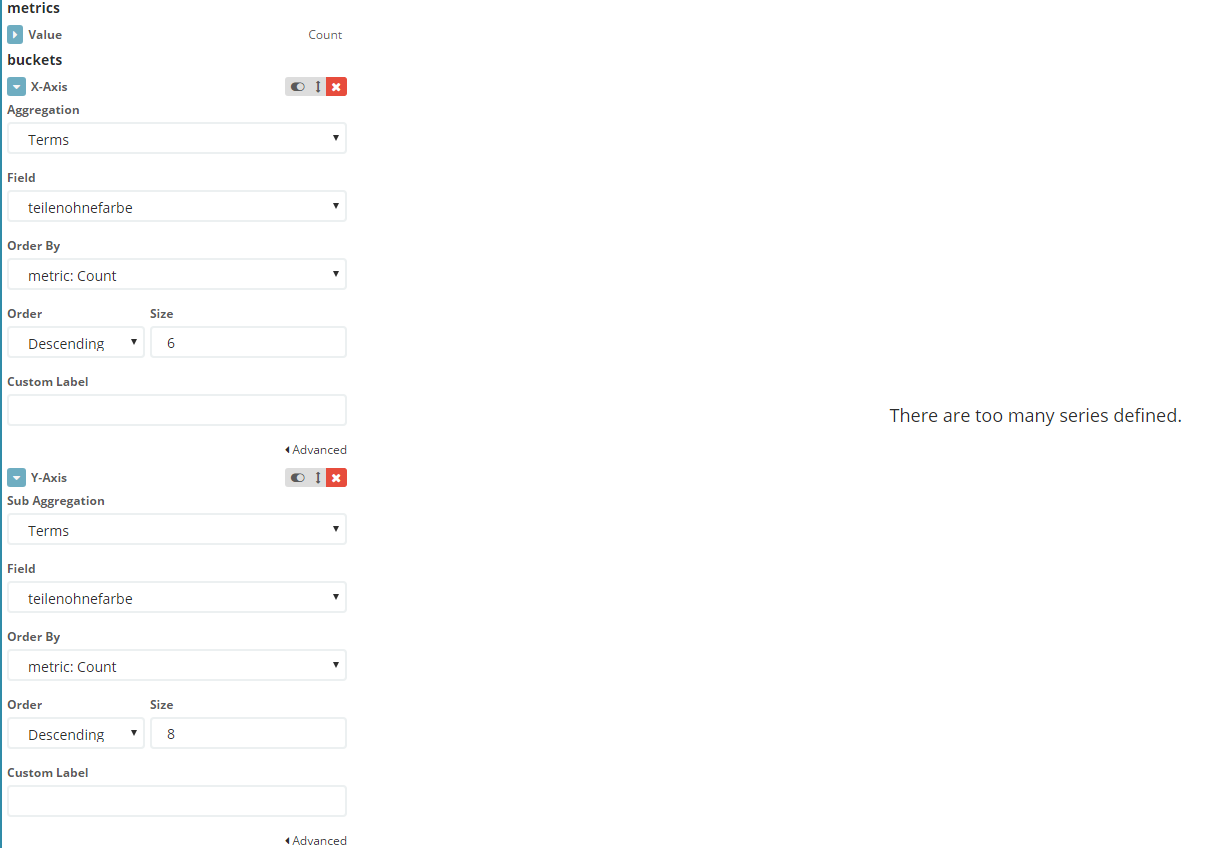
Steps to reproduce:
- Select index
- Set top 6 term with some Field in X-Axis
- Set top 8 term with the same Field in Y-Axis
 sasauz
All 9 comments
I ran into this issue in a few use cases
Use case: CPU core utilization
My workstation has 20 cores / 40 hyperthreads.
I am using metricbeat and wanted to show per-core CPU utilization over time. I can show up to 10 items, but I have 40 cores I'd like to show.

Use case: Hockey team summary
Hockey teams have more than 10 players. I'd like to show a roster sheet of players and statistics (statistics being goals, assists, penalties, etc)
 jordansissel
on 5 Dec 2017
jordansissel
on 5 Dec 2017
I'm hitting this as well. My use-case is trying to dsiplay a heat-map of temperatures from many different locations over a dynamic but not huge range (i.e., temperature). I have the following:
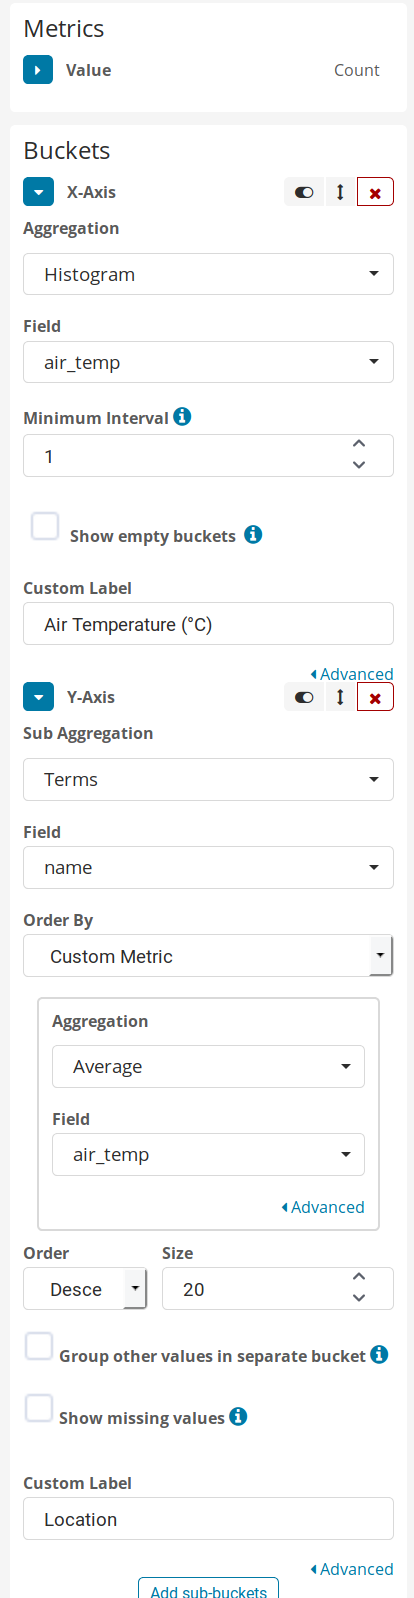
It seems that currently there is no other visualisation on offer to display dense data in a readable fashion?
 joshuar
on 16 Apr 2018
joshuar
on 16 Apr 2018
👍
 alexsanjoseph
on 28 Feb 2019
alexsanjoseph
on 28 Feb 2019
Same issue here: Have 20+ buckets on the y-axis and getting the same message (There are too many series defined). Is there a maximum number of (sub) buckets?
Kibana 6.4.3 here
 tonyskulk
on 7 Mar 2019
tonyskulk
on 7 Mar 2019
Version: 6.5.4
still broken
 magicpotion
on 13 Mar 2019
magicpotion
on 13 Mar 2019
+1,
Version: 6.7.0
 Leaf-Lin
on 4 Apr 2019
Leaf-Lin
on 4 Apr 2019
Can someone specify what the maximums are? You would think the visualization wouldn't let us choose 1000+ max terms if it breaks at 25.
 erikgreif-acc
on 24 Apr 2019
erikgreif-acc
on 24 Apr 2019
Version: 7.1
still broken
 arusanescu
on 18 Jun 2019
arusanescu
on 18 Jun 2019
The number of bucket here is currently limited to 25. We will increase it and make in configureable via Advanced Configuration
 kertal
on 19 Jun 2019
kertal
on 19 Jun 2019
Related issues
 timroes
·
3Comments
timroes
·
3Comments
 socialmineruser1
·
3Comments
socialmineruser1
·
3Comments
 mark54g
·
3Comments
mark54g
·
3Comments
 cafuego
·
3Comments
cafuego
·
3Comments
 ctindel
·
3Comments
ctindel
·
3Comments
Most helpful comment
The number of bucket here is currently limited to 25. We will increase it and make in configureable via Advanced Configuration