Currently, in every Kibana line/bar visualization, you can point the mouse over a chart point, and you get a tooltip giving you the data attached to this point (label + value).
From a UX point of view, this is really useful !
=> That would be great to add such a feature in Timelion visualizations !
 fbaligand
All 22 comments
@fbaligand In timelion when you mouse over the data, the legends show you data values for the data points. Is that not sufficient? What additional data would you like to see in the tooltip?
 tbragin
on 5 Jan 2017
tbragin
on 5 Jan 2017
I know that legend already displays data values.
But from an ergonomic point of view :
- When, with your mouse, you browse the different data points on the line, your eyes have to move to top left to see value and then go back to the data point, and so on for each point. This is not convenient.
- Secondly, as tooltip is not displayed on the concerned data point (and the data point not highlighted), you're not sure if the data value displayed is for one point or the following. Actually, if you are just at the left of a point (and far away also), its value is displayed. But if you are just at the right of the point (even very close), the next data point value is displayed. This is confusing.
- Thirdly, if you draw a simple line (without points), the data points are not easy to localize : no tooltip when you are on one point and current point is not highlighted.
- Finally, this is not coherent with other visualizations : all other visualizations have tooltip feature by default (which can be disabled)
fbaligand
on 5 Jan 2017
From @zharben in https://github.com/elastic/kibana/issues/9587
Are there really no tooltips in this thing? Kibana has them everywhere else - I feel like I'm missing something... The timelion expression language, and the way you've thought this through is amazing - but the visualizations this thing produces are almost useless, because you can't hover over items to identify data point values. I spent the last couple of days getting ES5 set up with our data to use this tool, and now I need to set it aside, because these charts aren't going to give us what we need. I'm happy to contribute if there's a task / PR somewhere for this! (I'm not seeing one).
i didn't realize that the legend is dynamically updated as you hover over time series data. that's an interesting approach - however it gets pretty hard to use when the series is split into many groups.
tbragin
on 6 Jan 2017
Hi,
A very sexy and nice feature should be to have a function as .label() which allows to create tooltip on each timeseries querying information.
For instance:
.es(index=logstach-*, q='affiliateData.website:xyz.com', metric='sum:commission').tooltip(metric=count).tooltip(q='TOP OF PRODUCT').tooltip(list of all commisionned website) ...
 hodiqual
on 19 Jan 2017
hodiqual
on 19 Jan 2017
There is already a timelion function to customize label for each timeseries (or using a regex) in legend.
Up to me, tooltip function should only have a Boolean option to enable/disable it.
fbaligand
on 19 Jan 2017
- In a graph/histogram I would like to know the exact X value at the cursor line.
- For a histogram the range of the histogram bar would be nice to know so that I can judge the height accordingly ( i.e. count per 10 min or 20 ?). I prefer 'auto' interval to handle all scales with one visualization.
- I am also curious about the aggregated value for the whole selected interval - can of course be a separate metric visulisation.
 okvittem
on 24 Feb 2017
okvittem
on 24 Feb 2017
+1
 mehdichilla
on 9 May 2017
mehdichilla
on 9 May 2017
+1
 fotag
on 12 Jun 2017
fotag
on 12 Jun 2017
+1
 alexandreMaif
on 18 Aug 2017
alexandreMaif
on 18 Aug 2017
vote
 mustangxu
on 30 Aug 2017
mustangxu
on 30 Aug 2017
+1
 newarroncoin
on 30 Aug 2017
newarroncoin
on 30 Aug 2017
+1
 oparedes
on 21 Sep 2017
oparedes
on 21 Sep 2017
+1
 nikhilsangvikar
on 12 Oct 2017
nikhilsangvikar
on 12 Oct 2017
At what time did it happen?
Need to know the exact time where the cursor is placed

nop, can not change scale :(
 gbrian
on 24 Jan 2018
gbrian
on 24 Jan 2018
From 6.1, Timelion now shows the readout of the value under the mouse in the legend ((https://github.com/elastic/kibana/pull/14627).
It's not quite a tooltip, but it satisfies the same use-case so I'll close this for that reason.
 thomasneirynck
on 9 Feb 2018
thomasneirynck
on 9 Feb 2018
@thomasneirynck
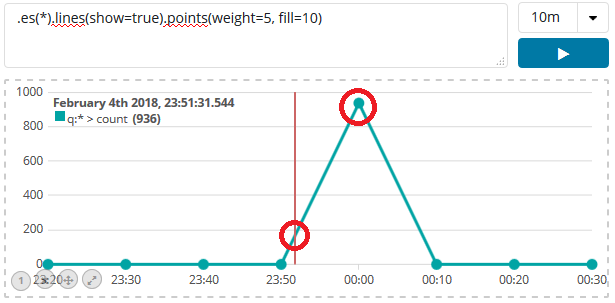
As you can see on this screenshot, this new feature (6.1) does not solve this issue.
The timestamp displayed is not the "current point" timestamp (00:00 for point with count=936), but the cursor location timestamp (23:51), which is a useless information, compared to "current point" timestamp.
=> Could you reopen issue ?
fbaligand
on 15 Feb 2018
thanks @fbaligand, makes sense, thanks for added info
thomasneirynck
on 15 Feb 2018
Thanks for having reopened the issue !
fbaligand
on 15 Feb 2018
Hi @fbaligand @thomasneirynck in the timeline visualization, How did you get display the date and time? Up left "February 4th 2018: 23:51.." What version of kibana implements this?
 TheExorcista
on 29 Mar 2018
TheExorcista
on 29 Mar 2018
In kibana 6.1.0
fbaligand
on 29 Mar 2018
I didn’t do anything special, except move the mouse, so that mouse X position is at this position on x-axis (which represents time)
fbaligand
on 29 Mar 2018
It makes sense, I have a old Kibana version, I'll try to upgrade, thanks a lot !
TheExorcista
on 29 Mar 2018
Related issues
 ctindel
·
3Comments
ctindel
·
3Comments
 timroes
·
3Comments
timroes
·
3Comments
 stacey-gammon
·
3Comments
stacey-gammon
·
3Comments
 bradvido
·
3Comments
bradvido
·
3Comments
 LukeMathWalker
·
3Comments
LukeMathWalker
·
3Comments
Most helpful comment
Hi,
A very sexy and nice feature should be to have a function as .label() which allows to create tooltip on each timeseries querying information.
For instance:
.es(index=logstach-*, q='affiliateData.website:xyz.com', metric='sum:commission').tooltip(metric=count).tooltip(q='TOP OF PRODUCT').tooltip(list of all commisionned website) ...