Kestrelhttpserver: ASP.NET Core (2.0.3) API, works on windows, not on linux?
Hi! I have created a small asp.net core API, which has one endpoint that resolves OpenGraph tags and sends back its results.
You can get the full source code here:
https://github.com/MHamburg/opengraph.api
The problem I am facing:
If I run this asp.net core api locally on a windows 10 machine (not using docker) and I run the attached stress tester, all works great. The stress tester ends correctly and memory usage is constant. (same applies for running a windows docker instance, all works great!)
However, when I use a linux based docker instance and I run the attached stresstester, the docker container will freeze. (as if there is a deadlock happening)
If I run this docker container on Rancher, it will endlessly eat up all memory (as if no garbage collection is being done). (at least it does not freeze)
If I run this web api on linux (without using docker) the instance will eat up all memory in a linear fashion (no GC spotted).
What I have done so far:
Tried to set:
<ServerGarbageCollection>false</ServerGarbageCollection>
Did not change anything
Tried to set a max memory on the docker instance so that the garbage collector knows it is not allowed to use up all memory (which had a bug in asp.net core which was fixed in 2.0.3), but this does not change anything (it will simply crash the container as it will be OOM).
Tried different docker image versions.
(also did numerous unrelated things, that did not resolve this isssue)
To conclude:
On windows or a windows based docker instance (windows container) it works great.
On ubuntu or a linux based docker instance (linux container) it does not work as I hoped it would (OOM and as if the GC is not doing much).
My question:
It is very difficult for me to specify whether or not this is a code related issues (just bad code) or an issue with the linux based version of .net core/kestrel. I would like to know the underlying reason for the observed behavior, which puzzles me. (shouldn't the code run equally good/bad on each environment)
Related issues, that did not resolve my issue:
https://github.com/dotnet/coreclr/issues/14991
https://github.com/dotnet/coreclr/issues/13489#issuecomment-343416765
https://github.com/aspnet/aspnet-docker/issues/300
To run the stresstester:
dotnet .\StressTester.dll "http://localhost:xxxx" where xxxx is the port number assigned to your instance. (You can run it multiple times on linux and it will increase memory usage of the api)
Additional info:
Win 10, dev machine:
Output of dotnet --info
.NET Command Line Tools (2.1.2)
Product Information:
Version: 2.1.2
Commit SHA-1 hash: 5695315371
Runtime Environment:
OS Name: Windows
OS Version: 10.0.16299
OS Platform: Windows
RID: win10-x64
Base Path: C:\Program Files\dotnet\sdk\2.1.2\
Microsoft .NET Core Shared Framework Host
Version : 2.0.3
Build : a9190d4a75f4a982ae4b4fa8d1a24526566c69df
 MHamburg
All 32 comments
Does this repro with the 2.0.4 runtime nightly? I think you might be related to this: https://github.com/dotnet/coreclr/issues/14991.
If it still repros, it might help to capture a memory dump using gcore or similar.
 halter73
on 14 Dec 2017
halter73
on 14 Dec 2017
Actually forget the nightly. 2.0.4 was released yesterday.
halter73
on 14 Dec 2017
We're currently running into the same issue. Our application gets OOM killed by Docker in production. I've also tried running the same application on Docker for Windows (but using Linux containers) and there it seems to respect the cgroup memory limits a lot better. I can get it to get OOM killed if I really push it hard, but its behaviour is clearly different; it doesn't scale its memory use linearly, it sits around 60-70% memory (of its 2 GB limit), bumps up to 95-99% and then it's clear it's doing a collection and falls back to 60-70% again.
Our dotnet --info:
Microsoft .NET Core Shared Framework Host

  Version  : 2.0.4
  Build    : 7f262f453d8c8479b9af91d34c013b3aa05bc1ff
We followed similar steps to the creator of this issue:
- Turn off Server GC, this didn't seem to have an effect
- Upgrade to 2.0.3 (and then to 2.0.4) because issues with cgroups were apparently fixed in that release.
 JulianRooze
on 14 Dec 2017
JulianRooze
on 14 Dec 2017
@halter73 we've been running the nightly for a few days and today upgraded to 2.0.4 stable. It didn't fix this behavior.
JulianRooze
on 14 Dec 2017
@MHamburg how much memory does your host machine/VM have when it OOMs? To me, it seems that the GC thinks it has way more memory than what it is actually limited to, and thus is lazy with its collections. In our case, the host machine has 32 GB of RAM, and the CLR seems to behave as if all of that is available to it, rather than the 2 GB given to it by Docker with --memory=2G.
JulianRooze
on 14 Dec 2017
@JulianRooze From our observation, I do not think this issue is limited to docker. On a Linux VM we experience the same behavior (which is outside of docker, as such I would suggest eliminating docker from the equation as it is currently irrelevant).
The attached app uses no more than +/- 300MB of ram on a windows machine and a windows container. On a Linux VM and a Linux container it uses all the memory available (+/- 6GB).
I can try and test it on a linux VM with 48GB of memory and see if it hits the max as well. It was built as a microservice, as it is a very small API, I do not think these numbers fall under this definition.
@halter73, I will make use of 2.0.4 and check its behavior, I will also try and create a memory dump and report back asap.
MHamburg
on 14 Dec 2017
What does your CacheFactory with 15 days sliding expiration do when its not using Redis? Can the containers/VM contact Redis?
 benaadams
on 14 Dec 2017
benaadams
on 14 Dec 2017
@benaadams. Thank you for your response! For stress testing purposes I switched off redis (by not providing a connectionstring to redis). The instance we have launched on rancher does use redis and this connection works.
As local cache it uses a dictionary handle with a 15 days sliding eviction policy (if not touched by 15 days, remove from cache). The dictionary handle uses a ConcurrentDictionary as cache and retrieves its values via TryGetValue, sourcecode: https://github.com/MichaCo/CacheManager/blob/dcf741131d8139d88234e2b6cfb1ff6daf44808b/src/CacheManager.Core/Internal/DictionaryCacheHandle.cs#L18
If you rerun the stress tester it will basically fetch most of the results from cache (since results are already present). However, results that have an error (such as a HTTP 429 error because it is spamming the source website for metadata) will not be added to the cache and the API will run the normal process. Running the normal process invokes HttpWebRequest.GetResponseAsync(), causing data to be added in memory. However this statement is encapsulated with a using statement: https://github.com/MHamburg/opengraph.api/blob/ed31a6de9d09f3dfe5940f4e3a08853b3968a7e9/OpenGraph/HttpDownloader.cs#L130
MHamburg
on 14 Dec 2017
I was just wondering if the cache was using the memory (e.g. the ConcurrentDictionary having very many entries)
benaadams
on 14 Dec 2017
@MHamburg I'm guessing you were unable to resolve this? I'm seeing a very similar issue with my images as well. One of the things I have noticed is that when on a VM with higher CPU, it uses more mem. I have the same image and container constraints (512mb) running in 2 environments and see the following graphs:
t2.medium
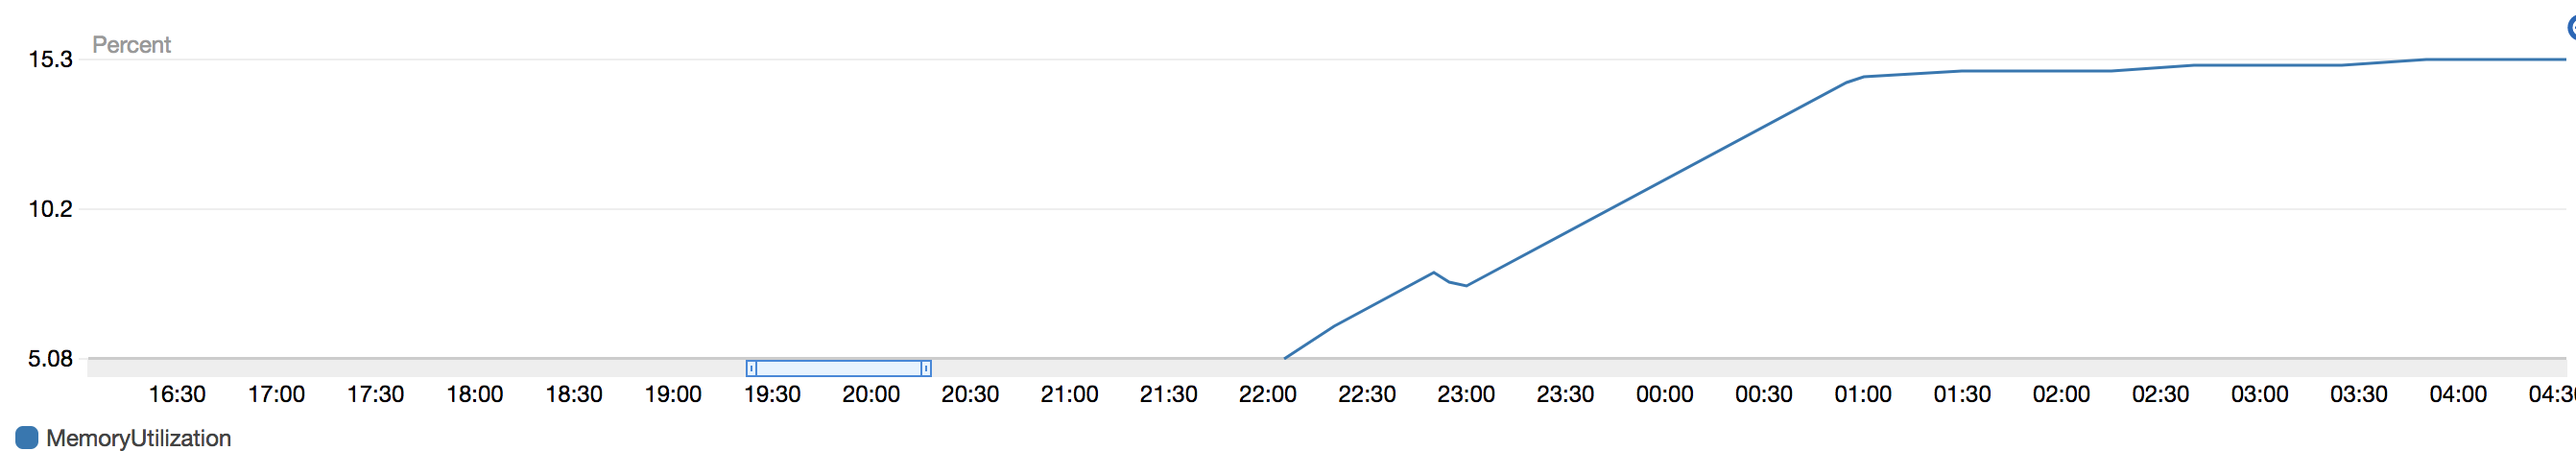
c4.2xlarge
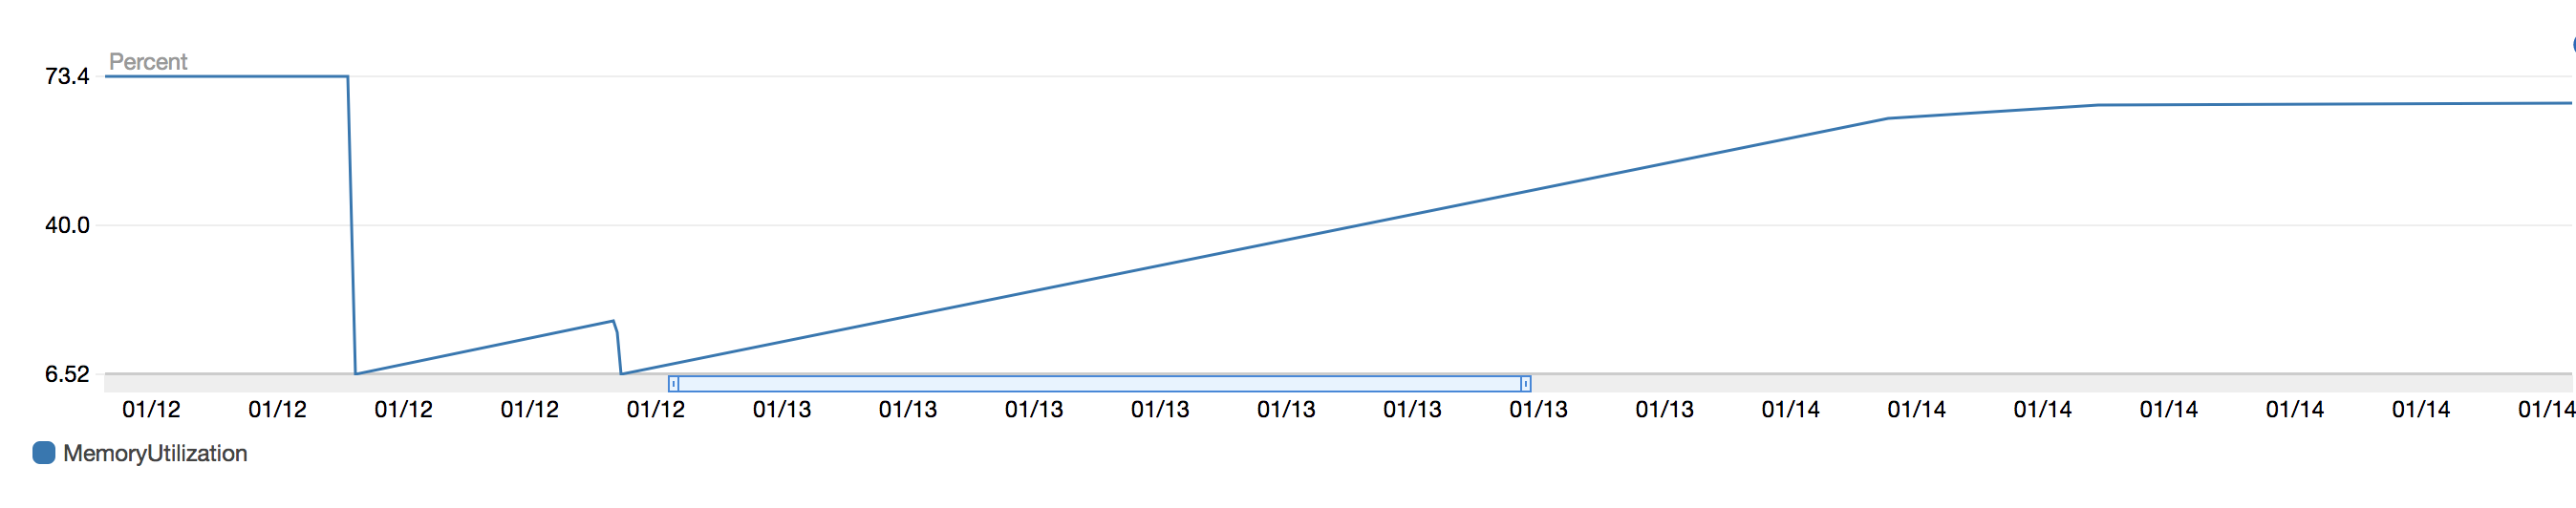
The dips happen on re-deploys, but like you said, it just gets to that % in a linear fashion and stays there. However in the larger VM, we are using a much higher % of memory. Nothing else changes from the container perspective from environment to environment. Just the underlying VM.
Containers are using the aspnetcore:2.0 image, and when running dotnet --info on the container I see 2.0.5
 hartmannr76
on 17 Jan 2018
hartmannr76
on 17 Jan 2018
@hartmannr76, we have not been able to resolve nor pinpoint the exact issue as of yet. We have pushed it back in our backlog and decided to just let it go OOM and reset itself for now.
It is an issue that is discussed more often, but we have not been able to dig in to it for now. (perhaps 2.1 will solve things automagically)
MHamburg
on 17 Jan 2018
How many threads is it using? (as each one is 8MB?)
Running it as 32bit rather than 64bit will decrease the memory usage; not sure if that is an option on Ubuntu
benaadams
on 18 Jan 2018
You can decrease the stack size on Ubuntu by changing the ulimit in the
os... .net just uses the number in there
 Drawaes
on 18 Jan 2018
Drawaes
on 18 Jan 2018
@benaadams on the smaller machine, I'm seeing 21 threads at the moment. Dont have access to the other instance right now, but I'll look when I do.
@Drawaes I can't say I've actually ever played with ulimits before. Do you have any recommendations or guidelines to follow for what they should be set to?
Ideally, I just want to set something that allows dotnet to figure out how much mem it should use vs me doing something like setting the amount of threads directly. Not entirely sure what it bases that decision off of right now (mem, cores, etc.)
hartmannr76
on 23 Jan 2018
We had the exact same issue and fixed it by changing the way we used our HttpClient.
https://aspnetmonsters.com/2016/08/2016-08-27-httpclientwrong/
 TomJannes
on 1 Feb 2018
TomJannes
on 1 Feb 2018
@TomJannes how did you arrive at this solution and the fact that this was the problem? I'm familiar with the issues of HttpClient, but I'm not sure how this would explain memory issues and why this is an issue only on Linux. Is it because on Linux underlying it uses Curl?
JulianRooze
on 1 Feb 2018
@JulianRooze When running in a docker container we noticed that our memory was rapidly growing under a stress test. On windows we did not see this behavior.
When looking at the network info on linux a lot of connections were in a TIME_WAIT state, even after the application was stopped. After implementing a httpclient cache service which is injected as a singleton into the application and adding the following lines
httpClient.DefaultRequestHeaders.ConnectionClose = false;
ServicePointManager.FindServicePoint(url).ConnectionLeaseTimeout = 60 * 1000;
the connections were closed properly and our memory issue disappeared.
Because of this issue i removed windows from my machine and installed linux on it to be able to reproduce the issue, so i don't have enough experience (3 days) to tell you why this behavior is happening.
Our docker container is running stable now using 2 cpus and 2gb ram
My host machine is running ubuntu 16.04
TomJannes
on 1 Feb 2018
For some more context, this service is pretty empty. With the metrics I posted, this system was receiving no load (except from the load balancer which was hitting a healthcheck endpoint that just returns a 200.) The only service I added in it was a SNS service client which spins up as a singleton, so I only have 1 HttpClient in use.
I don't believe that to be the problem @TomJannes
hartmannr76
on 1 Feb 2018
@TomJannes okay, thank you. How many connections are we talking about, dozens, or hundreds?
JulianRooze
on 1 Feb 2018
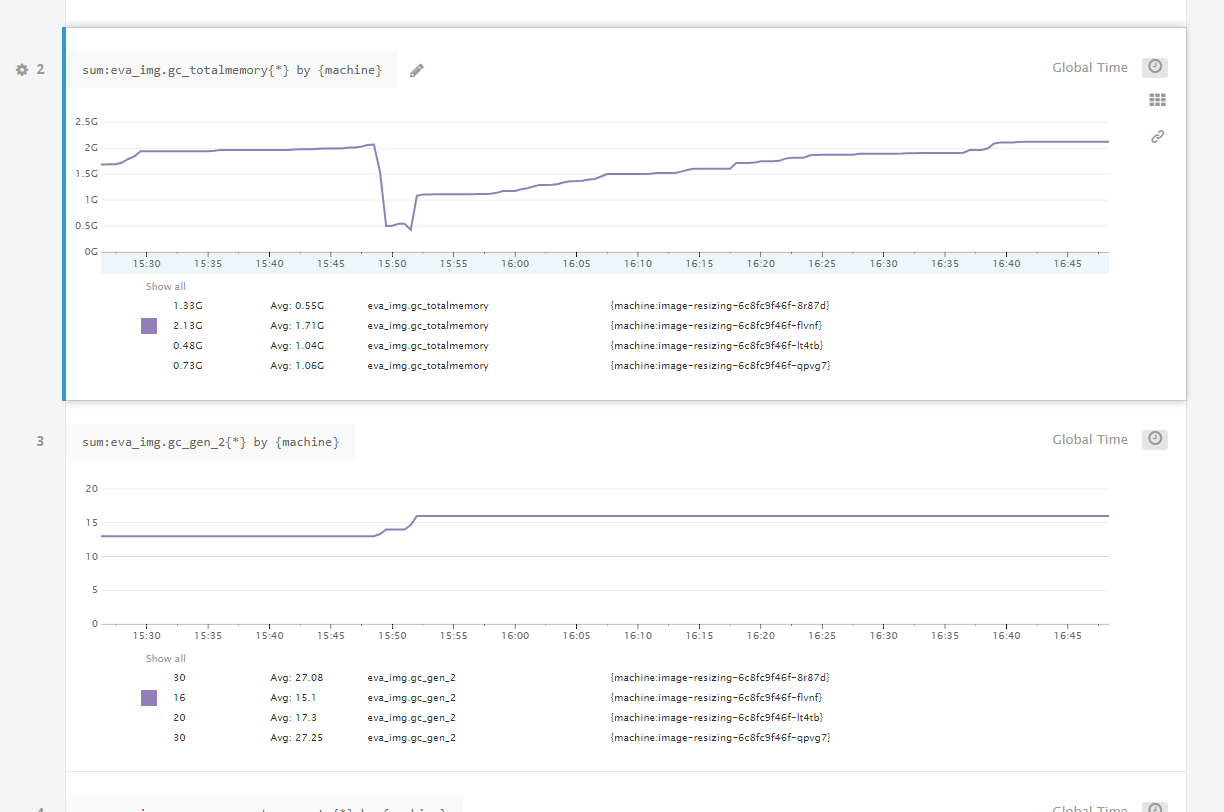
Below some metrics I just collected from one of our applications. This application is a simple image resizing microservice running on ASP.NET Core 2.0.4 inside a container that is responsible for reading in the request body, resizing it with ImageSharp and writing it out to the response body. The kind of behavior we're seeing in production is that this service gets OOM killed by Docker for exceeding its 2 GB memory limit after slowly climbing for a while. When I manually force a Gen2 GC when its memory is high the memory drops steeply (to about 500 MB, which is mostly memory that ImageSharp keeps pooled for reuse). Since this is an image resizing application, most memory will be large arrays that reside in the LOH.
The thing that I feel is happening is that the CoreCLR is lazy in collecting Gen2, almost as if it thinks it still has plenty of memory available. But when it's sitting at 1.8 GB of a 2 GB container limit, it really doesn't. So I would think it would collect sooner, but perhaps the CoreCLR thinks it has all 32 GB of our host VM available and thinks it can delay the expensive Gen2 GC a little longer? I think that when it exceeds the 2 GB limit and gets an OOM that it will force a GC, but what I think happens is that Docker/Kubernetes kills the container before that occurs.
The top image is the total memory usage of the process as reported by polling GC.GetTotalMemory(false) every 10 seconds. The other image is the total number of Gen2 collections that have occurred so far according to GC.GetCollectionCount(2). You can see that it sits at 2 GB for 20 minutes, before doing a Gen2 GC at around 15:50, and then another one shortly after after which it drops to its minimum of 450 MB and then it just allocates for an hour without doing a Gen2 GC (nor 1 or 0 for that matter).
JulianRooze
on 1 Feb 2018
@JulianRooze We had about 70 connections in that state.
I thought we found the issue. Our Httpclients were being cached in a concurrentdictionary in a HttpClientCache class which was added as a singleton into the ms dependency container. However, the httpclients were put into a class variable in the constructor of the consuming services. This gave us locked threads for some reason (only on linux, not on windows) and the application crashed. When we just injected the cache service and requested the httpclients from this singleton in the consuming method (thus without putting it in a class variable) we saw a huge gain in performance and it looked like we solved the memory leak.
After doing a new load test we went from 10 requests per second with a lot of recycles of the docker container to 100 requests per second (peak), 50 requests per second avg (without recycles) however, we still see the memory growing and after about 4 hours at 50 requests per second avg the blocking io in docker stats suddenly starts rising a lot, the memory is at the docker containers limit. (the container was running at 5 cpus with 3 gb of memory).
After taking a dump using gcore i noticed we had a lot of char arrays, it was at the top of our memory usage, we are taling thousands, dont know if this is our app or part of the issue, it seems weird since we don't have any char arrays in our app (not even 1)
I apologize for my bad english, not my mother tongue and my lack of linux knowledge, still working on that :-)
TomJannes
on 2 Feb 2018
@TomJannes no worries, I had no problem reading it, thank you for clarifying! I'd be interested to find out how you made the memory dump and analyzed it. Which guide did you follow? Perhaps we can use the same method. We've tried analyzing the memory usage, but we only got as far as making the dump, but got stuck on LLDB which just exited immediately with a page fault.
JulianRooze
on 5 Feb 2018
@JulianRooze
I used http://codeblog.dotsandbrackets.com/net-core-memory-linux/
I took the dump using gcore and opened it with lldb-3.6 ./dump.nr /usr/share/dotnet/dotnet afterwards i played around using the tutorial linked above and http://blogs.microsoft.co.il/sasha/2017/02/26/analyzing-a-net-core-core-dump-on-linux/
TomJannes
on 6 Feb 2018
@JulianRooze
I was looking through the .net core 2.1 roadmap when i found this: https://github.com/dotnet/corefx/issues/25841 Since i saw a lot of char arrays in my dump i decided to try the work around and this seems to fix my problem. Could you also try this? (i'm running my app on 512mb, 2cpus and in docker stats the memory usage seems stable after running for 40 minutes)
TomJannes
on 6 Feb 2018
@TomJannes Sorry, forgot to reply. Thanks for the info! I do think our issues are fundamentally different, though. Your issue seemed to be memory that was never being released, while our issue seems to be a GC that is reluctant to run (and I'm speculating that it's because it thinks there's still plenty of memory available). But when the GC does run, our memory is cleaned up just fine.
JulianRooze
on 13 Feb 2018
@JulianRooze @TomJannes I am encountering the similar issues. The GC refuses to run but in our case the docker container consumes all of host's memory without an OOM error. It runs without any issues on bare metal.
I managed to fix it by passing --memory when running docker. The GC is forced to run once it hits the container mem limit. Just wondering is there a better solution than artificially limiting memory?
 clouddra
on 26 Feb 2018
clouddra
on 26 Feb 2018
We are also seeing similar issues with our centos server... trying on my local machine, with ubuntu server, memory is being correctly managed.
 diegogvieira
on 7 Mar 2018
diegogvieira
on 7 Mar 2018
@clouddra ... well AFAIK it is the way containers works. If I don't limit memory then an app inside the container gets the host's stats (memory, cpu etc) and if I set the limits (e.g. memory) cgroup aware apps can get the real numbers.
ASP.Net Core is in better situation than Java though. For my Java app I need not only set the exact limits in the start config but also use some tricks (like LXCFS) to mount cgroups aware mem,cpu etc file systems, overwise Java would assume total host resources for its optimizations, memory limits etc.
So I suspect it is not a bug of ASP.Net Core per see ... The other thing to let the Asp app know about limits and when to run GC, but I'm a total noob here .. it seems like it has to be a usual configuration option
 SlyDen
on 8 Mar 2018
SlyDen
on 8 Mar 2018
@SlyDen Thats interesting. To keep populating this thread with context, the production system I am reporting on only has the --memory-reservation flag set. Does GC look at what --memory is set to instead?
I've added some processes in my app to report additional metrics periodically and here are some:
I currently have several containers running so the metrics are an average reported across all of them:
@benaadams I know you were looking for thread counts
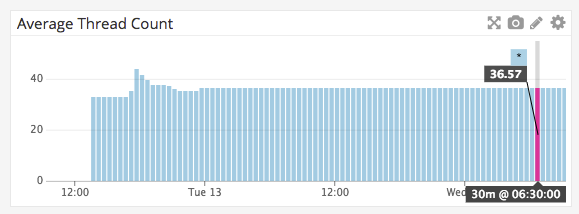
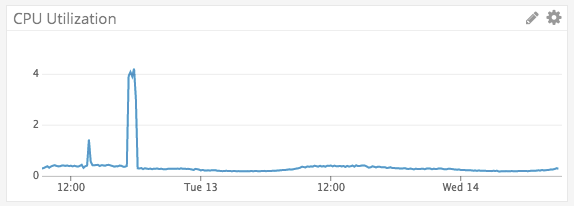
The CPU spike was us sending load to the systems which was 100 concurrent connections handling about 20 requests/sec (communicating with SNS)
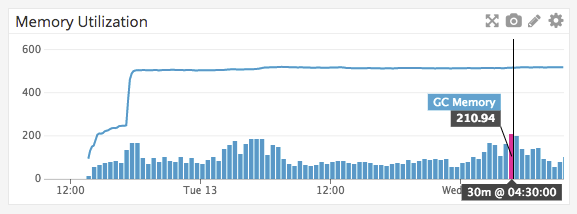
The top line is Process.GetCurrentProcess().WorkingSet64 / 1024 / 1024 so should be MB. Right now hovering around 512 MB. The bars in the graph are GC.GetTotalMemory(false) / 1024 / 1024 so should be GC megabytes recorded.
(collected at 5 second intervals but reporting at 30min intervals) This image is over the course of 2 days so its skewed with our load
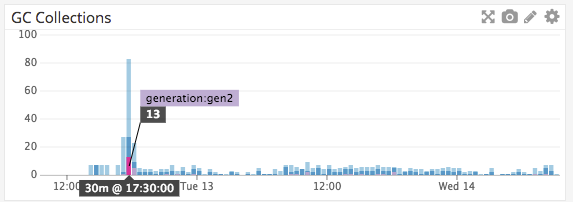
Light blue is Gen0
Dark blue is Gen1
Purple is Gen 2
Normal load of this system looks closer to
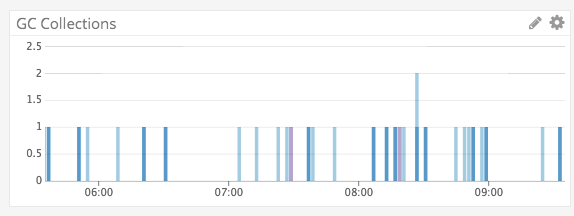
Looking through other threads I can tell that others are playing with some ENV settings around the subject, but I am also very unfamiliar with what these do. Maybe there is documentation somewhere else about how to better tune a .NET Core app for container environments. I guess I was just hoping there wouldn't have to be much tuning out of the box considering this will probably be a default environment for this framework (at least I'd imagine).
I'm going to push a repo up tomorrow with the collection process I use and a local graphite/grafana setup to record metrics as I was only able to replicate this memory issue in linux docker images
hartmannr76
on 14 Mar 2018
@SlyDen Thanks for the explanation! I don't think there is any configuration option we can use (at least not within .csproj). I agree with @hartmannr76 that we need better documentation around container environments. Passing the --memory may not be an option when using managed environments (elastic beanstalk for my case).
clouddra
on 19 Mar 2018
I'm having the exact same issue, running on a locally deployed Kubernetes cluster: any .NET core application we run keeps using more and more memory until eventually it gets killed by K8S with an OOM.
It's happening with docker image 2.0.7.
 labsilva
on 9 May 2018
labsilva
on 9 May 2018
We periodically close 'discussion' issues that have not been updated in a long period of time.
We apologize if this causes any inconvenience. We ask that if you are still encountering an issue, please log a new issue with updated information and we will investigate.
 aspnet-hello
on 24 Sep 2018
aspnet-hello
on 24 Sep 2018
Related issues
 zpodlovics
·
6Comments
zpodlovics
·
6Comments
 NinoFloris
·
8Comments
NinoFloris
·
8Comments
 M-Curtis
·
3Comments
halter73
·
4Comments
M-Curtis
·
3Comments
halter73
·
4Comments
 felschr
·
6Comments
felschr
·
6Comments
Most helpful comment
I'm having the exact same issue, running on a locally deployed Kubernetes cluster: any .NET core application we run keeps using more and more memory until eventually it gets killed by K8S with an OOM.
It's happening with docker image 2.0.7.