Keepassxc-browser: Extension generates 15 - 20% load on CPU per FF instance running, not visible in about:performance
Expected Behavior
Don't use that much CPU resources, it makes it otherwise unusable.
Current Behavior
As I thought this is a FF issue I, asked on reddit for help
https://www.reddit.com/r/firefox/comments/ddav7x/firefox_6902_uses_20_cpu_per_instance_while_6901/
and opened a bug report
https://bugzilla.mozilla.org/show_bug.cgi?id=1586488
Till I realized that this extension is the cause for the high CPU load, while about:performance says KPXC is not actively using any resources.
I really can't say when this problem started.
Possible Solution
Disable the extension
Steps to Reproduce (for bugs)
- Enable the extension
- Watch the load on FF rise to 15 - 20% in the system monitor, can be doubled by starting a second profile in a second instance.
- Disable the extension
- Watch the load drop
Debug info
KeePassXC - Flatpak version 2.4.3
KeePassXC-Browser - 1.5.1
Operating system: Arch
Browser: Firefox
 kaymio
All 24 comments
Haven't seen this kind of behaviour before.
1) Is the FF process the main process, one of the Web Helpers or the WebExtensions process?
2) Is Auto-Reconnect disabled? (This is the only point where something happens in a loop)
3) Does it matter if KeePassXC is started or not?
4) Does the same happen with a new temporary profile?
 varjolintu
on 5 Oct 2019
varjolintu
on 5 Oct 2019
- It's the main process, as htop and gnome system monitor tell me
- If you mean the experimental feature of the extension, it is disabled and has never been enabled
- When I kill KPXC in htop, the load drops and starts up again if
3.1 I restart FF
3.2 I start KPXC back up again AND login (if I don't login it doesn't ramp up)
3.3 I start FF even as KPXC isn't started and verified not running - Yes, it does
kaymio
on 6 Oct 2019
So you aren't using the proxy?
 droidmonkey
on 6 Oct 2019
droidmonkey
on 6 Oct 2019
Yes, I do. Why would you think that I don't?
Need to go to bed. Will answer any questions tomorrow.
kaymio
on 6 Oct 2019
Just confused a little, all good now.
droidmonkey
on 6 Oct 2019
I want to make sure the extension is not doing something. So maybe the background script's (keepass.js) sendNativeMessage() function needs to be set with a breakpoint, just to make sure there aren't some weird messages sent continuously. I cannot think anything else for this behaviour.
varjolintu
on 6 Oct 2019
This message is the only new and odd one, which appears every 2min. Although I don't think it is related. There is no zpool (ZFS) on my system...
Okt 06 09:26:10 x kernel: INFO: task kworker/2:3:290 blocked for more than 491 seconds.
Okt 06 09:26:10 x kernel:       Tainted: G           OE     5.3.1-zen1-1-zen #1
Okt 06 09:26:10 x kernel: "echo 0 > /proc/sys/kernel/hung_task_timeout_secs" disables this message.
Okt 06 09:26:10 x kernel: kworker/2:3     D    0   290      2 0x80004000
Okt 06 09:26:10 x kernel: Workqueue: events __zswap_pool_release
Okt 06 09:26:10 x kernel: Call Trace:
Okt 06 09:26:10 x kernel:  ? __schedule+0x27f/0x710
Okt 06 09:26:10 x kernel:  schedule+0x3e/0x140
Okt 06 09:26:10 x kernel:  z3fold_zpool_destroy+0xe9/0x130
Okt 06 09:26:10 x kernel:  ? wait_woken+0x70/0x70
Okt 06 09:26:10 x kernel:  zpool_destroy_pool+0x5c/0xa0
Okt 06 09:26:10 x kernel:  __zswap_pool_release+0x6a/0xb0
Okt 06 09:26:10 x kernel:  process_one_work+0x1e2/0x3b0
Okt 06 09:26:10 x kernel:  worker_thread+0x5d/0x490
Okt 06 09:26:10 x kernel:  kthread+0x131/0x170
Okt 06 09:26:10 x kernel:  ? rescuer_thread+0x4c0/0x4c0
Okt 06 09:26:10 x kernel:  ? kthread_park+0x80/0x80
Okt 06 09:26:10 x kernel:  ret_from_fork+0x22/0x40
These are the only messages related to KPXC in the journal, each time I en- and disable the extension:
Started flatpak-org.keepassxc.KeePassXC-9158.scope.
flatpak-org.keepassxc.KeePassXC-9158.scope: Succeeded.
Yesterday, I disabled the startup of KPXC and verified that it is not running this morning. The behaviour was reproducible with en- and disabling the ext in FF.
One unrelated question: Why keeps the proxy a few connections to the outside.
kaymio
on 6 Oct 2019
I have really no idea why this happens, and I've never heard or seen it before. zpool makes this even weirder.
The proxy can show some outside connections because of a Firefox bug that transfers sockets to the child process that was launched via Native Messaging API. So the proxy is not actually making any connections outside, even if it looks like it.
varjolintu
on 6 Oct 2019
Also: can you reproduce this problem with any other computer or VM?
varjolintu
on 6 Oct 2019
On my old notebook, I can't reproduce this problem. Though the FF version lags behind with version 69.0.1-0 on Manjaro VS 69.0.2-1 on Arch. The other versions are the same.
It should also be noted that the notebook shows the aforementioned 'fake' connections, while my desktop doesn't, at the moment.
kaymio
on 6 Oct 2019
I also got this problem recently.
With the extension turned on, the load from Firefox is more than 30%.
PC specifications:
- Firefox Version 71.0b9
- KeePassXC-Browser 1.5.3
- Operating System: Manjaro Linux
- KDE Plasma Version: 5.17.3
- KDE Frameworks Version: 5.64.0
- Qt Version: 5.13.2
- Kernel Version: 5.3.12-1-MANJARO
- OS Type: 64-bit
- Processors: 4 × Intel® Core ™ i5-7200U CPU @ 2.50GHz
- Memory: 7.7 GB
 The-invaders
on 3 Dec 2019
The-invaders
on 3 Dec 2019
@The-invaders I assume you also don't have Auto-reconnect enabled? That's the only thing that could run in the background.
EDIT: Can you run your Firefox with strace (for example strace- c so you can see a summary)? It could reveal some things.
varjolintu
on 3 Dec 2019
@varjolintu
Auto-reconnect on/off does not affect the load Imgur
I started as you asked, but I don’t think that this is what you wanted to see.
❯ strace -c firefox-developer-edition

(firefoxdeveloperedition:25646): GLib-GIO-WARNING **: 15:02:52.637: /etc/xdg/kde-mimeapps.list contains a [Added Associations] group, but it is not permitted here.  Only the non-desktop-specific mimeapps.list file may add or remove associations.
EDIT: After closing
% time     seconds  usecs/call     calls    errors syscall
------ ----------- ----------- --------- --------- ----------------
 76,86   80,749331         291    276924           poll
  7,70    8,086561         437     18474           mprotect
  5,32    5,586229         203     27427           write
  4,13    4,340602          36    118811     11768 futex
  3,90    4,096278          13    299547    231404 recvmsg
  1,20    1,260744          21     57965           writev
  0,57    0,600501          19     31595           read
  0,11    0,114591           5     22391         1 madvise
  0,03    0,031696          18      1686           getpid
  0,02    0,024031          13      1750           close
  0,02    0,021308          12      1666           mmap
  0,02    0,016857          15      1106       184 openat
  0,02    0,016608          13      1222           dup
  0,01    0,014569          24       583           munmap
  0,01    0,012782           8      1554       469 stat
  0,01    0,011558          39       295           pread64
  0,01    0,010312        5156         2           wait4
  0,01    0,008887          94        94           clone
  0,01    0,008540           6      1418       115 access
  0,01    0,008214          13       599         1 fcntl
  0,01    0,007137           7       898           clock_gettime
  0,01    0,006235          18       345        12 unlink
  0,00    0,003964          12       330           ftruncate
  0,00    0,003721          38        97           getrusage
  0,00    0,002795          19       143           getrandom
  0,00    0,001979          47        42           socketpair
  0,00    0,001811           3       515        60 lstat
  0,00    0,001655         137        12           readahead
  0,00    0,001170           2       470           fstat
  0,00    0,000371           2       152        70 readlink
  0,00    0,000357          89         4           shmdt
  0,00    0,000344         114         3           rename
  0,00    0,000321          15        21           uname
  0,00    0,000269           4        58           getdents64
  0,00    0,000235           9        25        22 mkdir
  0,00    0,000219          21        10           select
  0,00    0,000200           3        59           lseek
  0,00    0,000160           2        63           rt_sigaction
  0,00    0,000134          67         2           execve
  0,00    0,000106           1        90           fstatfs
  0,00    0,000076          12         6           shutdown
  0,00    0,000067           1        43           getuid
  0,00    0,000061           4        14           gettid
  0,00    0,000058           1        35           geteuid
  0,00    0,000057           7         8           statfs
  0,00    0,000054          27         2           symlink
  0,00    0,000049           1        30           getegid
  0,00    0,000044           1        29           getgid
  0,00    0,000039           5         7           sysinfo
  0,00    0,000038           7         5           brk
  0,00    0,000033           6         5           pipe
  0,00    0,000029           1        20           fadvise64
  0,00    0,000026           2         9           prlimit64
  0,00    0,000024           8         3           rmdir
  0,00    0,000023           1        15         2 recvfrom
  0,00    0,000022           5         4         2 arch_prctl
  0,00    0,000021           5         4           sigaltstack
  0,00    0,000014           2         7           eventfd2
  0,00    0,000013           1         9           inotify_add_watch
  0,00    0,000011           5         2           epoll_ctl
  0,00    0,000010           2         4           umask
  0,00    0,000009           1         9         1 sendto
  0,00    0,000008           2         4           pwrite64
  0,00    0,000008           4         2           getresuid
  0,00    0,000007           2         3           sendmsg
  0,00    0,000007           7         1           inotify_init1
  0,00    0,000006           0        11         5 connect
  0,00    0,000006           3         2           getresgid
  0,00    0,000005           0        11           socket
  0,00    0,000005           1         5           setpriority
  0,00    0,000004           0         5           getpriority
  0,00    0,000003           1         2           rt_sigreturn
  0,00    0,000002           1         2           getsockopt
  0,00    0,000002           0         3           getcwd
  0,00    0,000002           1         2           sched_getaffinity
  0,00    0,000001           0         3           getsockname
  0,00    0,000001           0         2           setsockopt
  0,00    0,000000           0         6           rt_sigprocmask
  0,00    0,000000           0         4         2 ioctl
  0,00    0,000000           0         1           dup2
  0,00    0,000000           0         3         1 getpeername
  0,00    0,000000           0         2           fdatasync
  0,00    0,000000           0         1           getppid
  0,00    0,000000           0         1           getpgrp
  0,00    0,000000           0         1         1 prctl
  0,00    0,000000           0         1           set_tid_address
  0,00    0,000000           0         1           clock_getres
  0,00    0,000000           0         1           set_robust_list
  0,00    0,000000           0         1           pipe2
  0,00    0,000000           0         1         1 seccomp
  0,00    0,000000           0         1           memfd_create
------ ----------- ----------- --------- --------- ----------------
100.00  105,054227                868801    244121 total
True, that didn't really help. Is the CPU load visible even after browser launch when idling?
varjolintu
on 3 Dec 2019
"after browser launch when idling?" - it means after starting through the console using the command strace -c firefox-developer-edition?
Yes, the processor is loaded and this can be seen in the system monitor

The-invaders
on 3 Dec 2019
@varjolintu
I found the problem, the thing is flatpak.
When I used the application from AUR there were no problems.
After I installed the application using the flatpack, the load problems started.
_The reason I used the flatpack is because the AUR does not have an up-to-date version of the application._
But snap cannot be used because it is not able to integrate with the browser (I tried it too, the CPU load is not present, but there is no integration.)
I installed the application from AUR again and everything works fine (but version 2.5.0-2, yes)
The-invaders
on 3 Dec 2019
Interesting. I will link this issue to the Flatpak repo. Maybe they know better where the issue possible is.
You can use snap version of KeePassXC with the helper script. It helps to enable the browser integration.
varjolintu
on 3 Dec 2019
Maybe this is the same.
I get this kind of warning all the time. I can hear the fan of my laptop spinning up.

This typically happens to me while doing Kibana searches. It's when the response gets back from Elasticsearch that it starts to get slow. If I hit "Stopp KeepassXC" the result is rendered immediately.
I have now disabled the advanced option to automatically identify input fields:

So far I'm getting a far better experience.
Edit: With some more testing I still get it, so that was not it.
System
Lenovo t470p with i7-7820HQ and 32 GB RAM
KeePassXC-Browser Version: 1.6.3
KeePassXC Version: 2.3.1
Firefox 76.0.1
 cbarreholm
on 19 May 2020
cbarreholm
on 19 May 2020
@cbarreholm You can also add the site to Site Preferences in the extension settings and choose _Disable all features_ from the combo box. Check if that helps.
varjolintu
on 19 May 2020
Unfortunately, it didn't help.
Trying to use the FF developer tools to try to understand where the time is spent. But new to what I can do there.
Note that the Kibana tab is notoriously big, currently using 650 MB of memory. So maybe it's a general issue with "large" pages?
cbarreholm
on 20 May 2020
I'm quite sure this is related to the dynamic input field detection (MutationObserver). Does it help any further if you disable the icons?
varjolintu
on 20 May 2020
I'm not having any issues with multiple Kibana tabs in Chrome, which stay open for weeks, so it's not big tabs per se.
 phoerious
on 20 May 2020
phoerious
on 20 May 2020
Disabled the icons without any difference.
@phoerious Have you tried Firefox?
This is a screenshoot of the performance recording. It feels like it hangs after 3-4 seconds. Then for roughly 70s it does nothing but GC. And the warning about KeepassXC script is shown.
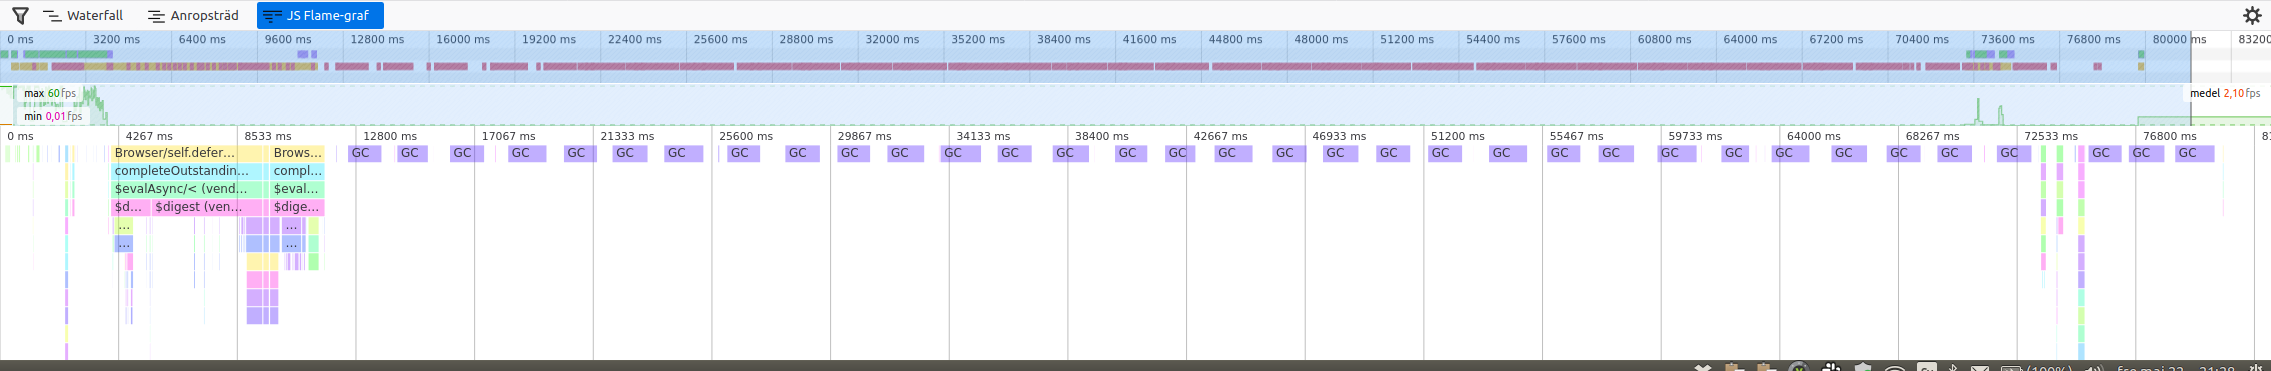
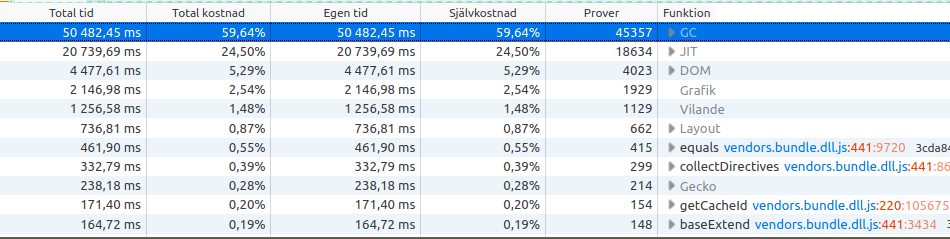
This is what it looks like when disabling the KeepassXC plugin
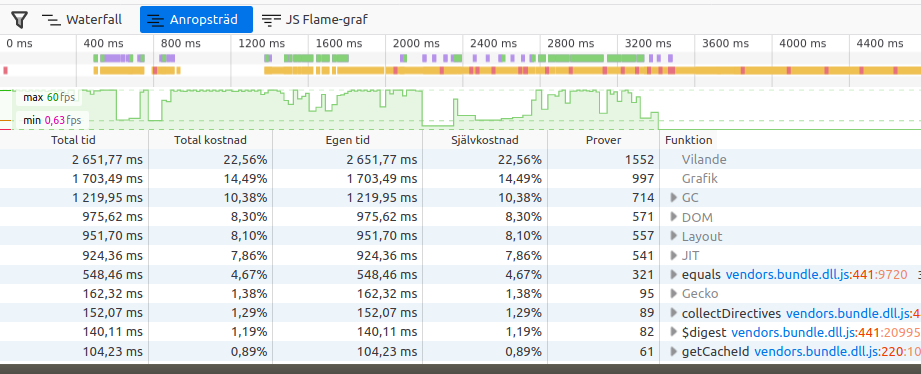
"Vilande" = "Sleep"
cbarreholm
on 22 May 2020
There is a patch that might help: #920
 mestaritonttu
on 30 Jun 2020
mestaritonttu
on 30 Jun 2020
Related issues
 mrmeszaros
·
3Comments
mrmeszaros
·
3Comments
 flibustenet
·
4Comments
flibustenet
·
4Comments
 metaxis
·
3Comments
metaxis
·
3Comments
 Ana06
·
4Comments
Ana06
·
4Comments
 christophetd
·
4Comments
christophetd
·
4Comments