Katib: Unable to scale to large number of concurrent Katib Experiments / Trials
/kind bug
What steps did you take and what happened:
We launched 120 Katib Experiments simultaneously, each configured with Parallel Trial Count: 30. While monitoring the cluster via kubectl -n kubeflow get pods | grep -v Completed | wc -l, we saw no more than 160 pods running concurrently.
What did you expect to happen:
We expected 120 * 30 = 3600 pods to be running concurrently, or as close to that as our cluster resources would allow.
Anything else you would like to add:
- This was run using the
v1alpha3version of Katib - Each individual trial is very short-running (approximately 30 seconds)
The pod running the
katib-controllerdid not exceed 25% CPU utilization, so it wasn't obviously underwater trying to reconcile all of the Trials.It took a long time for the
Trialobjects to reachCreatedstate- It took a long time for
Createdtrials to launch aJobobject - Once the Job object was created, the pod was created shortly thereafter and the task ran successfully.
- All Katib Trials / Experiments did eventually complete successfully.
Since both of those slow steps are handled by the ReconcileTrial.Reconcile, it makes me think that the delay is somehow related to the trial-controller not receiving Trials to reconcile on a fast enough cadence? Do you agree with that assessment and have any ideas on how to troubleshoot ?
Thank you for your help !
Environment:
- Kubeflow version (
kfctl version): - Minikube version (
minikube version): - Kubernetes version: (use
kubectl version):
Client Version: version.Info{Major:"1", Minor:"16+", GitVersion:"v1.16.6-beta.0", GitCommit:"e7f962ba86f4ce7033828210ca3556393c377bcc", GitTreeState:"clean", BuildDate:"2020-01-15T08:26:26Z", GoVersion:"go1.13.5", Compiler:"gc", Platform:"darwin/amd64"}
Server Version: version.Info{Major:"1", Minor:"15+", GitVersion:"v1.15.12-gke.2", GitCommit:"fb7add51f767aae42655d39972210dc1c5dbd4b3", GitTreeState:"clean", BuildDate:"2020-06-01T22:20:10Z", GoVersion:"go1.12.17b4", Compiler:"gc", Platform:"linux/amd64"}
- OS (e.g. from
/etc/os-release):
 sm-hawkfish
All 9 comments
Issue-Label Bot is automatically applying the labels:
| Label | Probability |
| ------------- | ------------- |
| area/katib | 0.92 |
Please mark this comment with :thumbsup: or :thumbsdown: to give our bot feedback!
Links: app homepage, dashboard and code for this bot.
![issue-label-bot[bot] picture](https://avatars.githubusercontent.com/in/27079?v=4&s=40) issue-label-bot[bot]
on 5 Sep 2020
issue-label-bot[bot]
on 5 Sep 2020
Issue-Label Bot is automatically applying the labels:
| Label | Probability |
| ------------- | ------------- |
| area/katib | 0.92 |
Please mark this comment with :thumbsup: or :thumbsdown: to give our bot feedback!
Links: app homepage, dashboard and code for this bot.
issue-label-bot[bot]
on 5 Sep 2020
For a concrete example, here is the status subresource from a completed trial:
status:
  completionTime: "2020-09-05T01:08:01Z"
  conditions:
  - lastTransitionTime: "2020-09-05T00:35:06Z"
    lastUpdateTime: "2020-09-05T00:35:06Z"
    message: Trial is created
    reason: TrialCreated
    status: "True"
    type: Created
  - lastTransitionTime: "2020-09-05T01:08:01Z"
    lastUpdateTime: "2020-09-05T01:08:01Z"
    message: Trial has succeeded
    reason: TrialSucceeded
    status: "True"
    type: Succeeded
A couple of notes:
- The suggestion service responded with the param assignments at
2020-09-04 19:58:54.677 EDT, which I believe coincides with when theTrialresource itself was created. - 35 minutes later, the status sub-resource is updated to
TrialCreated - 15 minutes after that, the
trial-controllerprinted the log"Creating Job"at2020-09-04 20:52:10.599 EDT - The pod starts running very shortly after at
2020-09-04 20:52:15.794 - The
statussub-resource is never updated toTrialRunning - The pod completes at
2020-09-04 20:52:38.979 EDT(around 40 seconds total runtime) - Around 15 minutes after the pod completed, the
statussub-resource is updated toTrialSucceeded
The delays in the status sub-resource update (and even missing the TrialRunning status) suggest that either:
- The reconcile queue is backed up (any idea how to check this ?)
- The Trials are hitting some kind of rate limit where they are being requeued after a long delay
It seems that both of these are addressable by setting either MaxConcurrentReconciles or RateLimiter when creating the trial controller.
My inclination is to think that it's the first issue (and so would think MaxConcurrentReconciles is something worth exploring), however I don't want to rule out it's due to an exponential backoff in requeue time, as described in this issue .
I would love some feedback from a core contributor who is much more familiar with the codebase and kubernetes controllers 🙏
sm-hawkfish
on 6 Sep 2020
Thank you for reporting this @sm-hawkfish. Few questions:
- Which algorithm have you run?
- Do you have any errors in Katib controller?
- Do you have any warnings in your Kubernetes node pool ?
/cc @johnugeorge @gaocegege
 andreyvelich
on 9 Sep 2020
andreyvelich
on 9 Sep 2020
Hi @andreyvelich , thanks for following up.
I am running the
tpealgorithm. I don't think this is the root cause, as theTrialobjects themselves are getting created no problem (with valid hyperparameter sets), it's just that the Trials do not quickly move intoCreatedorRunningstateEvery once in a while the
katib-controllerwill display an error like:
{"level":"error","ts":1600121714.1960201,"logger":"experiment-controller","msg":"Update experiment instance status error","Experiment":"kubeflow/train-model-9xxr5-4096704416","error":"Operation cannot be fulfilled on experiments.kubeflow.org \"train-model-9xxr5-4096704416\": the object has been modified; please apply your changes to the latest version and try again" ...}
But they are infrequent and I would expect a subsequent reconcile to resolve the issue
- Can you advise on what I should run in order to check that ? Scanning
kubectl -n kubeflow get eventsdoesn't show anything too suspicious regarding the nodepool (aside from the occasional node being added to the nodepool by the autoscaler)
I installed prometheus in the cluster so that I could better track the katib-controller metrics and saw these suspicious spikes in the trial-controller reconcile queue:
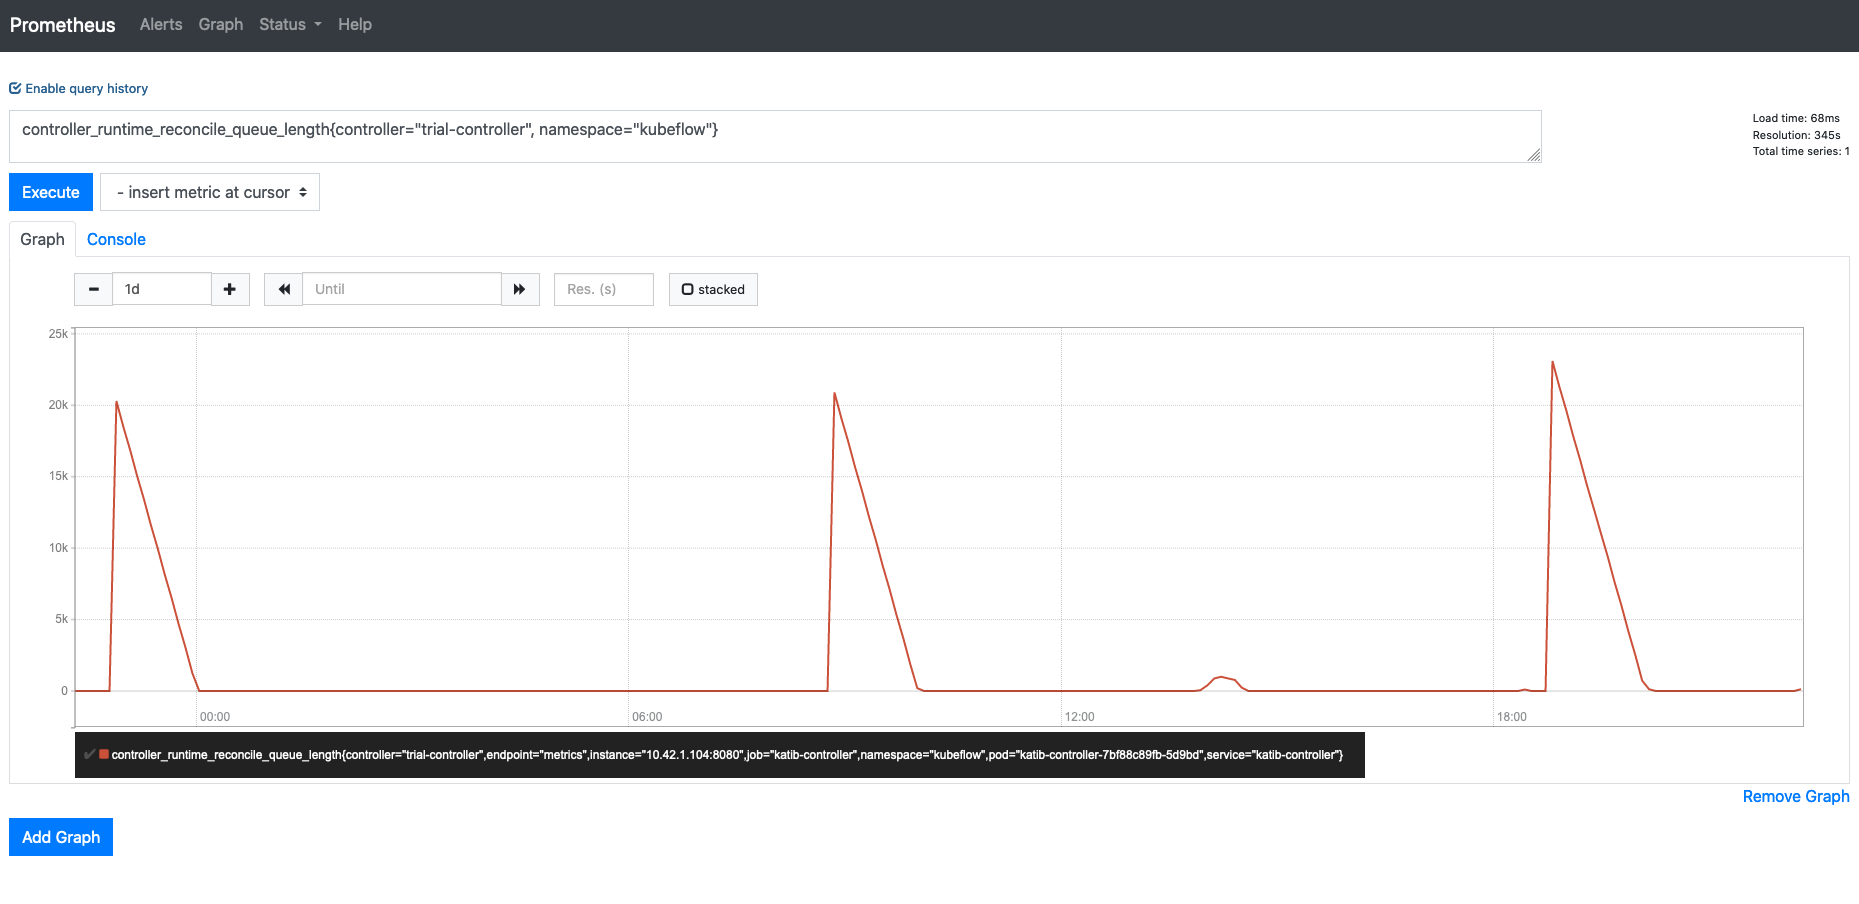
Those spikes are occurring every 10 hours and are queuing around 24k trials, which is the total number of trials that have run in the cluster. Is there some setting that re-reconciles every trial on this cadence? Should I be deleting completed trials periodically ?
Regardless, I don't think those spikes are the root cause of the problem, just something that compounds it. I will submit several experiments and monitor the katib-controller metrics and report back.
sm-hawkfish
on 15 Sep 2020
We just kicked off 12 concurrent experiments, each with parallelTrialCount of 10. Here are some Prometheus snapshots showing that the trial-controller in particular seems to be struggling to keep up:
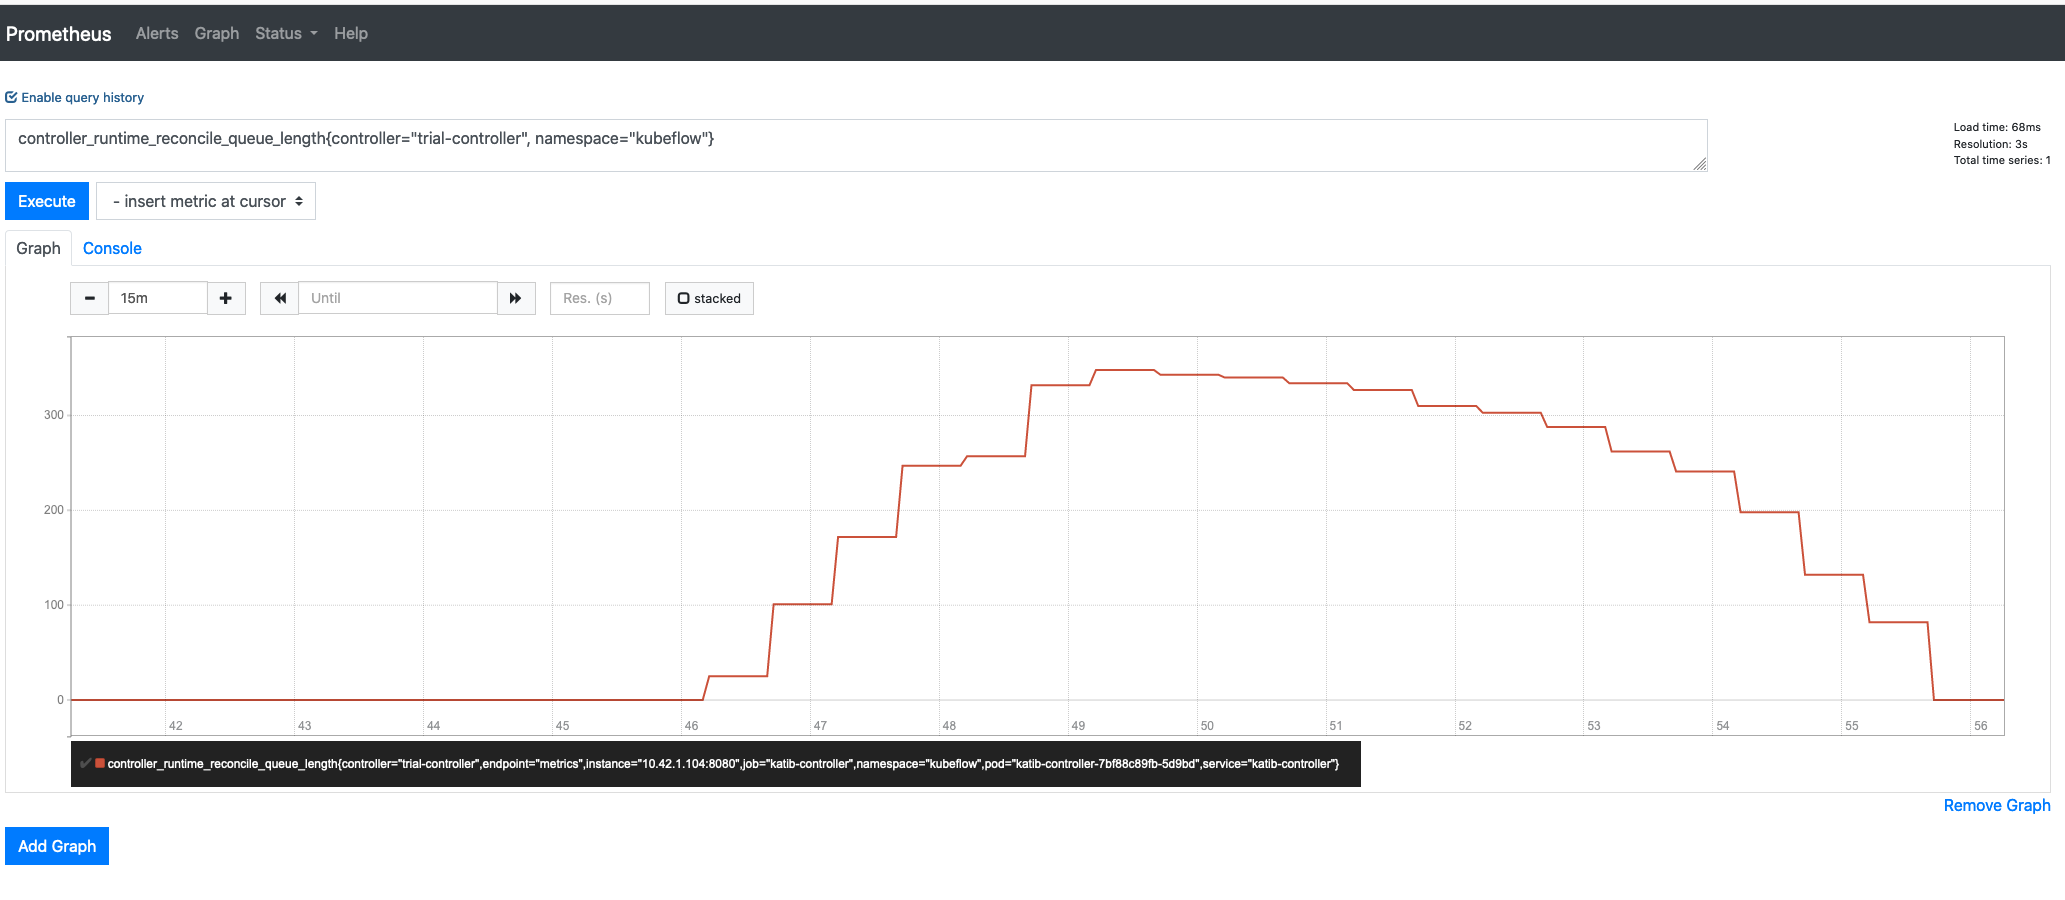
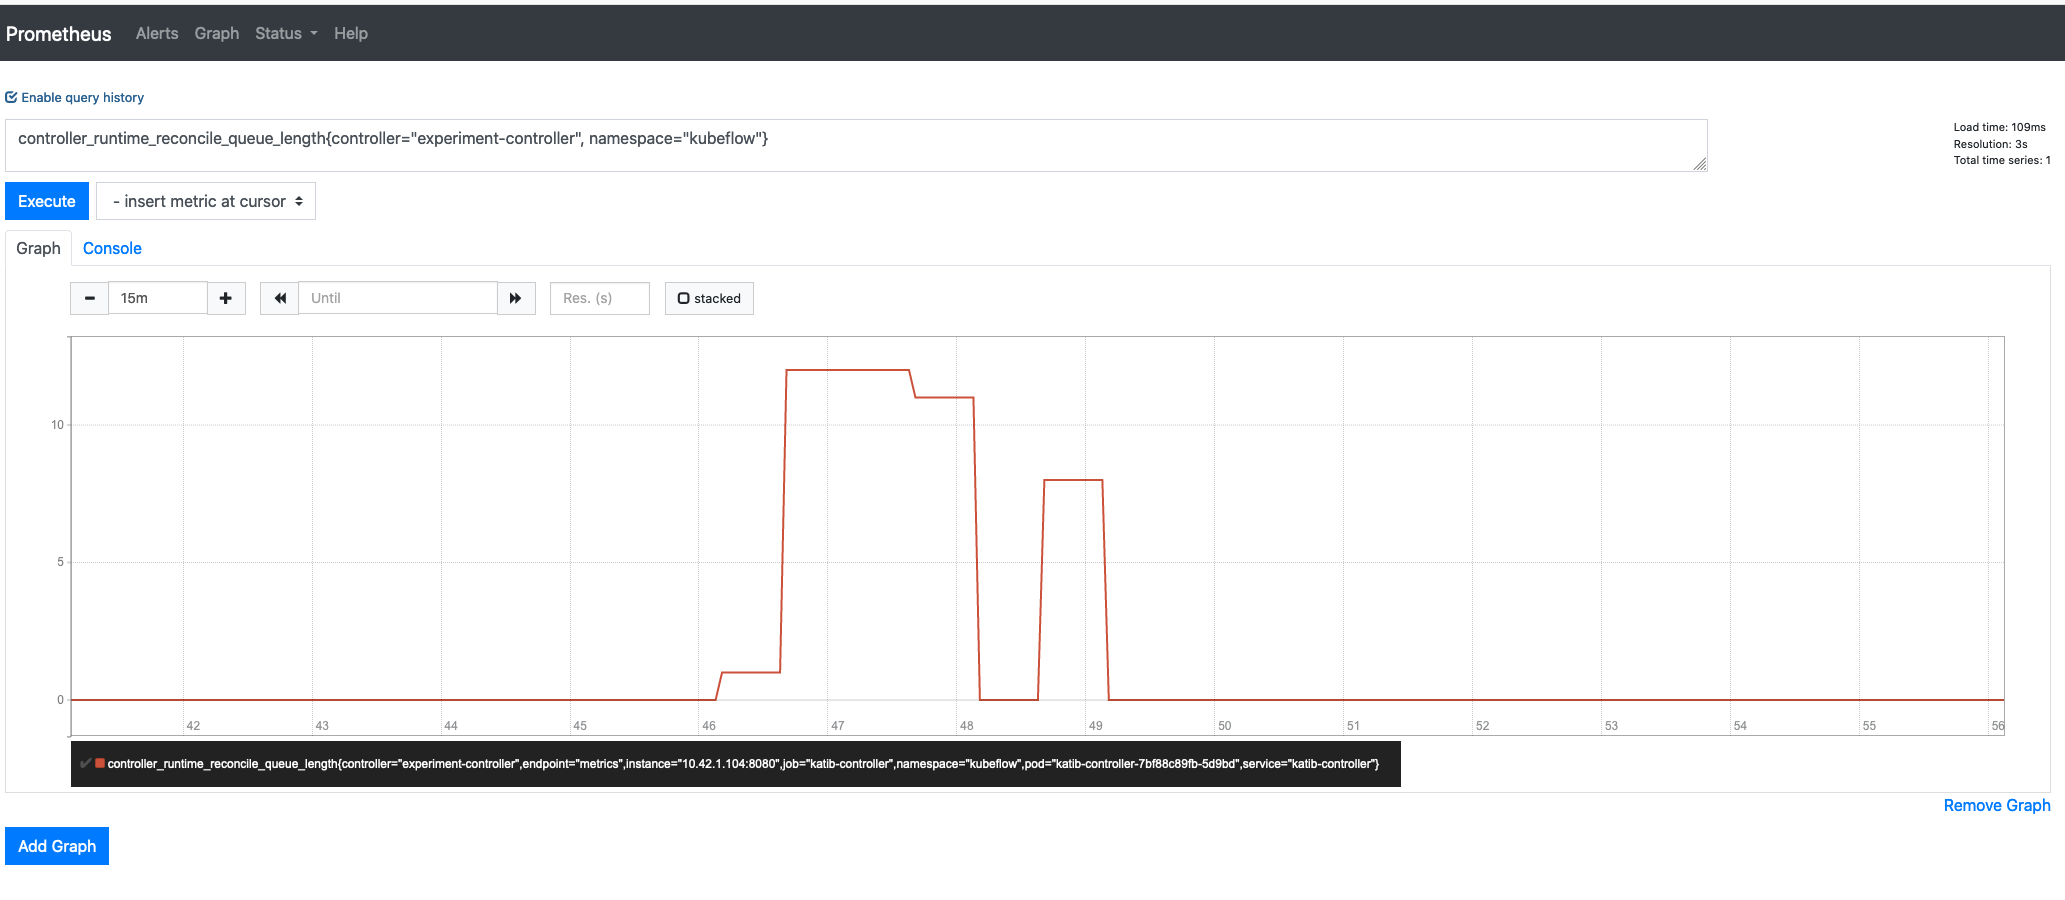
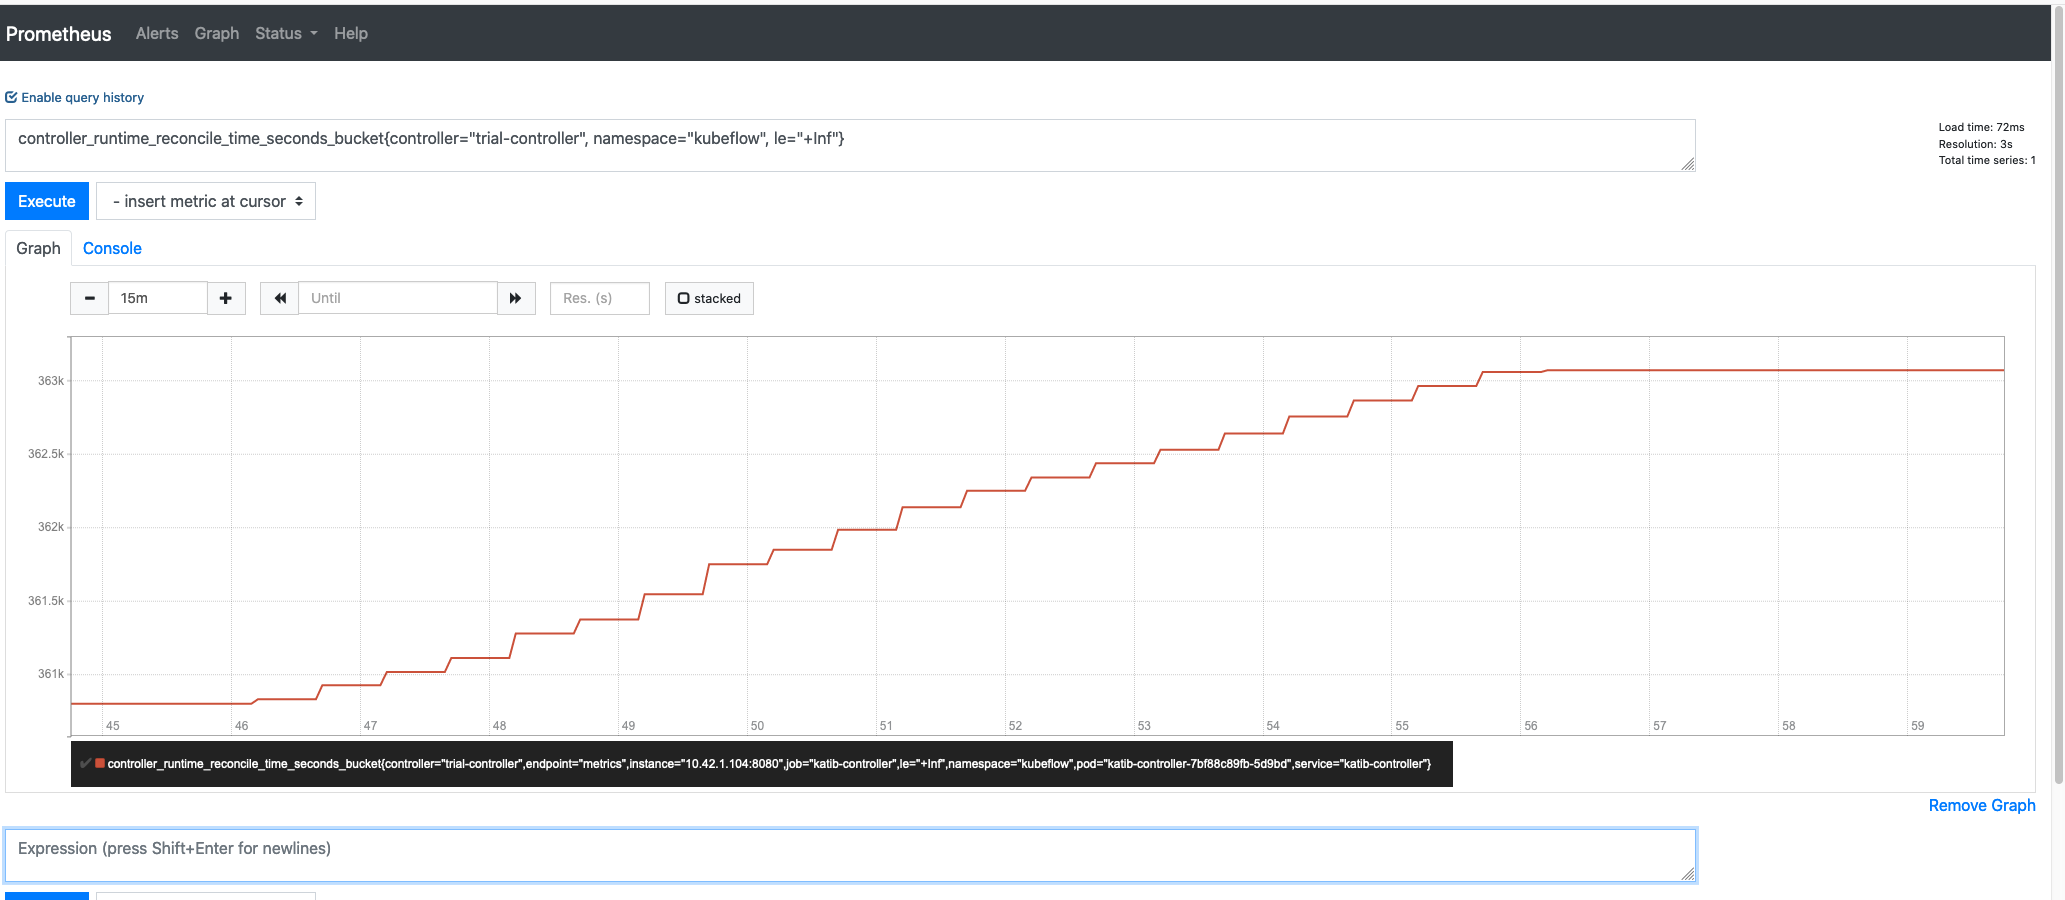
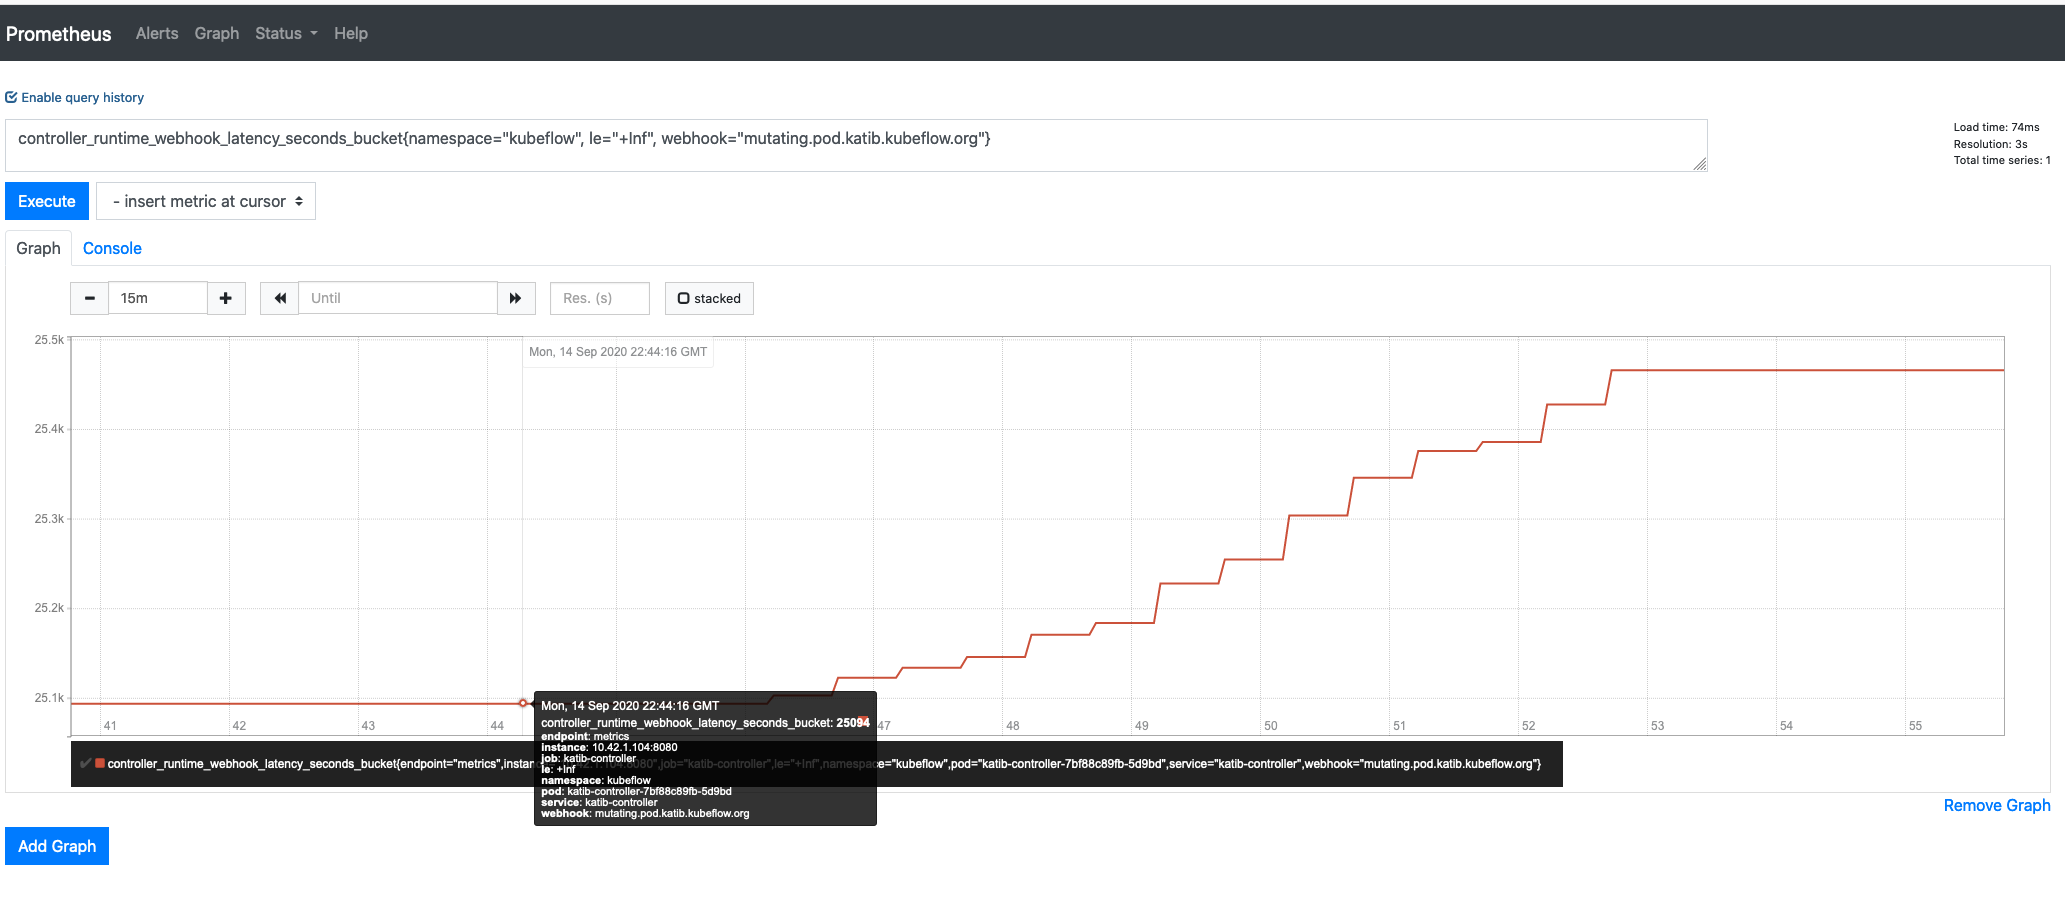
Are there any other metrics that you would like to see? I am happy to help brainstorm some ways to improve the throughput of the katib-controller, if you think this a type of use-case that should be supported.
sm-hawkfish
on 15 Sep 2020
@sm-hawkfish You can try to run: kubectl describe nodes to see if your nodes have any warnings.
So katib-controller hasn't restarted during this run, right ?
Those spikes are occurring every 10 hours and are queuing around 24k trials, which is the total number of trials that have run in the cluster. Is there some setting that re-reconciles every trial on this cadence? Should I be deleting completed trials periodically ?
Basically, controller reconciles only experiment's trial to get optimal HP.
Once you deleted experiment it is better to wait until all Trial resources will be deleted before submitting new experiment.
Controller clean-up mysql DB once trials are deleted.
Trials are created here, maybe we can verify how much time Experiment controller spends between Reconcile Suggestion and create Trials ?
andreyvelich
on 15 Sep 2020
This issue has been automatically marked as stale because it has not had recent activity. It will be closed if no further activity occurs. Thank you for your contributions.
![stale[bot] picture](https://avatars.githubusercontent.com/in/1724?v=4&s=40) stale[bot]
on 19 Dec 2020
stale[bot]
on 19 Dec 2020
This issue has been automatically closed because it has not had recent activity. Please comment "/reopen" to reopen it.
stale[bot]
on 10 Jan 2021
Related issues
 yeya24
·
6Comments
yeya24
·
6Comments
 kylepad
·
7Comments
kylepad
·
7Comments
 ffeelers
·
4Comments
ffeelers
·
4Comments
 jlewi
·
5Comments
jlewi
·
5Comments
 gyliu513
·
6Comments
gyliu513
·
6Comments