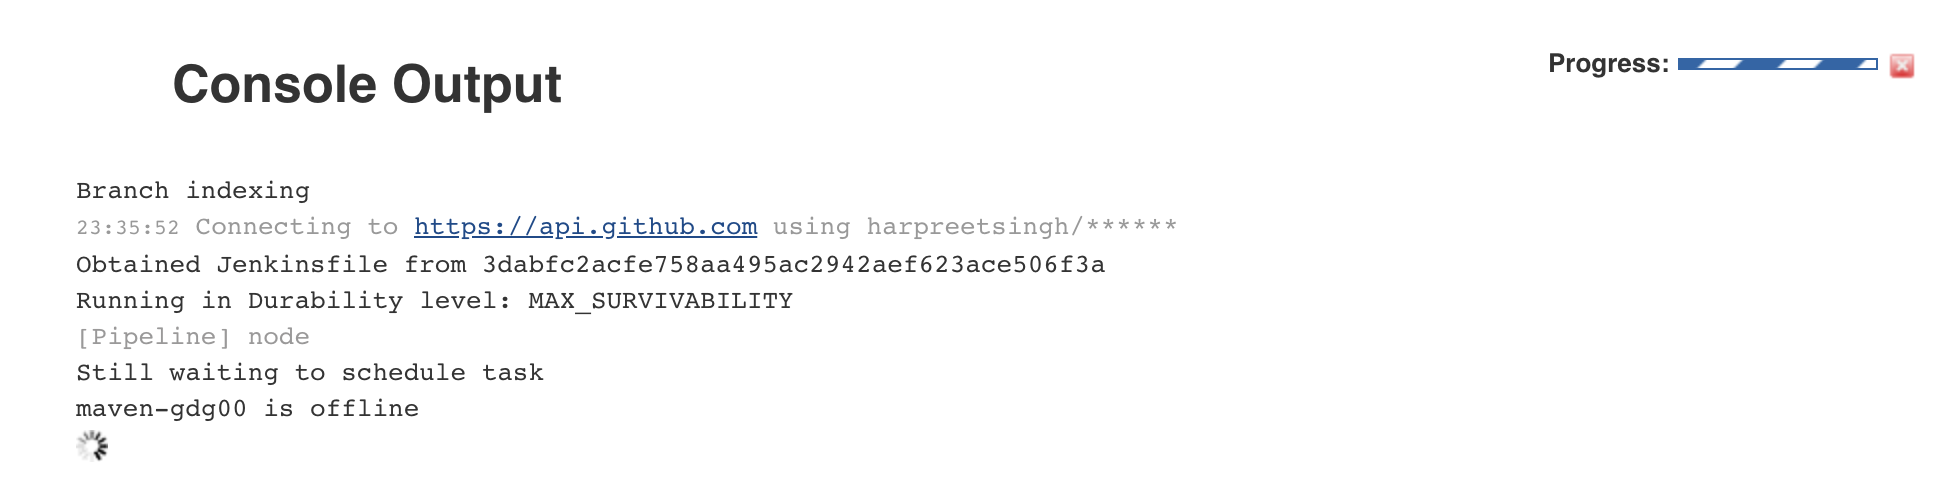
Jx: Pipeline hung waiting because maven is offline
Steps to reproduce:
- Install jenkins-x on a new gke cluster through cluster create;
- jx create spring -d web -d actuator; command returned
Opened jenkins job and found that it had hung.
 harpreetsingh
All 7 comments
I wonder if it did eventually come up? Starting a maven build pod means the node kubernetes schedules it to run on needs to pull the image which can take some time but on GKE only a couple of mins max.
So perhaps it's something else, maybe there's not enough resources in the cluster to schedule the maven build pod. Right now there's no easy way to find out other than using the maven pod name at the bottom of the log in the screenshot or running:
kubectl get pods
find the maven build pod
kubectl describe pod [maven build pod id]
This should show some 'events' that should explain why the pod isn't starting.
__notes__ we need to provide an easy way to know why a build pod cant start. Even if to start with it's a link in the jenkins console log to an FaQ.
 rawlingsj
on 17 Mar 2018
rawlingsj
on 17 Mar 2018
as a side note a big +1 for the issue - thanks @harpreetsingh
rawlingsj
on 17 Mar 2018
agreed - we need some way to warn the user if a pipeline can't start.
Incidentally as part of #412 the jx create spring, jx create quickstart and jx import commands now output the info text:
Note that your first pipeline may take a few minutes to start while the necessary docker images get downloaded!
as even when everything is working perfectly, it can take a few minutes for the first pipeline to start.
 jstrachan
on 19 Mar 2018
jstrachan
on 19 Mar 2018
jx logs jenkins should show the jenkins logs which might include any errors if build pods cannot be created - e.g. due to lack of resources or underlying kubernetes issues
jstrachan
on 19 Mar 2018
Have the same hanging maven build pod when running jx on minikube.
kubectl describe pod maven-qx7hv reports ->
Events:
  Type     Reason            Age               From               Message
  ----     ------            ----              ----               -------
  Warning  FailedScheduling  3s (x7 over 34s)  default-scheduler  0/1 nodes are available: 1 Insufficient cpu.
If thats the root cause it would be nice to surface the problem using jx
 pax95
on 26 Apr 2018
pax95
on 26 Apr 2018
We have a jx status command that helps identify resource issues too BTW. Ideally we'd tie in prometheus alerts and get notifications for low resources too.
rawlingsj
on 26 Apr 2018
I think this can be closed now. The recommended initial cluster size is better now, we also enable cluster autoscaling where possible and provide a jx status command to help identify this situation. Please reopen if there's more we can do here.
rawlingsj
on 9 Jun 2018
Related issues
 tdcox
·
3Comments
jstrachan
·
4Comments
tdcox
·
3Comments
jstrachan
·
4Comments
 ipv1337
·
3Comments
ipv1337
·
3Comments
 vgallissot
·
5Comments
vgallissot
·
5Comments
 sourabhg
·
4Comments
sourabhg
·
4Comments
Most helpful comment
as a side note a big +1 for the issue - thanks @harpreetsingh