Jupyterlab: Switching to a big notebook in a tab is slow
I am using Ctrl + Shift + ] to switch between tabs that I am using. It is slow when I am switching to a tab which is a jupyter notebook which is larger in size. I noticed that if I split my screen to have both already rendered then the switching is fast. This leads me to think that it is the browser rendering which is slowing things down. Not sure if this observation helps but maybe some form of caching rather than re-rendering the notebooks might make the switching faster?
 anshbansal
All 68 comments
I have a habit of writing long notebooks with table of contents etc and I noticed the same issue... makes working with Jupyterlab quite cumbersome. FYI this does not happen with Jupyter Notebooks.
 harpone
on 25 Apr 2018
harpone
on 25 Apr 2018
Are you using Firefox?
 sccolbert
on 25 Apr 2018
sccolbert
on 25 Apr 2018
It is Google Chrome
anshbansal
on 25 Apr 2018
Ok thanks. With regard to your comment about caching/re-rendering, unfortunately the browser doesn't give us that much control. We know we have a perf problem on FF due to how we're nesting flexboxes. We have plans to fix this for 1.0. Hopefully that corrects this issue as well.
sccolbert
on 25 Apr 2018
same here,
JupyterLab 0.33.8 lagging when switching tabs,
but Jupyter Notebook 5.0.0 working without issues
Chrome, Version 68.0.3440.106 (Official Build) (64-bit)
Mac OS Sierra 10.13.1
 mladenj
on 16 Aug 2018
mladenj
on 16 Aug 2018
Same here.
I acknowledge that some of my notebooks are very large. Switching tabs take about 18 seconds. The same notebook switching on Jupyter Notebook 5.0 (regular Firefox tabs) is fast, although take a lot of memory.
Mozilla Firefox 61.0.1
Kubuntu 16.04
 webermarcolivier
on 4 Sep 2018
webermarcolivier
on 4 Sep 2018
Same here. Mac OS, Safari.
Switching one big notebook to another under same Jupyter lab page takes around 5 s. This 5 s really gives bad user experience.
 YubinXie
on 4 Sep 2018
YubinXie
on 4 Sep 2018
Same here,
- JupyterLab 0.34.7
- Chrome 68.0.3440.106 (64-bit)
- Windows 10
 7kbird
on 6 Sep 2018
7kbird
on 6 Sep 2018
Same problem on Windows with Chrome and Firefox. This really undermines the beautiful new feature of having everything in one browser window. Also reshuffling tabs that are large is suffering from this performance issue.
 bjonen
on 12 Sep 2018
bjonen
on 12 Sep 2018
Same observation, for:
JupyterLab 0.34.9
Chrome Version 68.0.3440.106 (Official Build) (64-bit)
Windows 7
The notebooks I'm running are actualy not very big, about 1 to 2 MB, but still significant lags when switching between tabs.
 eschersky
on 25 Sep 2018
eschersky
on 25 Sep 2018
I confirm the same problem. How to work with large files?
 plubinski
on 28 Sep 2018
plubinski
on 28 Sep 2018
Same on:
- JupyterLab 0.35.2
- Safari 12 and Chrome 70.0.3538.77 (Official Build) (64-bit)
- OSX Mojave
I agree with all of the above. Due to performance issues I keep my usage of the JupyterLab feature set to the bare minimum to avoid any slowdowns. Really hoping 🙏 that this can and will be fixed.
This project and all the efforts which went into it is pure awesomeness.
 ldanilov
on 6 Nov 2018
ldanilov
on 6 Nov 2018
Hi, guys,
First I'd like to thank you all for your incredible work !!! That's really mind blowing tool !
I've just installed JupyterLab ver. 0.35.4 using pip and still observe slowness when switching between tabs under Win10, Chrome/Opera/FF. I see this issue is in the 'Future' milestone so as I understood it's still not in pypi repo, right ?
If so question is when it's planned to be pushed into 'production' ? We're considering to use JLab as replacement of classic Jupyter in our research work but this issue seems to be big stopper for us.
 dmarienko
on 21 Jan 2019
dmarienko
on 21 Jan 2019
@dmarienko Same issue on 0.35.4, both Chrome/Safari on a macbook here. Going to have to go back to notebook using the browser as tabs until switching performance can be addressed.
 maxwellmckinnon
on 30 Jan 2019
maxwellmckinnon
on 30 Jan 2019
It's a particularly difficult issue to swallow because old jupyter doesn't seem to have this problem. I love most of the new features in jlab, but sometimes I go back to jupyter for practical reasons like this.
 oldgeeksguide
on 1 Feb 2019
oldgeeksguide
on 1 Feb 2019
The optimizations from #5700 are now in the 1.0.0 alpha prerelease. You can try it with pip install --pre jupyterlab. We'd love to hear back if people have any issues after this. Note, this:
- does not improve the initial rendering of the notebook
- does not improve rendering after resizing the notebook panel
- does improve rendering when just switching between previously rendered tabs
Note: Replacing the Codemirror v5 with another editor (v6, monaco, ...) will be a more permanent solution, but hopefully this will be a decent band-aid in the meantime.
 vidartf
on 5 Feb 2019
vidartf
on 5 Feb 2019
The optimizations from #5700 are now in the 1.0.0 alpha prerelease. You can try it with
pip install --pre jupyterlab. We'd love to hear back if people have any issues after this. Note, this:
- does _not_ improve the initial rendering of the notebook
- does _not_ improve rendering after resizing the notebook panel
- _does_ improve rendering when just switching between previously rendered tabs
Note: Replacing the Codemirror v5 with another editor (v6, monaco, ...) will be a more permanent solution, but hopefully this will be a decent band-aid in the meantime.
@vidartf do you recommend removing all traces of jupyterlab conda-forge before pip install --pre jupyterlab?
Note: Conda wouldn't allow pip install --pre jupyterlab with jupyterlab already present. I will attempt a remove before pip install --pre jupyterlab
 AlexRig
on 9 Feb 2019
AlexRig
on 9 Feb 2019
@vidartf I opened jupyter lab 1.0.0a1 in Conda with existing notebook panels and the problem persists. No cells were being executed.
Chrome 71.0.3578.98 (Official Build) (64-bit)
Windows 10
AlexRig
on 9 Feb 2019
No cells were being executed.
Can you elaborate on 'no cells were being executed'? I thought this issue was about performance considerations in switching between tabs with long notebooks.
 jasongrout
on 9 Feb 2019
jasongrout
on 9 Feb 2019
That was just to say the kernal was idle and there was nothing running
AlexRig
on 9 Feb 2019
Ah, so you're saying that switching between tabs was still very slow, and you're adding that you weren't trying to execute code while you were doing it?
jasongrout
on 9 Feb 2019
Yes precisely, adding more colour.
AlexRig
on 9 Feb 2019
@AlexRig So you are saying that: With two tabs that were both previously displayed, and without any resizing, switching back and forth is still slow? Do you have linewrapping turned on or off for the cell editors?
vidartf
on 12 Feb 2019
The problem is really quite big.
If I open multiple tabs with bigger notebooks in Jupyter Lab,
switching is very very slow - takes from 5-15 seconds.
It is very uncomfortable to work with Jupyter Lab with such heavy lagging.
Really needs to be analyzed / fixed if possible.
(Anaconda Python v3.7, Jupyter Lab v0.34.9, Win10 latest, Chrome latest)
 stefansimik
on 15 Feb 2019
stefansimik
on 15 Feb 2019
Using the Jupyterlab pre 1.0.0a1 and it is running faster than 0.35.4.
The differences I saw was the html render of some
The overall performance to switch tabs has increased.
Running MacOS Mojave, Safari and Chrome (runs slightly faster on Chrome)
 renatoviolin
on 28 Feb 2019
renatoviolin
on 28 Feb 2019
Saw this issue in the wild this last week...
 ellisonbg
on 6 Mar 2019
ellisonbg
on 6 Mar 2019
Same issue. I cleared memory cache, deleted images and some html attributes that created by me but still there is no change about lagging.
 mvahit
on 28 Mar 2019
mvahit
on 28 Mar 2019
After several tests with different browsers, the more responsive is Firefox. In my machine it is the best one among Safari and Chrome. Switch between jupyter tabs inside Firefox are almost instantaneous.
renatoviolin
on 28 Mar 2019
@renatoviolin just curious what jlab version did you use there ?
dmarienko
on 28 Mar 2019
@renatoviolin just curious what jlab version did you use there ?
Jupyterlab pre 1.0.0a1
renatoviolin
on 28 Mar 2019
It is fast on both Chrom and Firefox when you switch from the notebook tab to a binary file (txt, .py etc.) but, too slow when you switch back (UBUNTU 18.04)
 rahulkashyap411
on 28 Mar 2019
rahulkashyap411
on 28 Mar 2019
Similar experience. Firefox is much faster compared to Chrome for long notebook.
 louis925
on 18 Apr 2019
louis925
on 18 Apr 2019
Sadness, this happens for me on all major browsers (Chrome, Firefox, Edge) all of which are up-to-date. The lag of the overall tool really makes it hard to enjoy the benefits over the "classic" interface. I keep being forced to switch back just to get anything done.
 sbowman-mitre
on 22 Apr 2019
sbowman-mitre
on 22 Apr 2019
Note: While we do have some suspicions about what is causing this, any help in narrowing this down would be very helpful. What can you do to help?
- Share one or more notebooks that clearly and reliably triggers this problem for you.
- Profile this yourself using Chrome devtools (performance, record, do some simple steps like switching tabs a few times, stop recording, right-click -> save profile).
vidartf
on 24 Apr 2019
Hi @vidartf
attaching 2 notebooks, that are predictably very slow + Profiling session.
stefansimik
on 2 May 2019
@stefansimik Noted, and I'm putting this somewhere in my TODO queue. I have every intention of looking at this in time for 1.0, but cannot make any promises as to actually resolving it. Anyone else is of course also free to try to have a look 👍
vidartf
on 9 May 2019
I arrive here after reading the JupyterLab changelog for 1.0.0 describing performance was improved, is this to be considered resolved or is it still an open issue?
 consideRatio
on 9 Jul 2019
consideRatio
on 9 Jul 2019
I don't think this is fully resolved yet, and I think there is some remaining profiling and optimization to do. If someone has time to investigate this in depth enough to tell which parts of the code is the bottle-neck, or being called often, etc. that could really help out. How hard the optimization would be to implement depends on those questions.
vidartf
on 10 Jul 2019
It's definitely not fully solved for me, but I do have a work around that helps a lot. The big problem for me occurs when I have plotly graphics in use that contain > 1000 data points (data stored as pandas DataFrames). And, if I have more than one graphic (very likely) in the same notebook then it gets super bad. I use <right click> : <Clear All Outputs> routinely to dump them when the processing gets slow. As soon as I do that, everything is much better. And I'm careful about which graphics I'm willing to save to the FS. I've got one older notebook that won't open because the plots have so much data in them.
sbowman-mitre
on 10 Jul 2019
@vidartf I did some quick benchmarks too. I used 'not_so_obvious_python_stuff' notebook that I previously used for benchmarking the slow search problem #6756. It turns out that switching notebooks is not the biggest problem, but rather switching notebooks after they have been resized (i.e. the layout has changed by resizing the window, hiding/showing the sidebar, adding or resizing a new panel). This test confirms that #5700 works, and highlights further bottlenecks which can be targetted (as well as the need for incremental rendering).
The external validity is, of course, limited to the specific things embedded in the test notebook - I will check again with @stefansimik notebooks later. Tests performed on the master.
Here are the screenshots of my profiles:
A) First when both notebooks were previously rendered (opened) and nothing was resized:
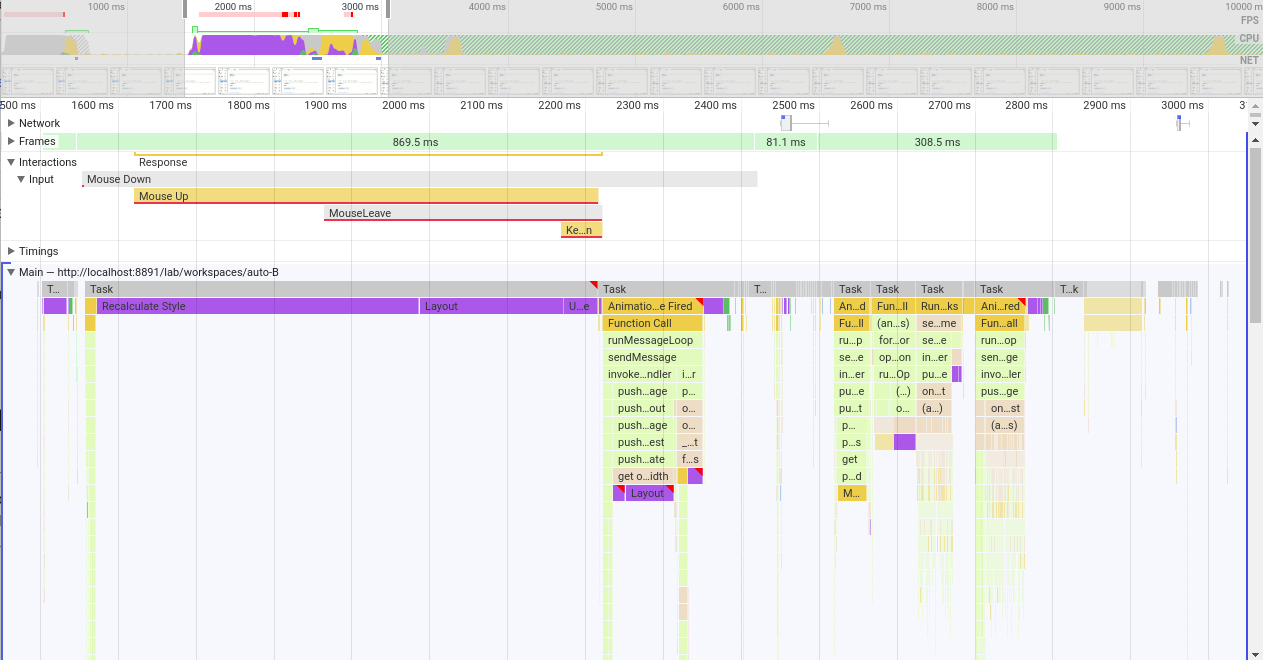
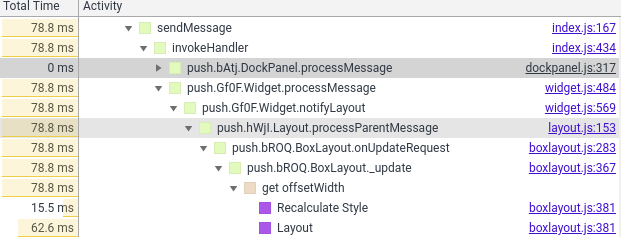
- In the first first unresponsive frame (869.5 ms) we see the browser recalculating styles for half a second, then relayouting. Next task in an "animation frame fired" event which comes from phosphor dockpanel processing update messages; the suspected purple region of second layouting comes from
get offsetWidthcall, which may or may not be avoided upon some tweaking to theBoxLayout.prototype._updateof phoshpor'sboxlayout.js. The frame ends with the "Update Layer Tree" (25.9 ms).
- Next 81.1ms are quite responsive (12 frames) with various small tasks such as: MathJax (latex rendered) updating, TabBarSvg updates, phosphor calling React render from virtual DOM, server being notified of the potential and some repaints.
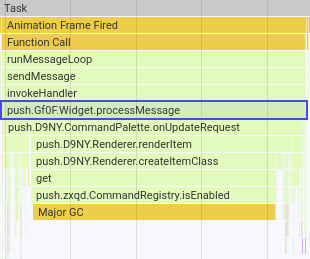
- Then the final freeze of 308.5ms comes. Here are some troublesome tasks, in order:
- 47.89 ms: tabbarsvg / command pallete updates:
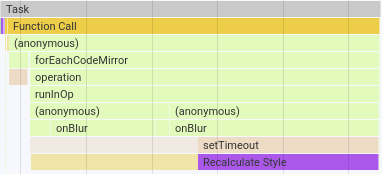
- 58.11 ms: editor (CodeMirror) focus switch:
- 60.01 ms: filebrowser updating icons in the listing (why? - I only switched files, not directories)
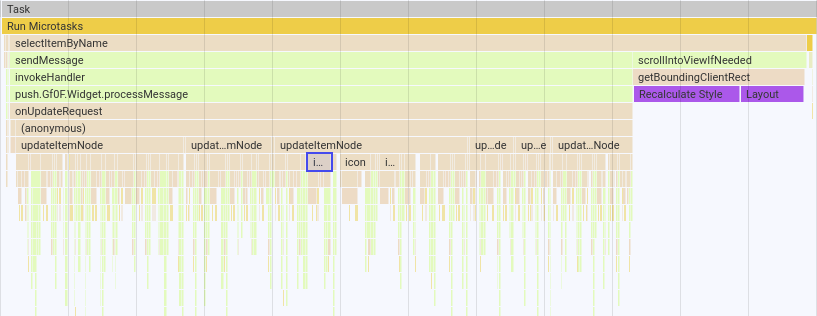
- 13.90 ms: major garbage collection
- 101.97 ms: "saving status" update (12.08 ms) and (again) filebrowser listing update (50.23 ms)
as for the filebrower listing, the SVG icons are again causing some trouble here:

- 47.89 ms: tabbarsvg / command pallete updates:
I should probably note that I have 38 files and folder displayed in the filebrowser listing (in my current directory).
 krassowski
on 16 Aug 2019
krassowski
on 16 Aug 2019
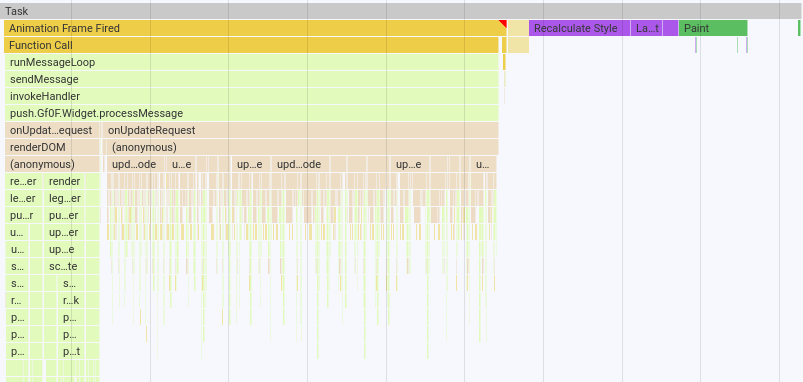
B) Second, after resizing the side panel
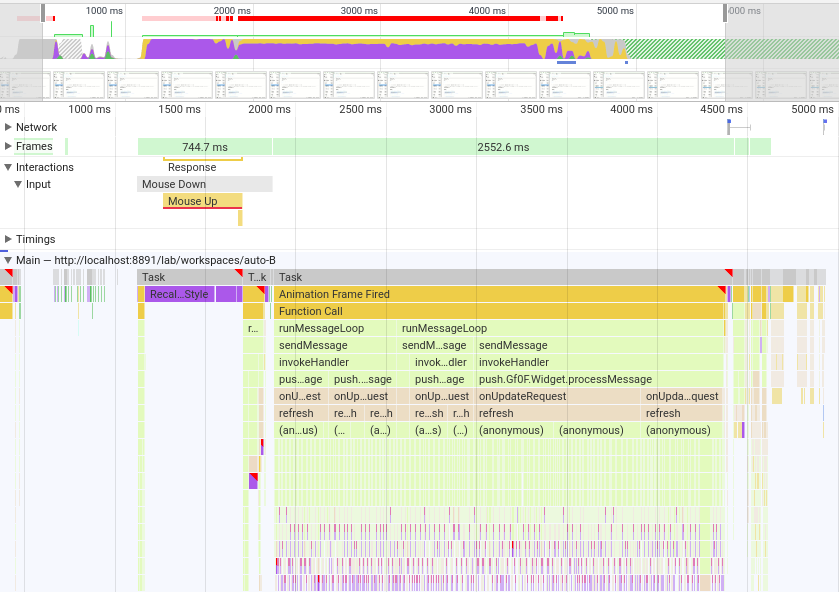
- First non-responsive period of 744.7 ms did not change when compared to the non-resized scenario
- Before the second, responsive frameset of 12 (small tasks as described above), a large non-responsive block lasting 2.55 s of CodeMirror operations appeared:
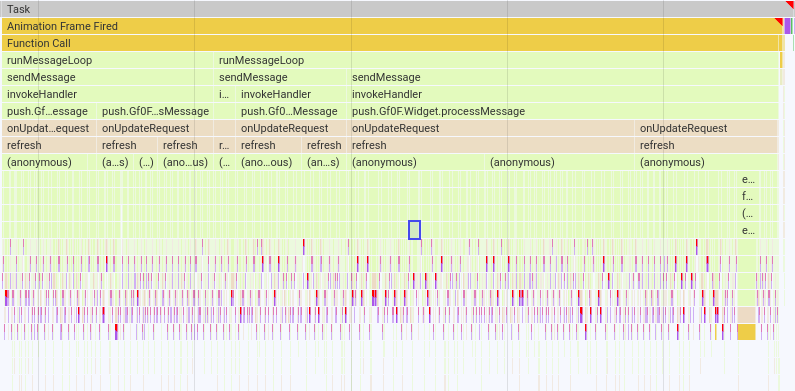
which causes us big trouble.
The diagnosis is very similar to what I concluded for slow search - sequential updates of a large number of CodeMirror instances cause endless recalculations and re-layouting of everything, which freezes the interface.
I have previously discussed and the idea of performing the CodeMirror updates in an asynchronous way in #6824, for example in the background or when the user scrolls their view close enough so the codemirror editor is "in danger" of being seen in an outdated (not refreshed) state if we do not refresh it now.
JupyterLab is not the first project having issues with the slowness of CodeMirror when a large number of instances is running; I linked how it was handled/discussed by other projects here: https://github.com/jupyterlab/jupyterlab/pull/6824#issuecomment-513339522.
One big caveat: more notebooks need to be profiled, as it may turn out that there are other causes.
I will not immediately act on these findings, but I am happy to help if a way forward is agreed upon :)
krassowski
on 16 Aug 2019
@williamstein just implemented react-window to do virtual scrolling for large notebooks in cocalc. He did some interesting tricks with codemirror in particular to get it to work react-window. Cocalc now has pretty nice support for large notebooks with codemirror.
jasongrout
on 16 Aug 2019
Cross-referencing PR with the virtual scrolling mentioned above: https://github.com/sagemathinc/cocalc/pull/3969.
It does seem like a very large chunk of work (70 commits, 50+ files changed).
krassowski
on 16 Aug 2019
It does seem like a very large chunk of work (70 commits, 50+ files changed).
- I made a lot of mistakes along the way, which are in that log.
- I used react-virtualized first, then switched to react-window.
- I used windowing not just for Jupyter, but for nearly everything in CoCalc where it might be beneficial (e.g., file listing, lists of students in courses, the log of a project, the list of projects, etc.). This makes the number of changes much larger than it would otherwise be.
- I'm still not 100% happy with the results.
All that said, I strongly encourage Jupyterlab to do something similar, since it really improves the user experience to support this sort of scalability, since notebooks can get really long when people are playing around, and notebooks are often used for playing around.
 williamstein
on 16 Aug 2019
williamstein
on 16 Aug 2019
since notebooks can get really long when people are playing around, and notebooks are often used for playing around
True that! I routinely use notebooks for simply playing with graphics, which means I have a single notebook with multiple view of the same data set. That's exactly when this slow-down occurs, making the exploration experience very frustrating. At the same time, I've gotten use to the pain-point and have mental work-arounds that I use while I wait for a permanent fix.
sbowman-mitre
on 19 Aug 2019
If we do end up re-writing the notebook in React and using windowing, we should make sure to take a look at the work @captainsafia did to try to add this nteract as well https://github.com/nteract/nteract/pull/4602
 saulshanabrook
on 23 Jan 2020
saulshanabrook
on 23 Jan 2020
Here is a notebook example (exported to a script) that is slow to switch to from another tab (that uses Plotly):
# In[1]:


import plotly
import plotly.io as pio
plotly.__version__


# In[2]:


import plotly.io as pio
import plotly.express as px
pio.renderers.default


# In[8]:


pio.renderers.default = 'iframe'
# pio.renderers.default = 'plotly_mimetype+notebook'


# In[9]:


import pandas as pd
import numpy as np
df = pd.DataFrame(np.random.randint(0,100, size=50*1000))
fig = px.line(df, df.index)
fig.show()


# In[10]:


import pandas as pd
import numpy as np
df = pd.DataFrame(np.random.randint(0,100, size=50*1000))
fig = px.line(df, df.index)
fig.show()


# In[11]:


import pandas as pd
import numpy as np
df = pd.DataFrame(np.random.randint(0,100, size=50*1000))
fig = px.line(df, df.index)
fig.show()


# In[12]:


import pandas as pd
import numpy as np
df = pd.DataFrame(np.random.randint(0,100, size=50*1000))
fig = px.line(df, df.index)
fig.show()
Another example is a one cell with many outputs
from vdom.helpers import div
from IPython.display import display

for i in range(10000):
    display(div('I am a long string which is repeatedly added to the dom: %d' % i))
I am gonna look into these use cases.
saulshanabrook
on 12 Feb 2020
Another example is a one cell with many outputs
I want to point out another very similar example which does not have issues - making the biggest difference class names on some divs.
from vdom.helpers import div
children = []
for i in range(10000):
    children.append(div('I am a long string which is repeatedly added to the dom: %d' % i))
div(children)
@williamstein - given that many nodes are no longer rendered - how did you handle search?
 mlucool
on 6 Mar 2020
mlucool
on 6 Mar 2020
@williamstein - given that many nodes are no longer rendered - how did you handle search?
A few relevant remarks:
Regarding switching tabs, CoCalc just keeps all the notebooks rendered at all times and hides them when they aren't visible. This way switching back doesn't require re-rendering them. Even a few hundred ms for switching editor tabs in cocalc isn't acceptable, due to the shortcomings of our UI meaning that you have to switch tabs a lot (unlike JupyterLab).
We now only switch to using windowing after a threshold have at least 75 cells (or something like that). Most notebooks thus actually don't use windowing. (Also, on Safari I never got windowing to work 100% reliably, so it's always disabled there.)
Right now find (and replace) is just this dialog who UI I just copied directly from Jupyter Classic, so users don't have to rely on the browsers HTML DOM find:
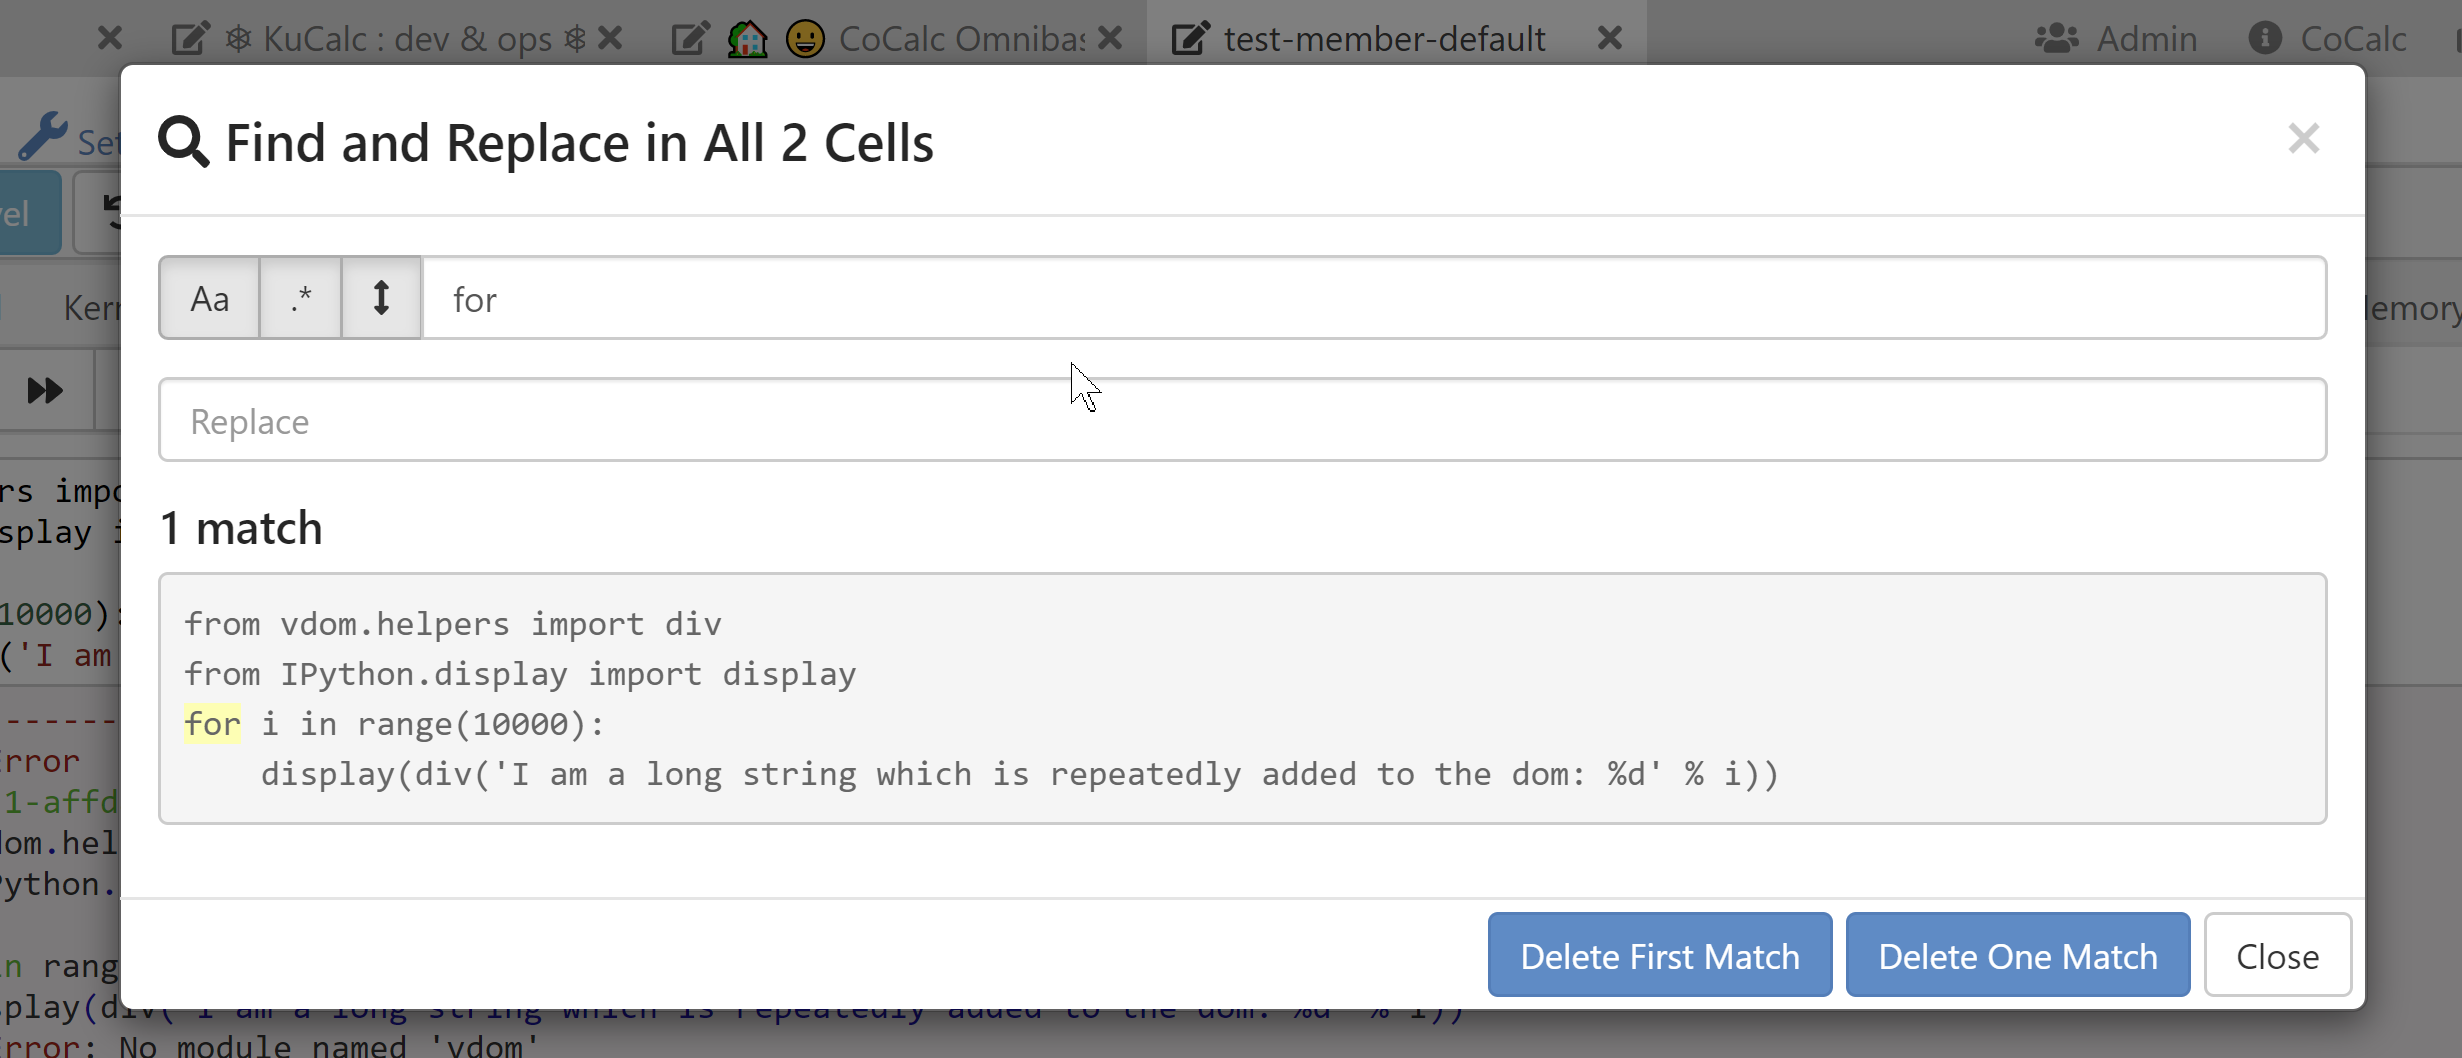
Honestly, I don't like that dialog at all, but since it is the same (or was two years ago?) as what Jupyter classic does (or did), I figured it was good enough until I could do something better later.
We use the same windowing code all over CoCalc in over a half dozen places. There's tons of situations that involve a "list of items", e.g., long file listings. Jupyter notebooks are the most challenging for windowing, of all of these though, due to the dynamic nature of cells.
I'm probably soon going to finally implement a single document mode for Jupyter notebooks, where there's just one big codemirror editor like we have with Sage worksheets. That has the cool advantage that Codemirror takes care of windowing, find and replace, and many other things, and does so in a way that works on a wide range of browsers in a way people expect, with several different keyboard shortcut modes (sublime, emacs, vim, standard). I hope JupyterLab does something similar at some point too, since both approaches (bunch of codemirrors versus a single codemirror) have advantages and are preferred by different people or for different tasks...
williamstein
on 6 Mar 2020
Thanks for your insights, William. That's a great idea to have a threshold for switching to windowing. And I would love to see a notebook plugin in jlab that implements a single-editor philosophy, which hopefully would be fairly straightforward to integrate once one was built as a single component.
jasongrout
on 6 Mar 2020
I am working on developing some benchmarks here we can run: https://github.com/jupyterlab/jupyterlab/pull/8020
saulshanabrook
on 9 Mar 2020
So colab virtualizes the outputs, but not the inputs. It uses the IntersectionObserver to figure out when they are in view, and if not replaces them with an empty div. The tricky part is figuring out the height for the outputs....
After you compute them once, they save them in the notebook, but not when exporting. So if you import a jupyterlab notebook, the first time it won't be virtualized. Then if re-run it height is saved and it will now be virtualized.
saulshanabrook
on 11 Mar 2020
We had a chat about this on our call today.
I brought up using the IntersectionObserver to lazily render the outputs, to improve initial load time and got some good suggestions.
- @vidartf suggested that batching updates for rendering is useful, so that we minimize the number of reflows as sizing changes.
- @ellisonbg said that they tried doing this with codemirror in the past, starting with an initial render of just the syntax highlighted code, and it didn't help much, b/c still had lots of DOM nodes.
- @ellisonbg also suggested maybe we should just do it at the cell level, to hide both inputs and outputs.
saulshanabrook
on 15 Apr 2020
Personally, I'm much more worried about the bad performance when switching to a small notebook than when switching to a big notebook.
Nowadays, browsers offer developers tools - IntersectionObserver API, for example - that should make not too difficult to virtualize rendering of big notebooks, keeping in the DOM just the nodes needed to display the cells visible at any given moment, and adding and removing cell nodes from the DOM as the notebook is scrolled.
But to ensure the user has a smooth experience, this operation should be as fast as possible, ideally browsers should render the new inserted nodes in less than 16 ms, so to stay on the 60 FPS threshold.
At the moment JupyterLab seems far from reaching this target.
Of the time spent by the browser to render the html tree of a notebook, about 70% is for style calculation and of this about one-half to find what CSS rules apply to each element of the tree. How long this process takes, depends on
the number m of elements of the tree,
the number n of the CSS rules in the html document,
the complexity of the CSS rule selectors.
To improve the rendering performance we could act on those parameters.
Here, I want to focus on the second one, the number n.
I noted JupyterLab loads by default few CodeMirror theme stylesheets, though they are needed only by standalone text editors and just the one of the theme in use. Removing them, decreases the style calculation time by an amount of 10-15%.
They are perfect candidates to be lazy-loaded only when needed.
This does not bring a drastic improvement but I suspect there are other similar optimizations we can adopt.
For example, removing the Blueprint CSS reduces the calculation time by another 3-4%. I don't know where it is used, but the JupyterLab aspect does not seem to change much without it; maybe it too can be lazy-loaded.
On another front, I believe it's time to start experimenting with ShadowDOM. Although not born to improve performance, I think it could have good impact on that too.
Using ShadowDOM, CSS rules are scoped: when the browser calculates the style of elements inside a shadow tree, only CSS rules declared within that tree are taken in consideration. Therefore, even if the total number of CCS rules remains constant, the amount of rules examined to calculate an element style is cut down.
For example - if the UI components are moved inside a shadow tree and the Blueprint stylesheet is removed from the main document and inserted into that tree, then, when calculating the style of the UI components, the browser will scan Blueprint CSS rules, while will ignore all the rules defined outside (those used for styling cells, notebooks and so on).
The other way around, when calculating the style of an element outside the shadow tree, the Blueprint stylesheet will be ignored.
 AlbertHilb
on 1 Jun 2020
AlbertHilb
on 1 Jun 2020
I have a habit of writing long notebooks with table of contents etc and I noticed the same issue... makes working with Jupyterlab quite cumbersome. FYI this does not happen with Jupyter Notebooks.
Same here. Not only that, the whole experience of using Jupyterlab gets unusably slow when there is a large notebook in the directory (in my case just a 4megabyte notebook). It is such deal breaker... Has someone found a workaround to that?
Thank you.
2020, 5 June.
 GitHunter0
on 6 Jun 2020
GitHunter0
on 6 Jun 2020
Jupyterlab gets unusably slow when there is a large notebook in the directory (in my case just a 4megabyte notebook
This sounds like a different issue than the other things that has been discussed here so far. would you mind opening a new issue about this? It would also be really helpful if you could open the developer tools of your browser, and go to the "Network" tab before reloading the lab page. If there are any network requests that end up being slow because of the large notebook, that would be a bug.
vidartf
on 8 Jun 2020
the whole experience of using Jupyterlab gets unusably slow when there is a large notebook in the directory (in my case just a 4megabyte notebook).
If simply having a large notebook in a directory is causing JupyterLab to slow down, this seems to be a different issue, as Vidar suggested. If instead, your issue is that opening a large notebook causes JupyterLab to slow down, then this is the same issue.
saulshanabrook
on 8 Jun 2020
@vidartf , @saulshanabrook , Sorry if I did not make it clear. I believe it is the same issue, I didn't detect a slow down on the network requests, JupyterLab is what is getting very slow as a whole.
GitHunter0
on 8 Jun 2020
I just noticed that firefox webrender can be turned on via a pref in firefox 79 for many linux and macos devices (https://wiki.mozilla.org/Platform/GFX/WebRender_Where, see also, for example, https://www.techrepublic.com/article/how-to-enable-firefox-webrender-for-faster-page-rendering/ for how to turn it on). Note that windows firefox has had webrender turned on by default in certain cases for a while now.
Turning on webrender for me makes pages much faster in firefox 79 on macos. I wonder if it makes a difference for this issue.
jasongrout
on 15 Aug 2020
@jasongrout. I have updated https://jupyterlab-benchmarks.readthedocs.io/en/latest/fixes/index.html#strategy-7-browser-configuration based on your comment.
Turning on webrender for me makes pages much faster in firefox 79 on macos.
How much faster is it (roughly)?
For info, we have some representative notebooks for which JupyerLab shows low performance. Those notebooks are generated in the data folder if your run the benchmarks (see https://jupyterlab-benchmarks.readthedocs.io/en/latest/benchmarks/index.html that explains how to run them)
 echarles
on 15 Aug 2020
echarles
on 15 Aug 2020
How much faster is it (roughly)?
Hard to tell. Order of magnitude or more? It's definitely noticeable.
I did some quick experiments, based on some quick profiling results (it seems that the vast majority of time is in browser layout). For example, adding scrollbarStyle: 'null' to the bare editor config at https://github.com/jupyterlab/jupyterlab/blob/7d1e17381d3ed61c23c189822810e8b4918d57ba/packages/codemirror/src/editor.ts#L1374 seemed to help a bit. Also editing the codemirror source to avoid measurements (by manually returning what the cached values ended up being) at https://github.com/codemirror/CodeMirror/blob/83b9f82f411274407755f80f403a48448faf81d0/src/measurement/position_measurement.js#L586 and https://github.com/codemirror/CodeMirror/blob/83b9f82f411274407755f80f403a48448faf81d0/src/measurement/position_measurement.js#L606 seemed to help a bit.
The idea here is that since a single codemirror seems okay, but many codemirrors does not (even when the total number of lines is the same), perhaps we can use measurements from the codemirror to shortcut measurements in all the others, which seem to be causing lots of browser layout time.
Of course, having virtualization/windowing circumvents this problem by not having too many codemirrors on the page at a time. However, I still wonder if we can work with codemirror developers to increase the performance of many codemirrors on a single page by sharing appropriate bits of config between them.
jasongrout
on 15 Aug 2020
I did some quick experiments, based on some quick profiling results (it seems that the vast majority of time is in browser layout). For example, adding scrollbarStyle: 'null' to the bare editor config at
Cool. this falls into what I have called Strategy 2 Adhoc fix - Will write it in the doc so we can track and measure how better it performs
Also editing the codemirror source to avoid measurements (by manually returning what the cached values ended up being)
Absolutely, on https://jupyterlab-benchmarks.readthedocs.io/en/latest/profiling/index.html I have written It sounds like most of the latency is due to codemirror triggering reflows. I will look a bit how to typically solve this, see e.g. CodeMirror/#/5873.
On https://github.com/codemirror/CodeMirror/issues/5873#issuecomment-490429102 it sounds like the codemirror authors are aware of avoiding forced layout, have done their best to avoid that, but still we are hitting that a lot. Not sure if we can roll useful fixes to us in the codemirror code base.
Of course, having virtualization/windowing circumvents this problem by not having too many codemirrors on the page at a time.
I am experimenting on that now and already expect side effects like Search not available on the notebook page.
However, I still wonder if we can work with codemirror developers to increase the performance of many codemirrors on a single page by sharing appropriate bits of config between them.
Something good for jlab may be bad for other consumers. I don't know well codemirror community and how easy it would be to get changes in.
echarles
on 15 Aug 2020
If there's a way to have a special browser for viewing notebooks (like chromium fork or something), I think a lot of people would be on board with that. tab-switching being slow makes jupyter lab almost unusable.
 avloss
on 12 Sep 2020
avloss
on 12 Sep 2020
Jason:
Thanks for your insights, William. That's a great idea to have a threshold for switching to windowing.
I've changed direction in CoCalc and completely eliminated use of windowing for Jupyter notebooks. Instead, cocalc renders the cells asynchronously (with a very slight delay between them). This way you quickly see the top of the notebook on load and can quickly start interacting with it, even if 500 more cells are being rendered. Overall, this seems like the best tradeoff, and was very simple to implement. You could probably easily try the same with JupyterLab.
Regarding switching between tabs, now in CoCalc whenever an editor tab is put in the background, the contents of the editor is hidden via display:none but not otherwise removed from the DOM. I initially implemented just using display:none, since I was annoyed by the slight delay (and subtle annoying scroll issues) when switching between code editors and terminals -- before cocalc would completely remove the tab contents from the DOM on hiding the tab and render them again on selecting the tab. Is this what JupyterLab does or does it re-render everything or something else? I have no idea if CoCalc is slower or faster than JupyterLab for tab switching.
avloss:
tab-switching being slow makes jupyter lab almost unusable.
I'm curious if you could point to one notebook which illustrates this problem for you. (Sorry if I'm stupidly missing something from the long discussion above.)
williamstein
on 12 Sep 2020
Is this what JupyterLab does or does it re-render everything or something else?
JupyterLab (well, really Lumino) does the display: none trick for tabs that are in the background and not showing:
The problem is that we've struggled with how much recalculation is done by codemirrors when we show the tab again. I'm not sure where we are exactly now, but at one point we were calling a codemirror refresh on each editor whenever the tab was shown to make sure things were recalculated (IIRC codemirror itself recommends any time it is unhidden to call .refresh)
jasongrout
on 12 Sep 2020
@williamstein - do you call the codemirror refresh for each cell when the notebook page is unhidden? Do you do it asynchronously as well?
jasongrout
on 12 Sep 2020
do you call the codemirror refresh for each cell when the notebook page is unhidden?
Yes. So probably the performance is similar to JupyterLab. I don't control when the refresh gets called, since that's done via react/redux.
williamstein
on 12 Sep 2020
Is there any solution? it is too slow to work with few big notebooks at different tabs. (both in chrome and edge)
 elronbandel
on 22 Dec 2020
elronbandel
on 22 Dec 2020
Related issues
ellisonbg
·
3Comments
 minertom
·
3Comments
minertom
·
3Comments
 elgalu
·
3Comments
elgalu
·
3Comments
 aghoshpub
·
3Comments
aghoshpub
·
3Comments
 psinger
·
3Comments
psinger
·
3Comments
Most helpful comment
All that said, I strongly encourage Jupyterlab to do something similar, since it really improves the user experience to support this sort of scalability, since notebooks can get really long when people are playing around, and notebooks are often used for playing around.