Juice-shop: Load time of Score Board requires improvement
In version 8.3.0 (haven't tried another 8.x version) the loading of the score board is very slow especially when the juice-shop runs in Virtualbox (created by Vagrant). Loading time for the scoreboard page takes about 30 seconds.
Loading of https://juice-shop.herokuapp.com/#/score-board takes about 6 seconds on the host machine.
The $10 bounty on this issue has been claimed at Bountysource.
 buzzz
buzzz
All 30 comments
The Score Board is currently very inefficient in calculating the percentages and number of solved challenges per difficulty, challenge categories to display etc. This definitely needs some optimization as even 6sec is too long to wait for.
 bkimminich
on 22 Jan 2019
bkimminich
on 22 Jan 2019
Hey, I really want to get started to contributing here. Can I take this up?
 devanshbatra04
on 26 Jan 2019
devanshbatra04
on 26 Jan 2019
@devanshbatra04, that would be awesome! Any performance improvement to the Score Board is highly appreciated! Not a Vagrant specific issue, you'll see the spinner for some seconds locally as well.
bkimminich
on 26 Jan 2019
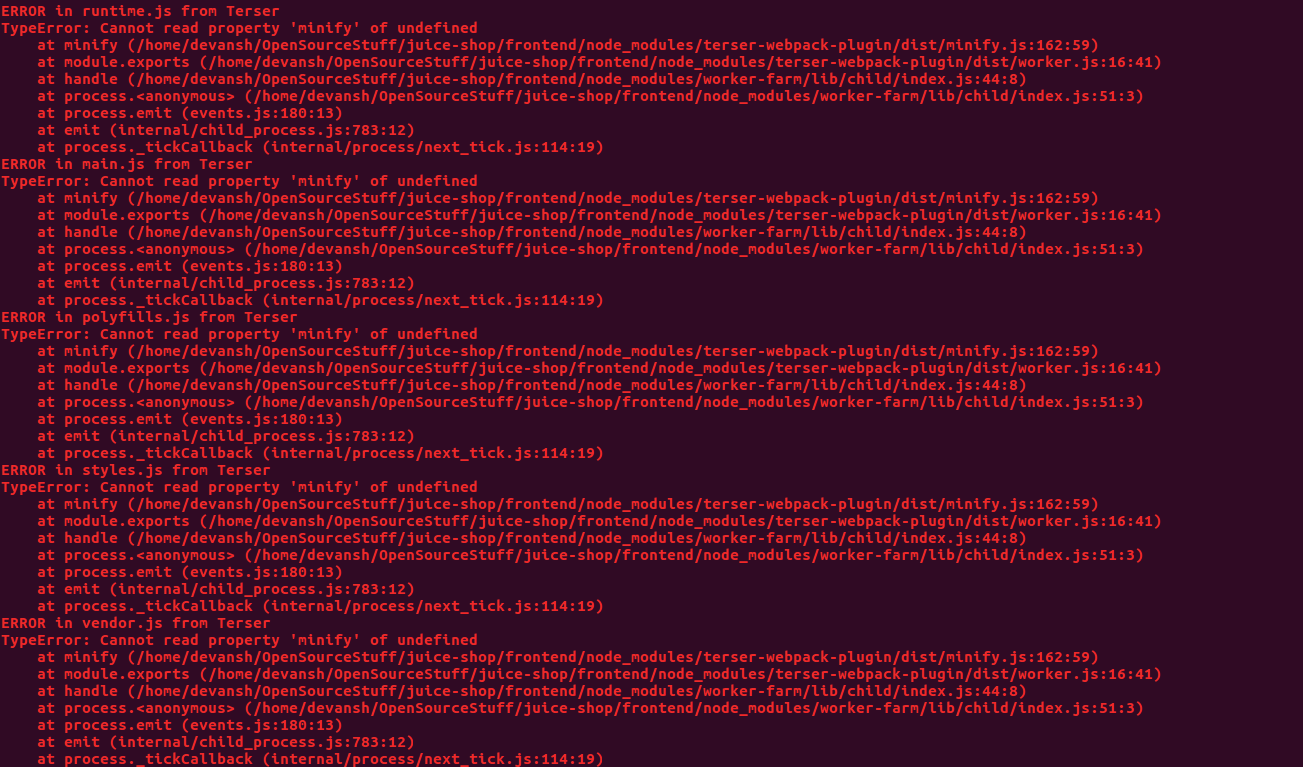
Hi, I have been trying to debug this for a some time, just don't see why the build is failing. I know this probably has nothing to do with the project. But has it been reported before.
Something wrong with Terser
Occurs while trying to build the frontend. npm run build script. :disappointed:
devanshbatra04
on 2 Feb 2019
This seems to be an error with Terser v3.16.0 a dependency for Angular dev tools apparently.
And its just reported a few hours ago with everyone going nuts.
https://github.com/webpack-contrib/terser-webpack-plugin/issues/66
devanshbatra04
on 2 Feb 2019
Oh awesome... Let's hope it gets fixed quickly. Until then you might work around it by adding a dependency on the previous version explicitly in package.json.
bkimminich
on 2 Feb 2019
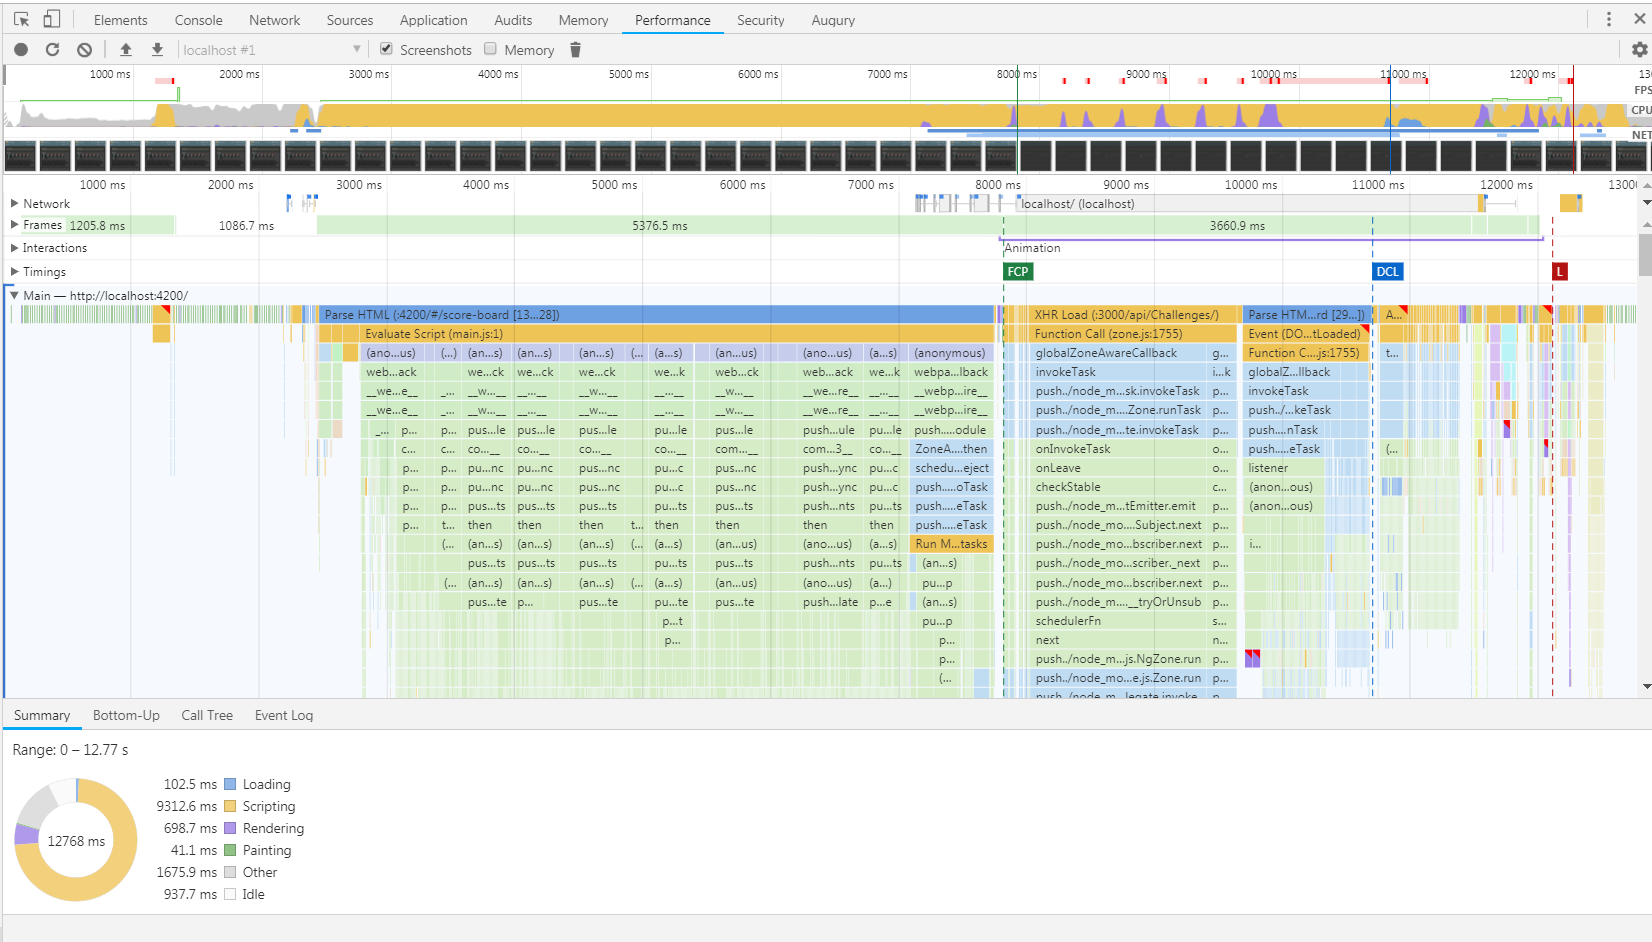
The application configuration HTTP request that's taking insane amounts of time to load on the score board page. Its taking over 1 second on local. Also this request gets made multiple times, not sure why.
The response is the config json.
We should implement some sort of caching probably?

devanshbatra04
on 2 Feb 2019
Caching the config on the client is totally OK as there is no on-the-fly changes to it. Config changes require a server restart. This should even help reduce load time on _all screens_ a bit, I assume! ⏱
bkimminich
on 3 Feb 2019
Hi @devanshbatra04, did you already start working on this, or should I put it back into the Backlog? We're kind of running out of good first issue tickets faster as more people come asking for those currently... (which is a very nice luxury problem for an open source project) ... 😁
bkimminich
on 17 Feb 2019
Yeah I did start the work. Not an angular person (yet). Have major experience in react tho, so I went about learning a bit of angular first. Will send in a PR in a couple days for sure. Thanks a ton for the patience. :smile:
devanshbatra04
on 17 Feb 2019
bkimminich
on 28 Feb 2019
:goal_net: Load time goal to resolve this ticket successfully is max. 3 seconds in all types of deployment situations on appropriate hardware. Benchmark: https://juice-shop-staging.herokuapp.com/#/score-board
bkimminich
on 1 Mar 2019
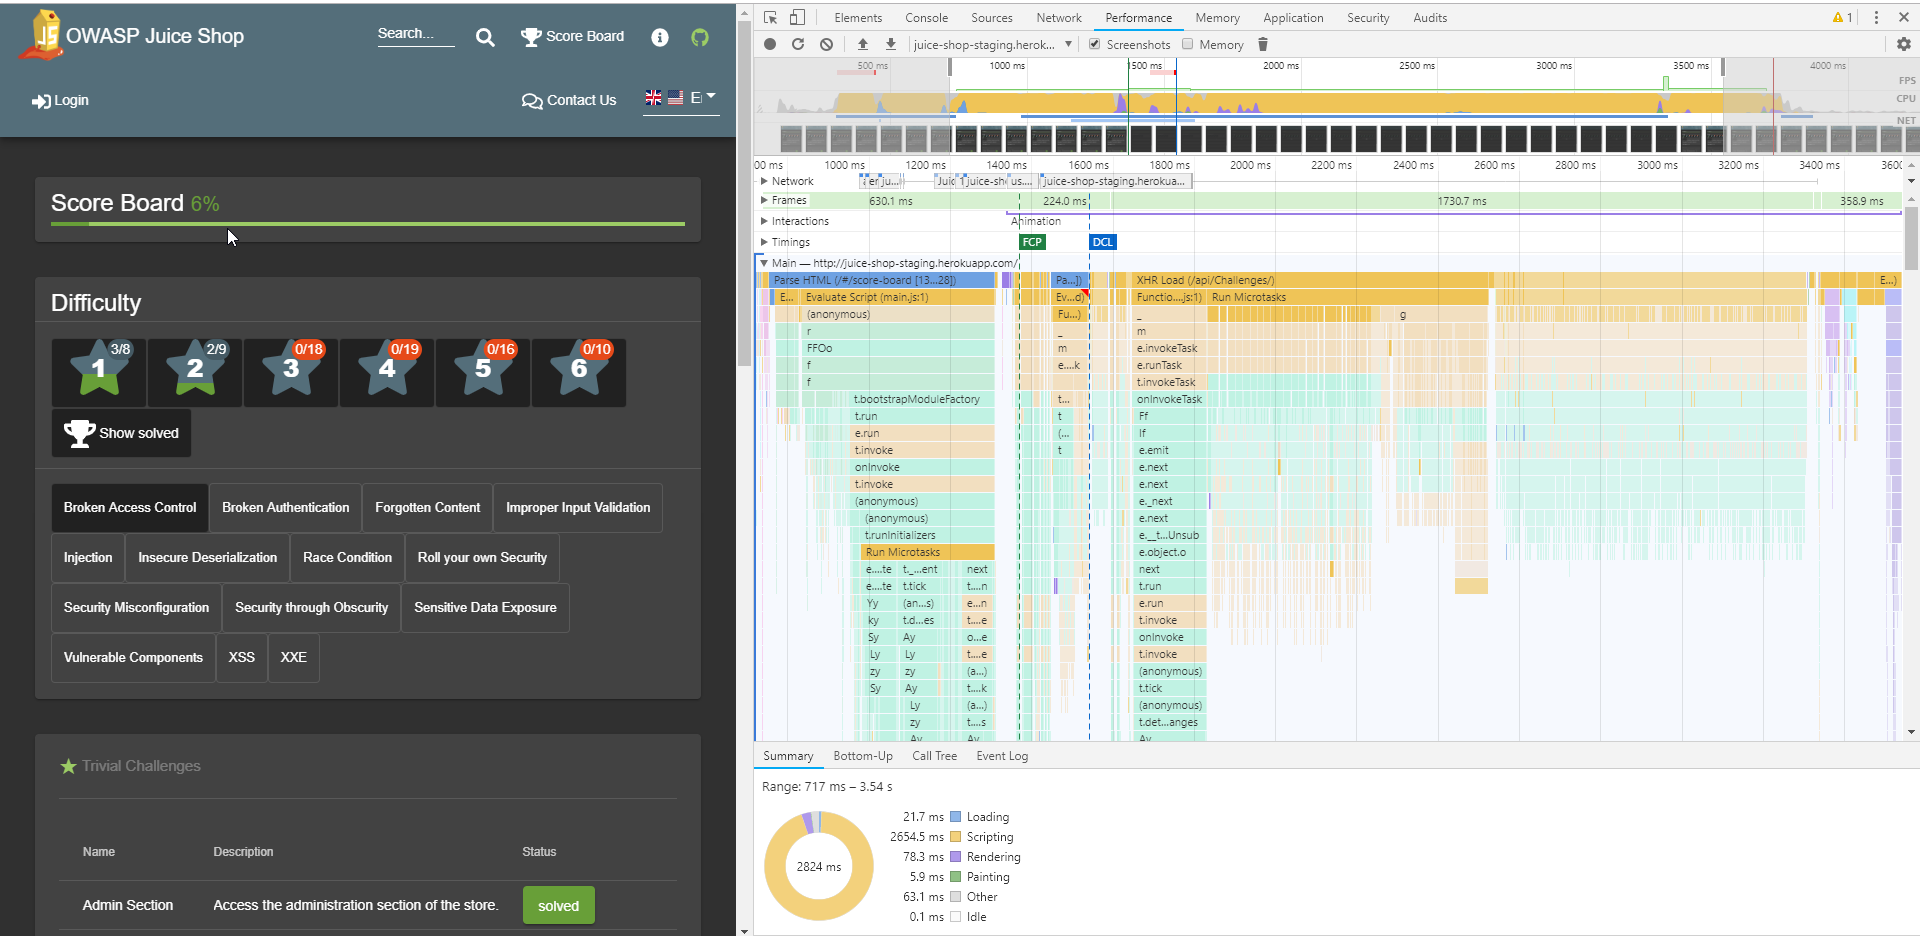
I played with the Score Board and did reloads all over coming to the following conclusion:
- Turning on/off difficulties (by blicking the stars) does not change much
- Turning on/off solved challenge toggle does not change much
- Turning on/off categories makes a huge difference
I turned off all categories and F5ed getting an almost instant reload. With 1-2 categories on the loading spinner showed for a blink, the more categories you turn on the slower it gets. So, that filter option seems to be a major part of the slow-down.
bkimminich
on 1 Mar 2019
Hey! I will do that and send in a PR asap!
devanshbatra04
on 2 Mar 2019
I've made several improvements:
- Calling
challenges.filter()now only once with 2 checks inside anon function instead of calling 3 times with single checks - Avoid one
challenges.filter()all alltogether by reusing cahced filtered lists - Remove client-side sorting by requesting challenges from API sorted already
Result: CI-stage E2e is down insignificantly from 21min to 19min and load time seems slightly better locally, but again not much. The only thing to speed it up dramatically is turning off cateogry filters.
bkimminich
on 2 Mar 2019
All categories turned on
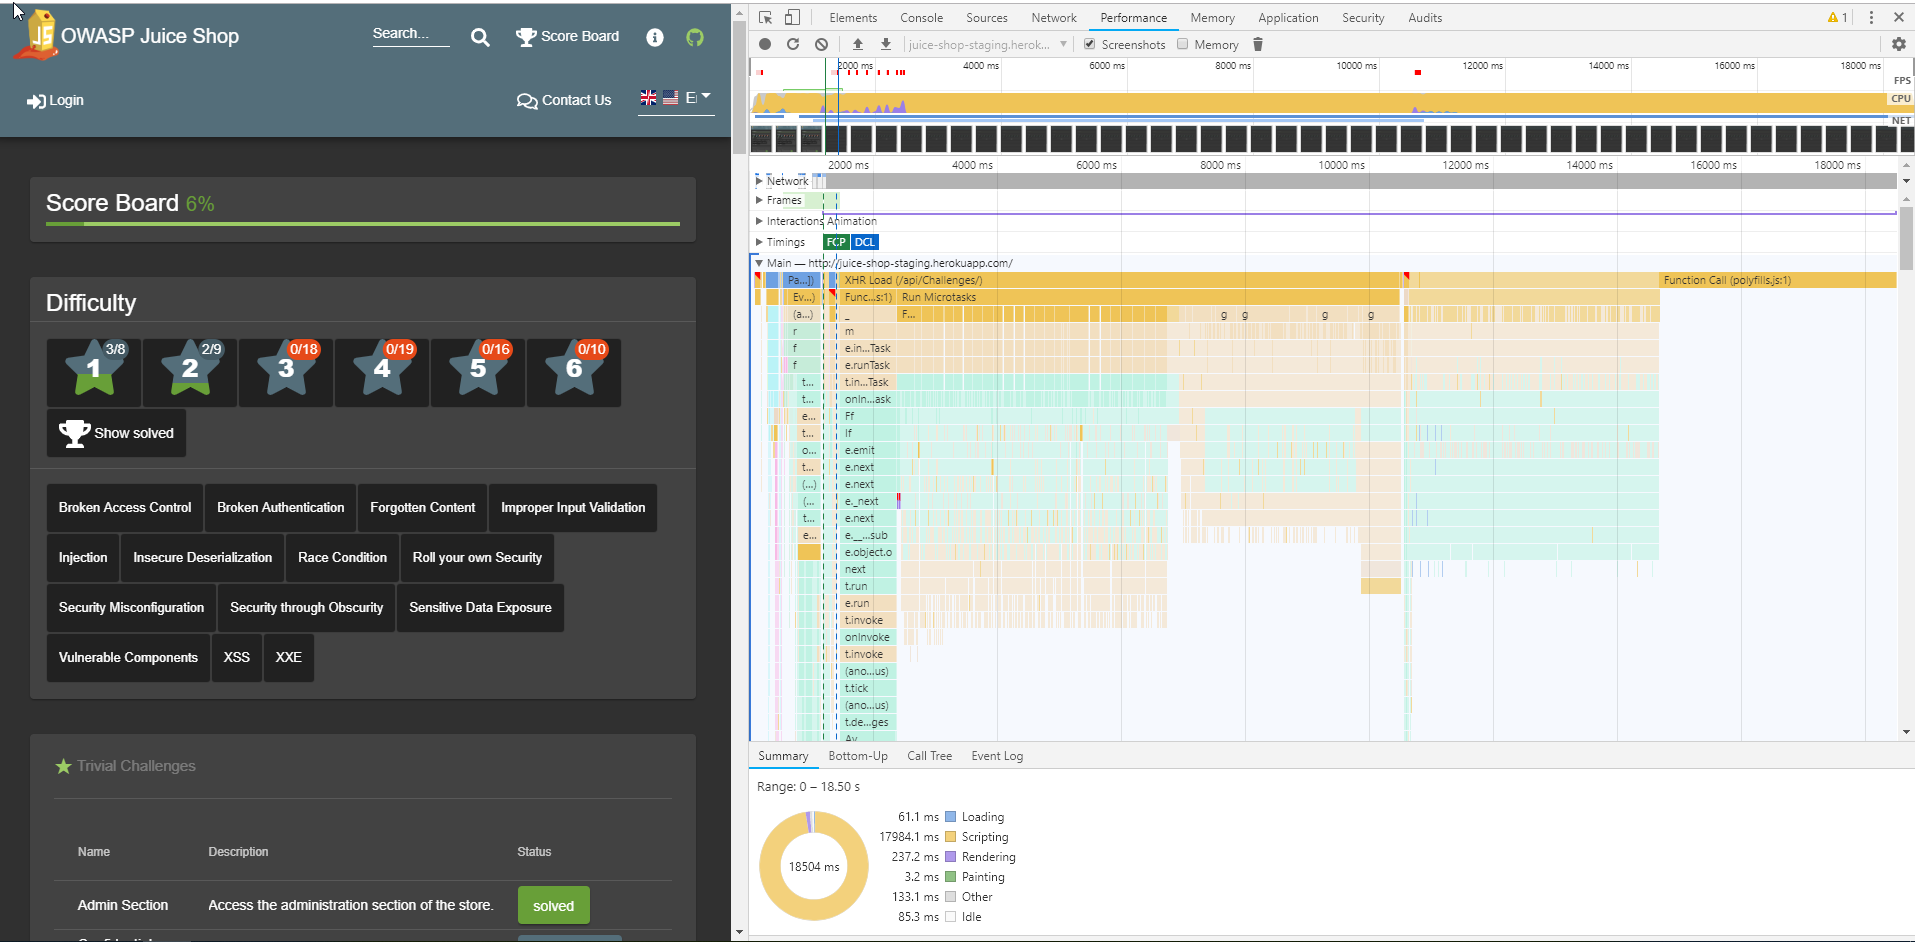
Half the categories turned off
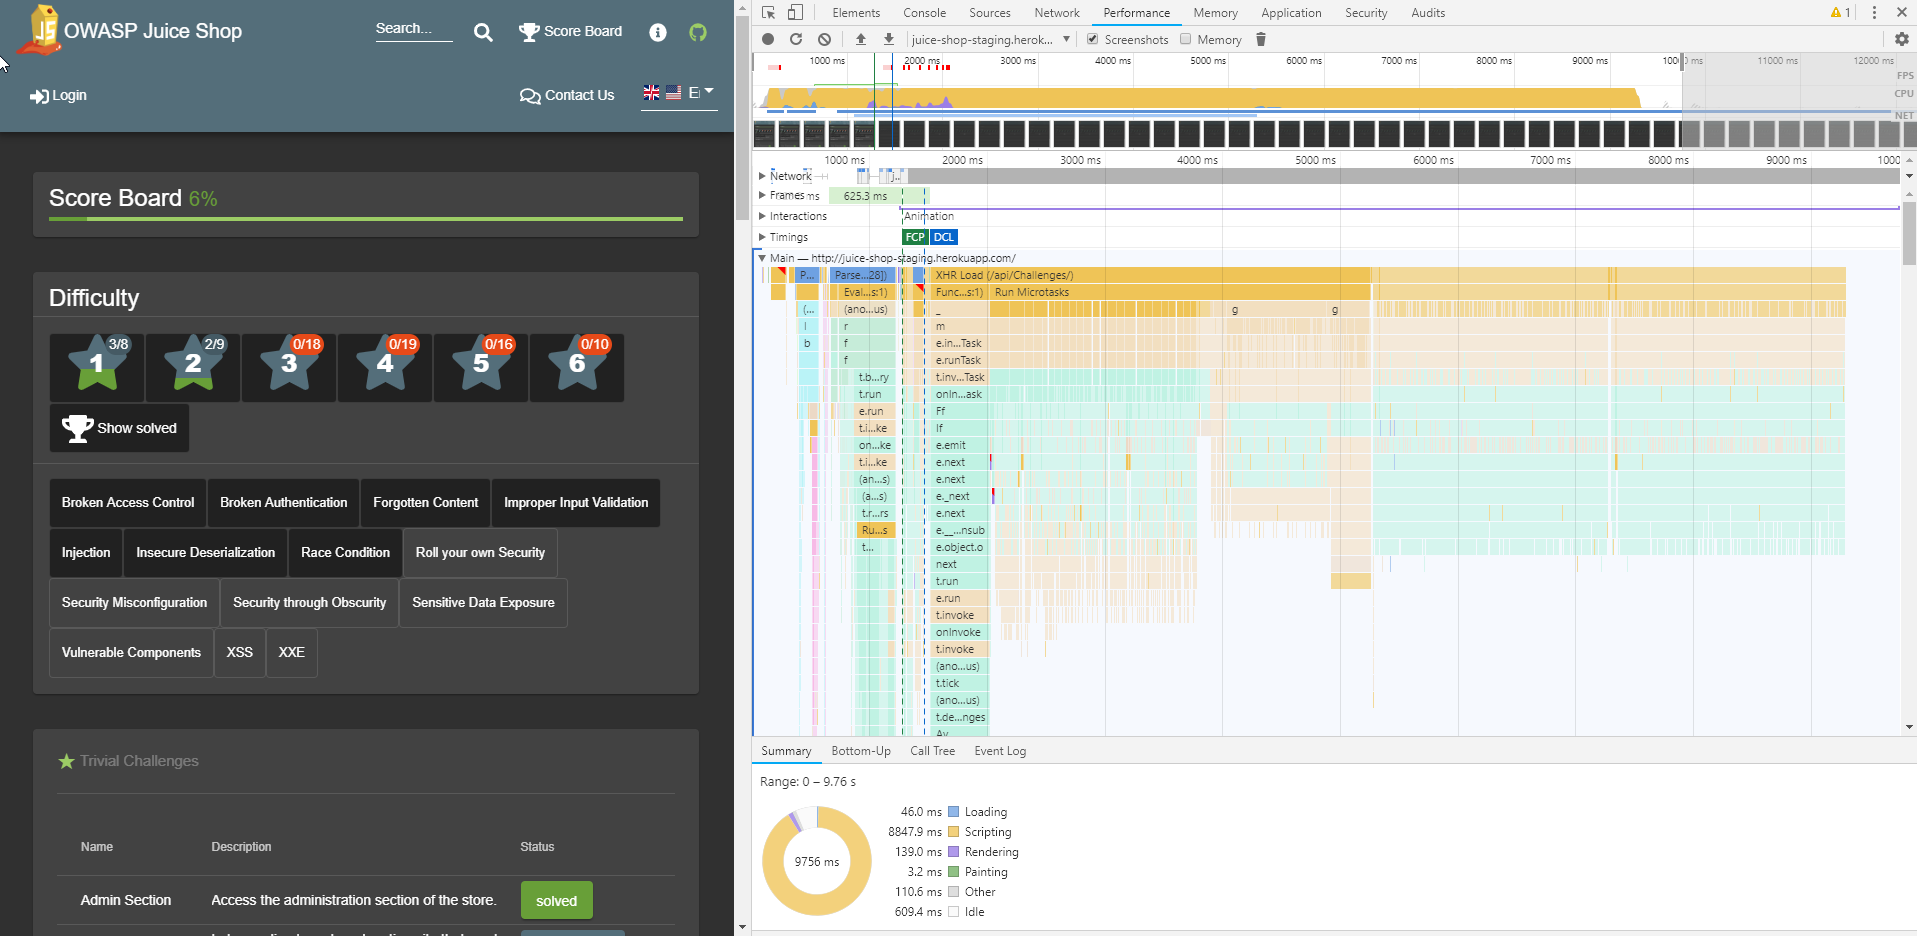
All but one category turned off
bkimminich
on 2 Mar 2019
I found the actual culprint of the remaining slow load time, which is in the HTML template:
          <button id="{{challenge.name}}.notSolved" mat-raised-button [color]="challenge.solved ? 'accent': 'primary'"
                  [hidden]="challenge.solved || challenge.disabledEnv" (click)="openHint(challenge)"
                  matTooltip="{{ showChallengeHints ? challenge.hint : null }}" matTooltipPosition="above">
            <span class="not-solved">
              <i class="fas fa-book" aria-hidden="true"
                 [hidden]="!showChallengeHints || !(challenge.hint || challenge.hintUrl)"></i>
              {{"STATUS_UNSOLVED" | translate}}
            </span>
          </button>
          <button id="{{challenge.name}}.solved" mat-raised-button [color]="challenge.solved ? 'accent': 'primary'"
                  [hidden]="!challenge.solved || challenge.disabledEnv" (click)="repeatNotification(challenge)"
                  matTooltip="{{ allowRepeatNotifications ? ('NOTIFICATION_RESEND_INSTRUCTIONS' | translate) : null }}"
                  matTooltipPosition="above">
            <span class="solved">
              <i class="far fa-flag" aria-hidden="true" [hidden]="!allowRepeatNotifications"></i>
              {{"STATUS_SOLVED" | translate}}
            </span>
          </button>
          <button id="{{challenge.name}}.unavailable" mat-raised-button [color]="challenge.solved ? 'accent': 'primary'" [disabled]="challenge.disabledEnv"
                  [hidden]="!challenge.disabledEnv"
                  matTooltip="{{ challenge.hint }}" matTooltipPosition="above">
            <span class="unavailable">
              <i class="fab fa-{{challenge.disabledEnv?.toLowerCase()}}" aria-hidden="true"></i>
              {{"STATUS_UNAVAILABLE" | translate}}
            </span>
          </button>
I still don't see it 🙈
What part of the template is causing it?
 J12934
on 6 Mar 2019
J12934
on 6 Mar 2019
The fact that there are three buttons with complicated conditional checks for [hidden] and all the other madness seems to slow it down. I'm trying to make this one button with probably even more complicated checks, but at least it's just happening once then... Hopefully that'll do it.
bkimminich
on 6 Mar 2019
Doesn't fulfill my own standards of "Clean Code" but load time is now down to <3sec ... :+1:
          <button
            id="{{challenge.name + '.' + (challenge.disabledEnv ? 'unavailable' : (challenge.solved ? 'solved' : 'notSolved'))}}"
            mat-raised-button [color]="challenge.solved ? 'accent': 'primary'"
            (click)="challenge.disabledEnv ? noop() : (challenge.solved ? repeatNotification(challenge) : openHint(challenge))"
            matTooltip="{{challenge.disabledEnv ? challenge.hint : (challenge.solved ? (allowRepeatNotifications ? ('NOTIFICATION_RESEND_INSTRUCTIONS' | translate) : null) : (showChallengeHints ? challenge.hint : null))}}"
            matTooltipPosition="above">
            <span class="{{challenge.disabledEnv ? 'unavailable' : (challenge.solved ? 'solved' : 'not-solved')}}">
              <i
                class="{{challenge.disabledEnv ? ('fab fa-' + challenge.disabledEnv?.toLowerCase()) : (challenge.solved ? 'far fa-flag' : 'fas fa-book')}}"
                aria-hidden="true"
                [hidden]="!challenge.disabledEnv && ((challenge.solved && !allowRepeatNotifications) || (!challenge.solved && (!showChallengeHints || !(challenge.hint || challenge.hintUrl))))"></i>
              {{challenge.disabledEnv ? "STATUS_UNAVAILABLE" : (challenge.solved ? "STATUS_SOLVED" : "STATUS_UNSOLVED") | translate}}
            </span>
          </button>
Reopening as the issue got worse again now that instead of 6 smaller mat-table instances a single one is loaded. The culprit seems to be the rendering time of the _Status_ column with its complex button inside.
I made some minor optimizations (like caching i18n labels or using trackBy) but it didn't help at all. I thought about externalizing the entire button into a ChallengeBadgeComponent but that would only move the problem - I guess... 😕
So, I'm hereby officially capitulating and ask/beg for help by __an actual Angular expert__! 🙏 ... If your's is the ultimate 💨 boost, I might send you a Juice Shop t-shirt of your choice! 👕
bkimminich
on 19 Jun 2019
Current state of the disaster is only 👇here👇, please don't use master, it is outdated by now!
https://github.com/bkimminich/juice-shop/tree/develop/frontend/src/app/score-board
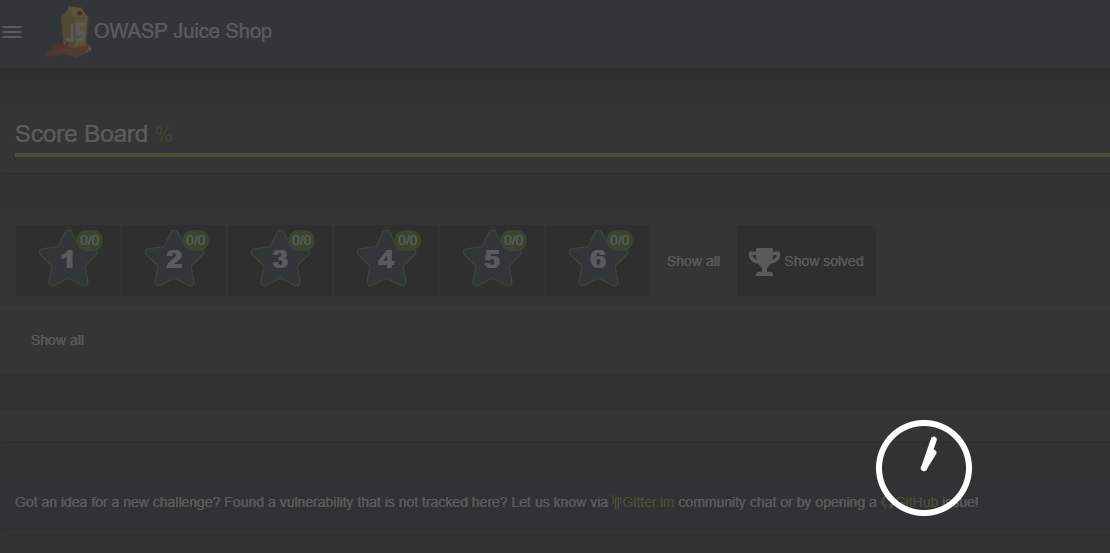
To "enjoy" it in full effect make sure that all categories and difficulties are selected. Then F5 and sit back...
bkimminich
on 19 Jun 2019
Latest update: I extracted a ChallengeBadgeComponent to get some better separation of concerns, code quality etc. but obviously this didn't change the performance in any way. The way I see it, the "culprit code" now is in ChallengeBadgeComponent and especially its template...
bkimminich
on 23 Jun 2019
Just for "fun" I replaced the entire mat-table with a regular HTML table using *ngFor - it loads as sluggish as before... 😭
bkimminich
on 24 Jun 2019
Introducing changeDetection: ChangeDetectionStrategy.OnPush into either ScoreBoardComponent and/or ChallengeStatusBadgeComponent increases the overall load time or even freezes it altogether.
bkimminich
on 25 Jun 2019
Would you be open to a PR that separated this into two buttons with conditional rendering?
<button
  *ngIf="!challenge.disabledEnv"
  id="{{ challenge.name + '.' + (challenge.solved ? 'solved' : 'notSolved') }}"
  mat-raised-button
  [color]="challenge.solved ? 'accent' : 'primary'"
  (click)="challenge.solved ? repeatNotification() : openHint()"
  matTooltip="{{
    challenge.solved
      ? allowRepeatNotifications
        ? ('NOTIFICATION_RESEND_INSTRUCTIONS' | translate)
        : null
      : showChallengeHints
      ? challenge.hint
      : null
  }}"
  matTooltipPosition="above"
>
  <span>
    {{
      challenge.solved
        ? ("STATUS_SOLVED" | translate)
        : ("STATUS_UNSOLVED" | translate)
    }}
  </span>
</button>

<button *ngIf="challenge.disabledEnv">
  <span>
    <i
      class="{{ 'icon-' + challenge.disabledEnv?.toString().toLowerCase() }}"
    ></i>
    {{challenge.disabledEnv ? ('STATUS_UNAVAILABLE' | translate)
  </span>
</button>
I've tested this approach and it renders much faster in my setup, <3 seconds.
 ronperris
on 2 Aug 2019
ronperris
on 2 Aug 2019
I tested your code and it's indeed that fast. You'd just be doing one "breaking change" as you'd remove the icons from the solved/unsolved button, i.e. the far fa-flag or fas fa-book depending on a hint link being available for unsolved challenges or the CTF mode being on for solved challenges (to re-send the flag code). Please check if it's faster to have that condition in the first button or split into a total of 3 buttons. Then, this as a PR will definitely win you a t-shirt and the eternal thanks of maaaaany Juice Shop users tired of the watching that spinner... :-D
bkimminich
on 2 Aug 2019
@ronperris I just implemented the split into two buttons but left the icons in - and load times were still as slow as before. I'll try a split into three buttons next, but it seems that _the icons_ are the true culprit here... :-)
bkimminich
on 5 Aug 2019
Split into three buttons is still equally slow... I'll replace the FontAwesome icons with Material Design Icons and see if that helps.
bkimminich
on 5 Aug 2019
Switching from FontAwesome icons to <mat-icon> actually brings the performance boost, so it seems those FA icons were the performance culprit all along. I'll keep the split into three buttons because it's easier to read, but actually it doesn't make a difference in speed.
Will backport the <mat-icon> switch into a bugfix release v8.7.3 so people don't have to wait for v9.0.0 to get their _Score Board_ tuned.
bkimminich
on 5 Aug 2019
Related issues
bkimminich
·
6Comments
 teodor440
·
6Comments
bkimminich
·
5Comments
bkimminich
·
7Comments
bkimminich
·
4Comments
teodor440
·
6Comments
bkimminich
·
5Comments
bkimminich
·
7Comments
bkimminich
·
4Comments
Most helpful comment
Current state of the disaster is only 👇here👇, please don't use
master, it is outdated by now!https://github.com/bkimminich/juice-shop/tree/develop/frontend/src/app/score-board
To "enjoy" it in full effect make sure that all categories and difficulties are selected. Then
F5and sit back...