Jss: deleteRule causes lag when deleting many nodes
Hello, I noticed that when using with React, JSS causes a lag when removing many nodes.
This is screenshot when removing 80 000 nodes.

__Versions (please complete the following information):__
- jss: 10.4.0
- Browser: Chrome
- OS: macOS
 mario1ua
All 34 comments
Interesting, can you reproduce it on codesandbox?
 kof
on 8 Oct 2020
kof
on 8 Oct 2020
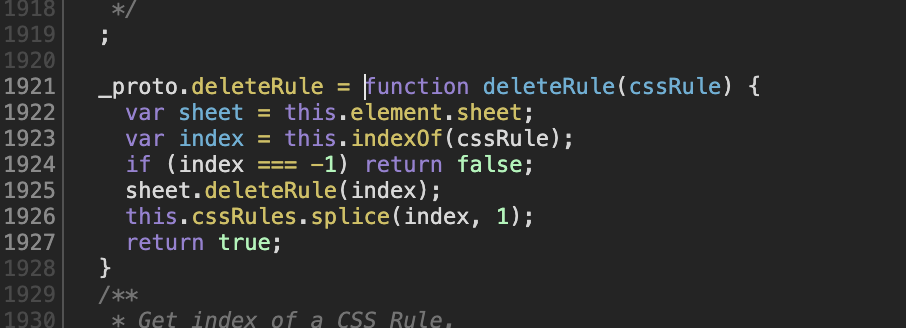
This seems to be the code that is causing it https://github.com/cssinjs/jss/blob/master/packages/jss/src/DomRenderer.js#L427
But I need to see it for myself.
I assume t.deleteRule that I see there is DomRenderer.deleteRule and I need to open that up and see which call inside that function is doing it.
kof
on 8 Oct 2020
This seems to be the code that is causing it https://github.com/cssinjs/jss/blob/master/packages/jss/src/DomRenderer.js#L427
Yes, this is exactly the place, and more precise is this.indexOf() of DomRenderer

I will try to create a simulation on codesandbox but a little bit later.
mario1ua
on 9 Oct 2020
That is clear now sheet.cssRules is the native CSSOM api and iterating over those seems to be too slow. We need to somehow work this around.
kof
on 9 Oct 2020
Another thing is I don't know how realistic this scenario is with 80k nodes. It can only be slow in such artificial scenario I think.
kof
on 9 Oct 2020
@kof in my case it was quite massive table, containing many different controls, dropdowns etc.
Probably this is an edge case, but anyway wanted to report this behavior. Thanks for checking.
mario1ua
on 9 Oct 2020
This is actually quite a common thing: detaching 200 nodes takes almost a second in a development mode, which makes development almost unreal. 200 nodes is not a lot -- it's only 20 table rows with 5-6 columns, when there are buttons or checkboxes inside of the table cells.
VCSSOM ? :)
 yhaskell
on 10 Nov 2020
yhaskell
on 10 Nov 2020
@yhaskell can you make a realistic demo on codesandbox? deleteRule is still very fast, it takes only a few milliseconds, there must be something else going on.
kof
on 10 Nov 2020
@kof https://codesandbox.io/s/dazzling-buck-dpyzz here is an example. hiding/showing table is already considered a long event by chrome
yhaskell
on 10 Nov 2020
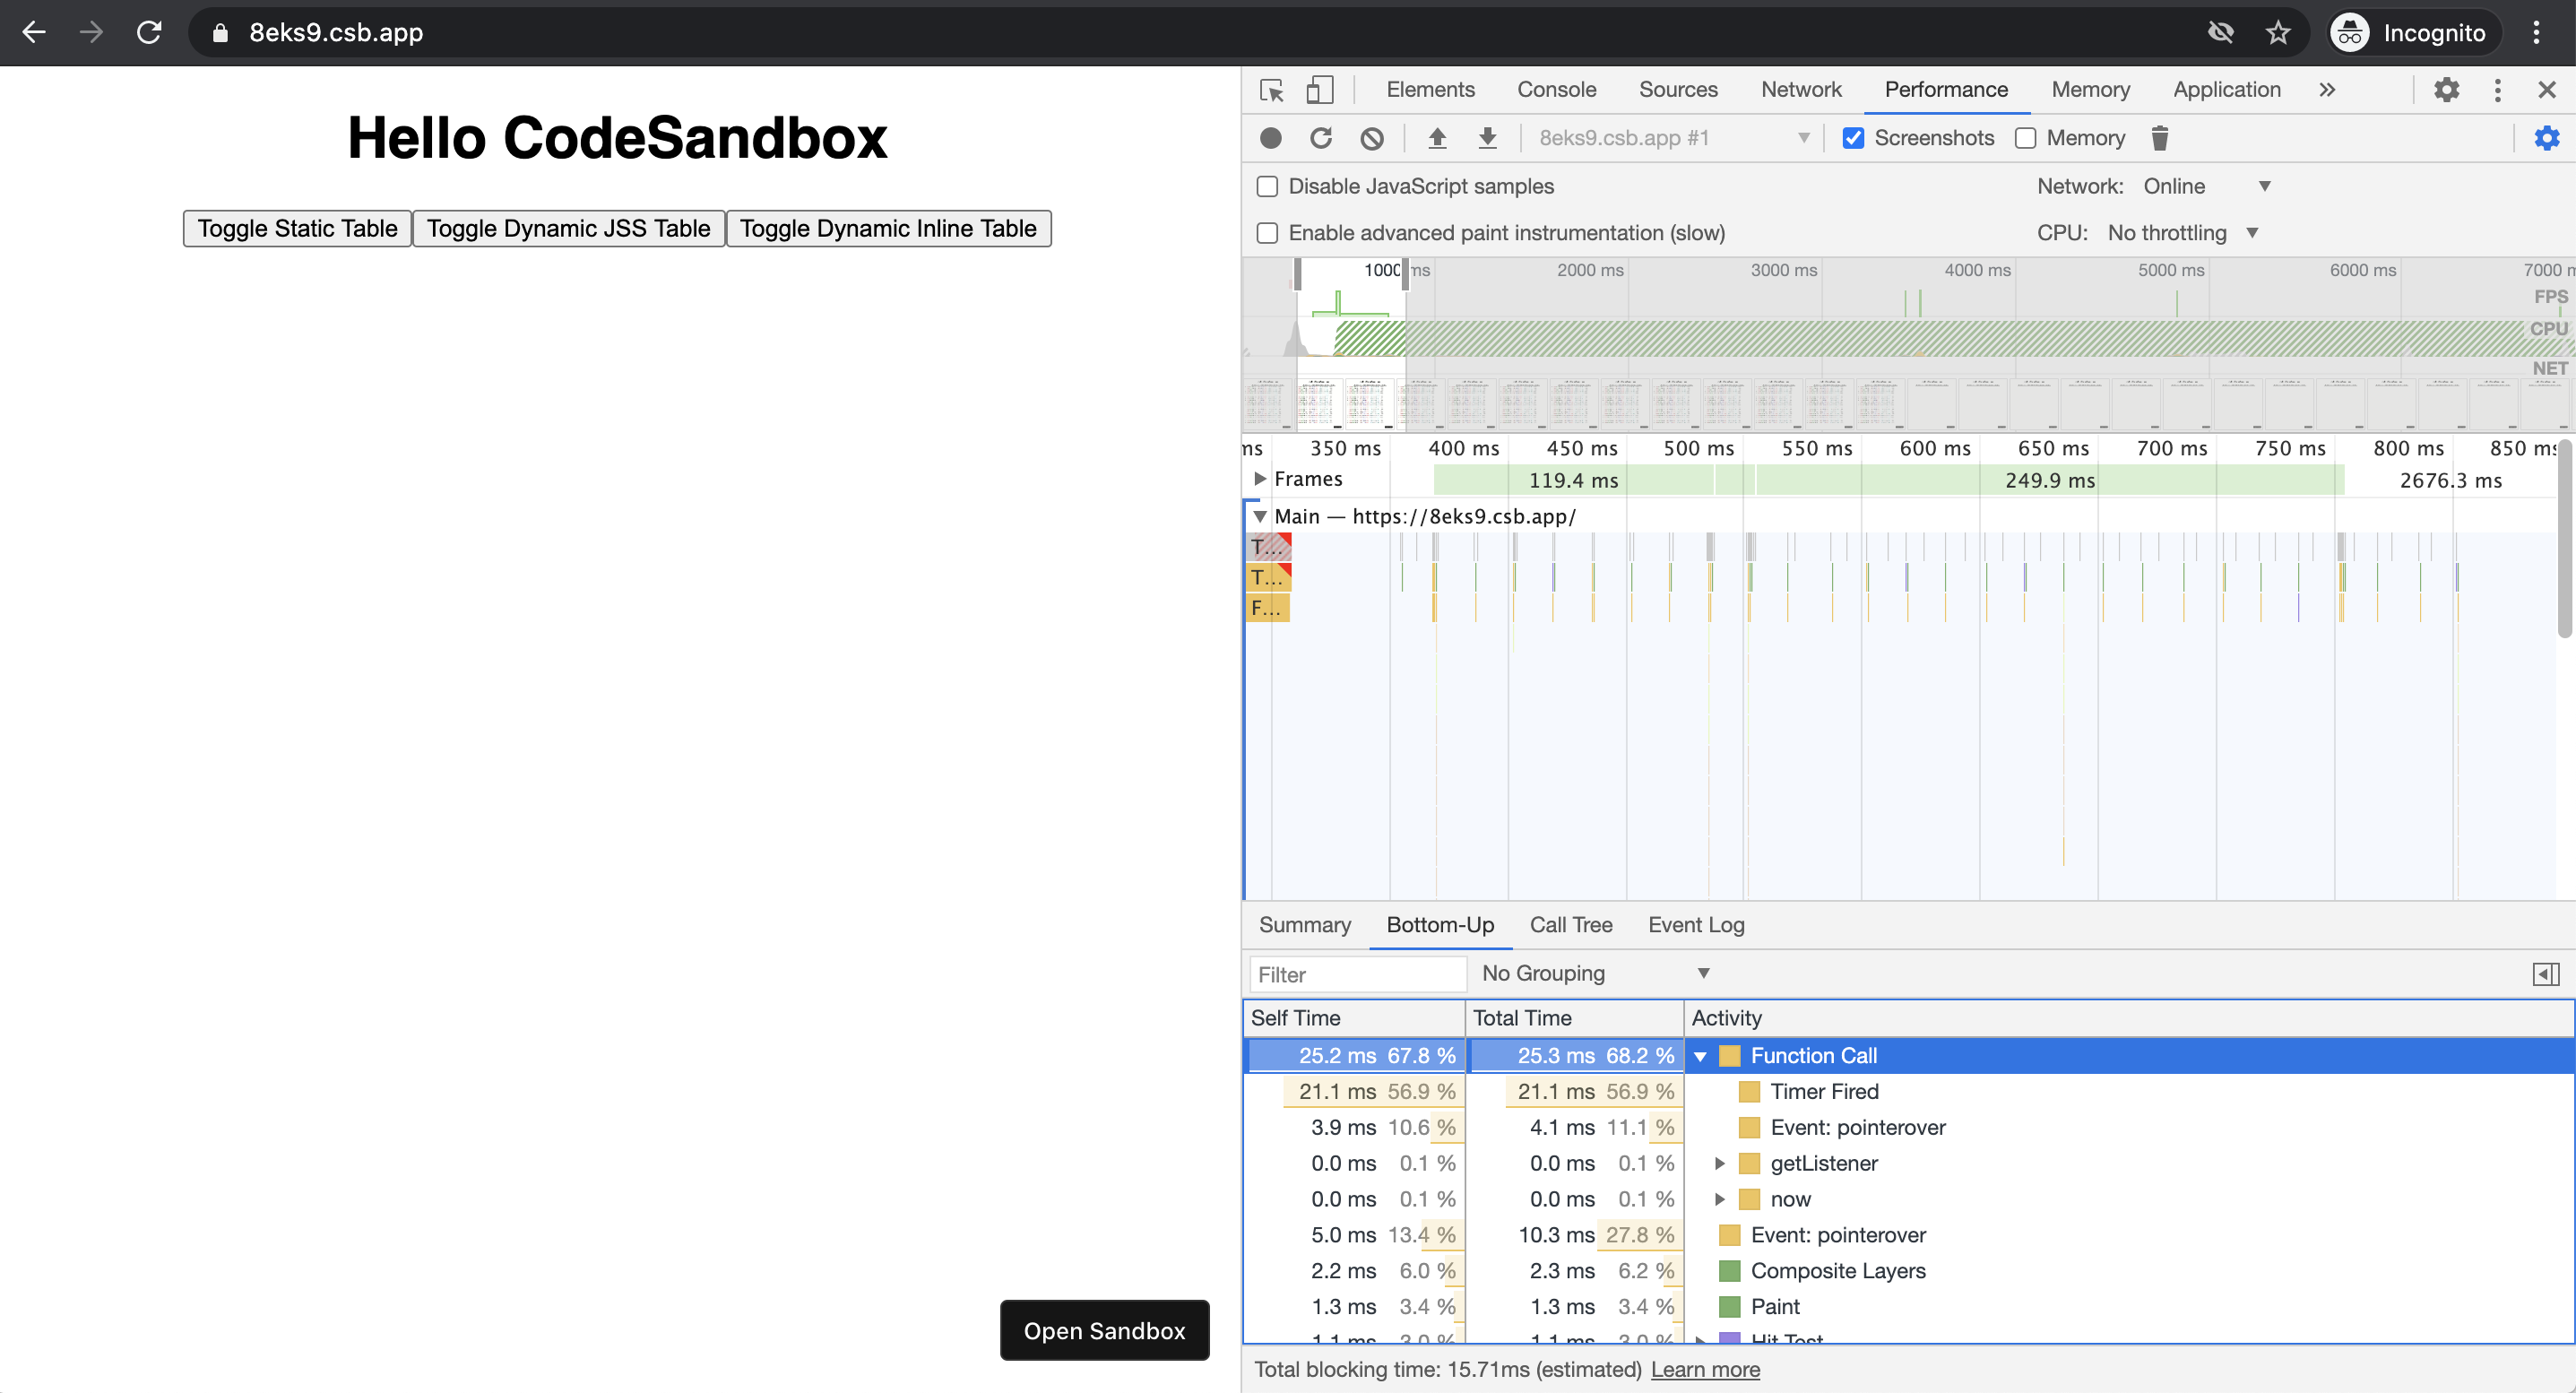
I made some tests based on your example, here is a modified sandbox, it has now 3 rendering modes: static, jss and inline
https://codesandbox.io/s/twilight-breeze-8eks9
JSS renders twice slower than the static and inline variants, using 250ms vs 130ms. We definitely should optimize that and I would support efforts in this direction.
But I am wondering how this performance difference can result in something "almost unreal" as you say.
Static:
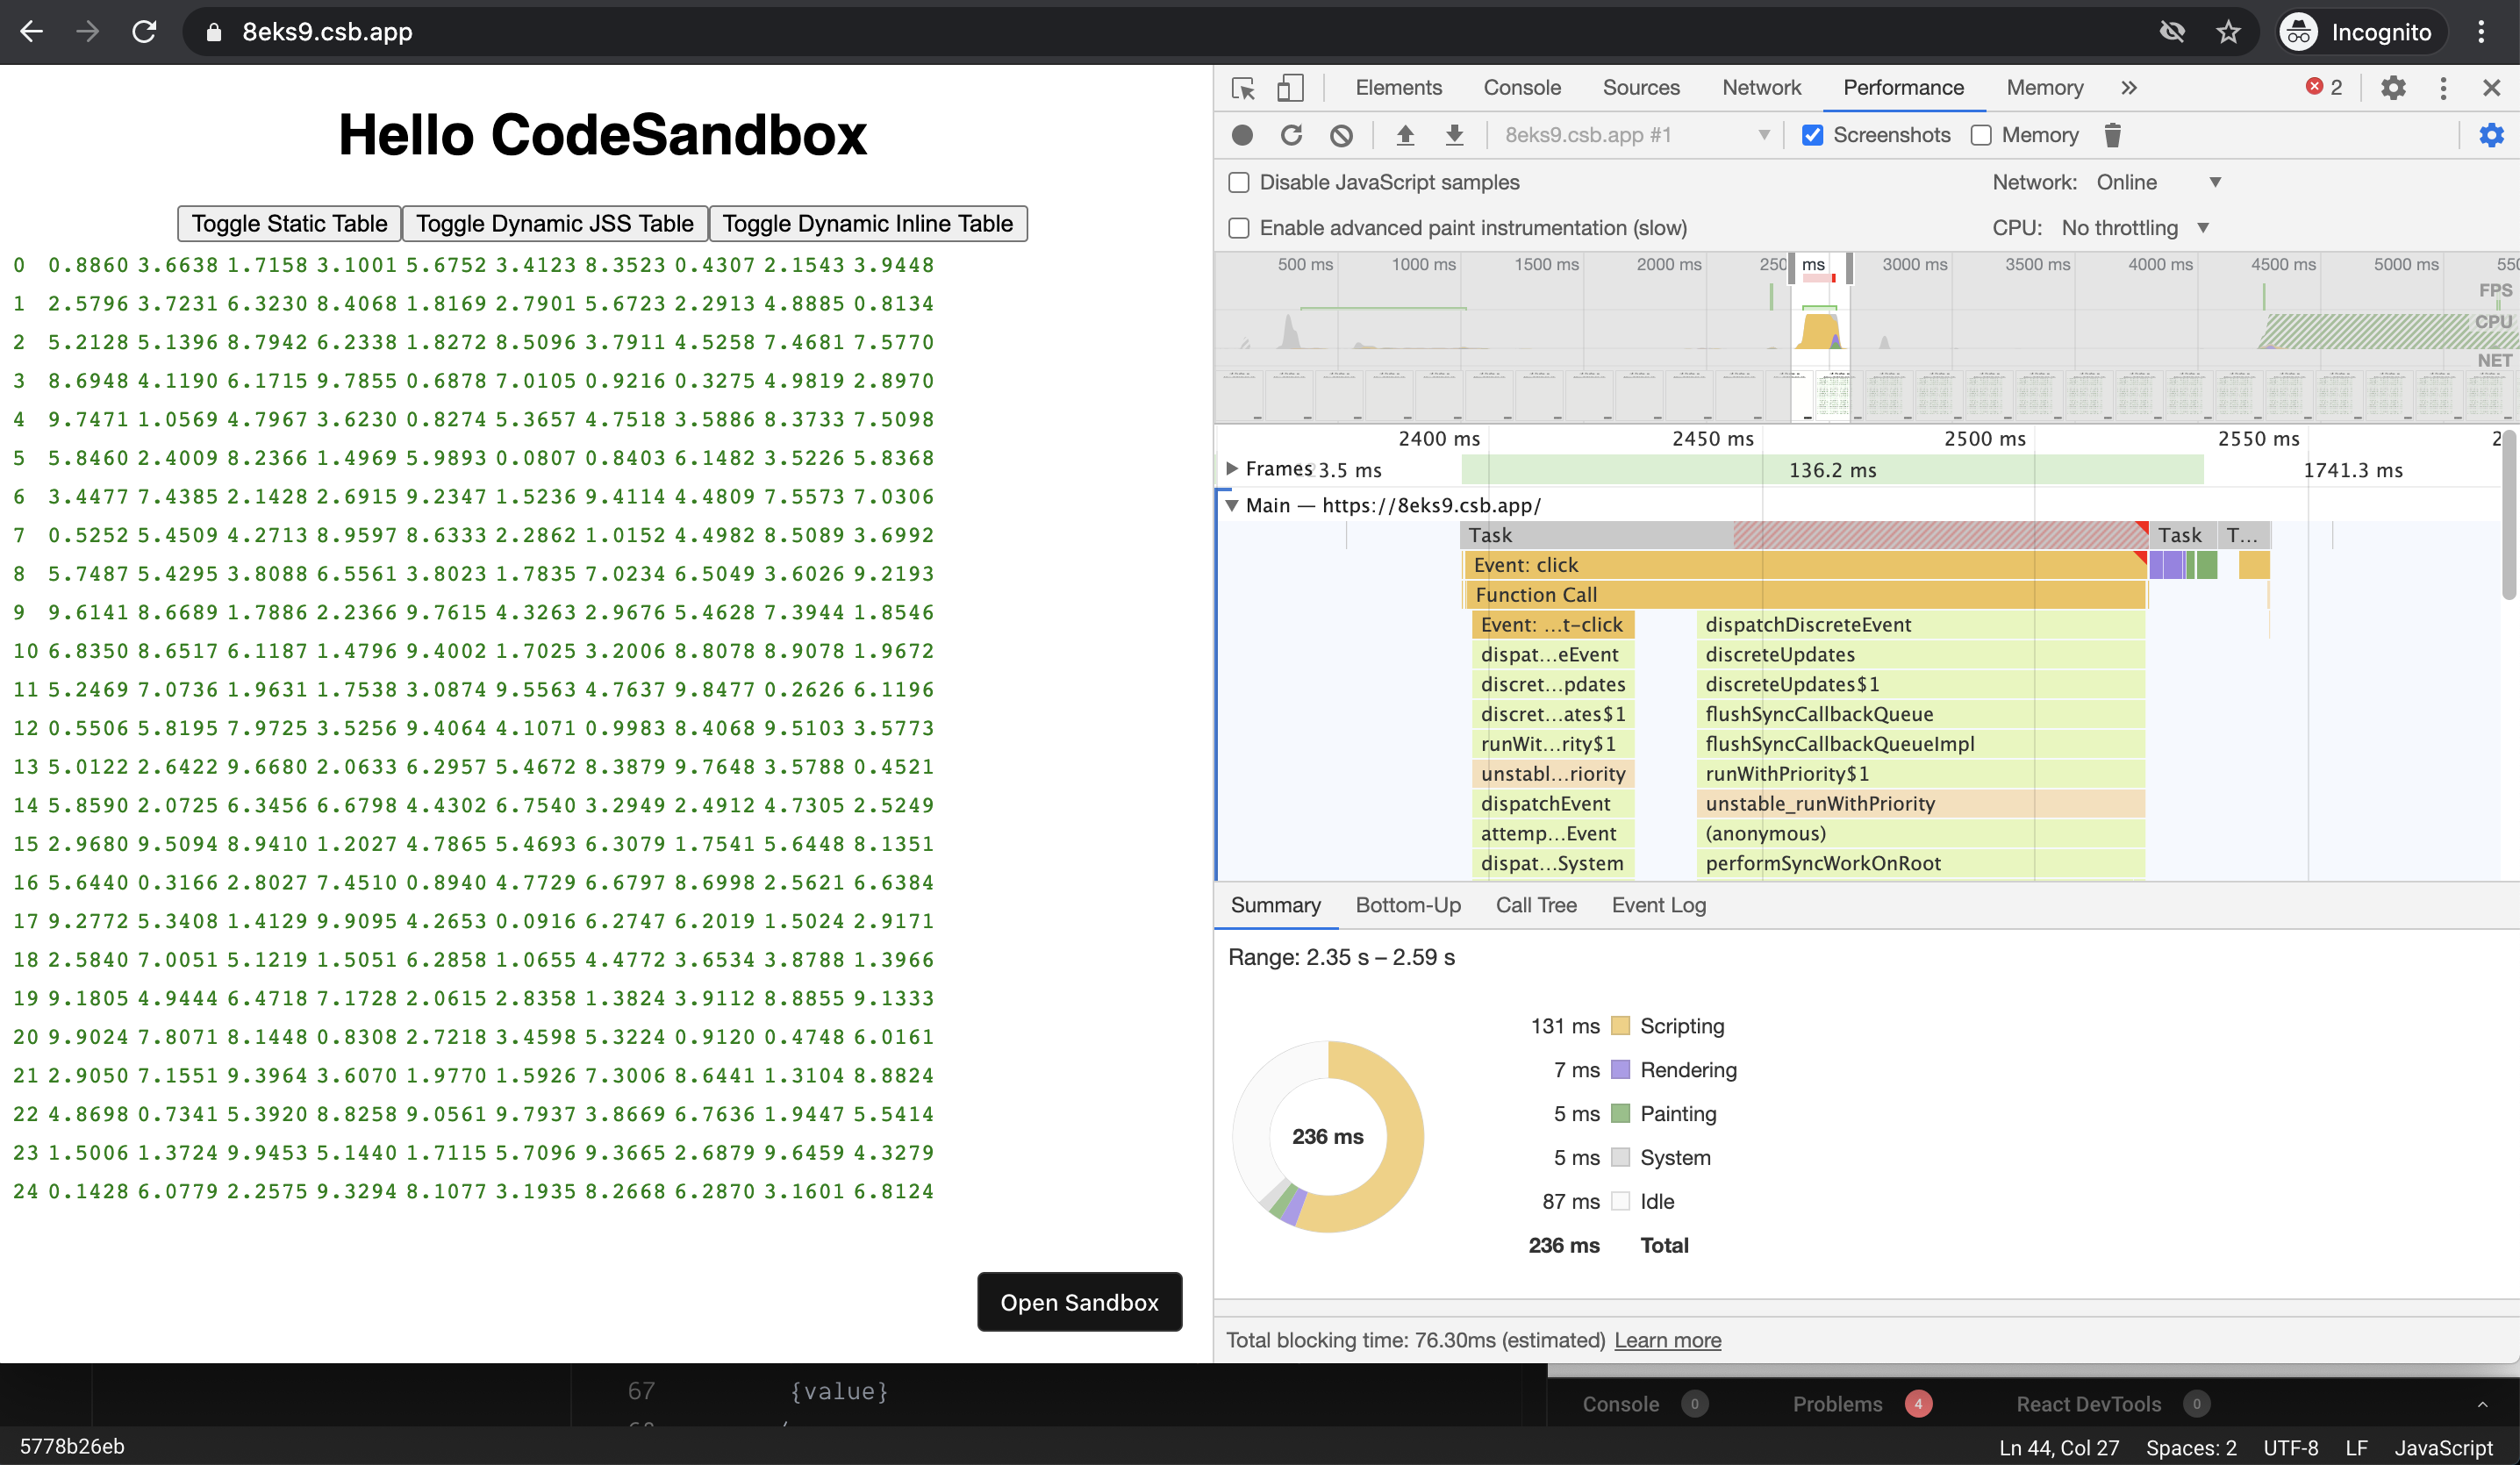
JSS:
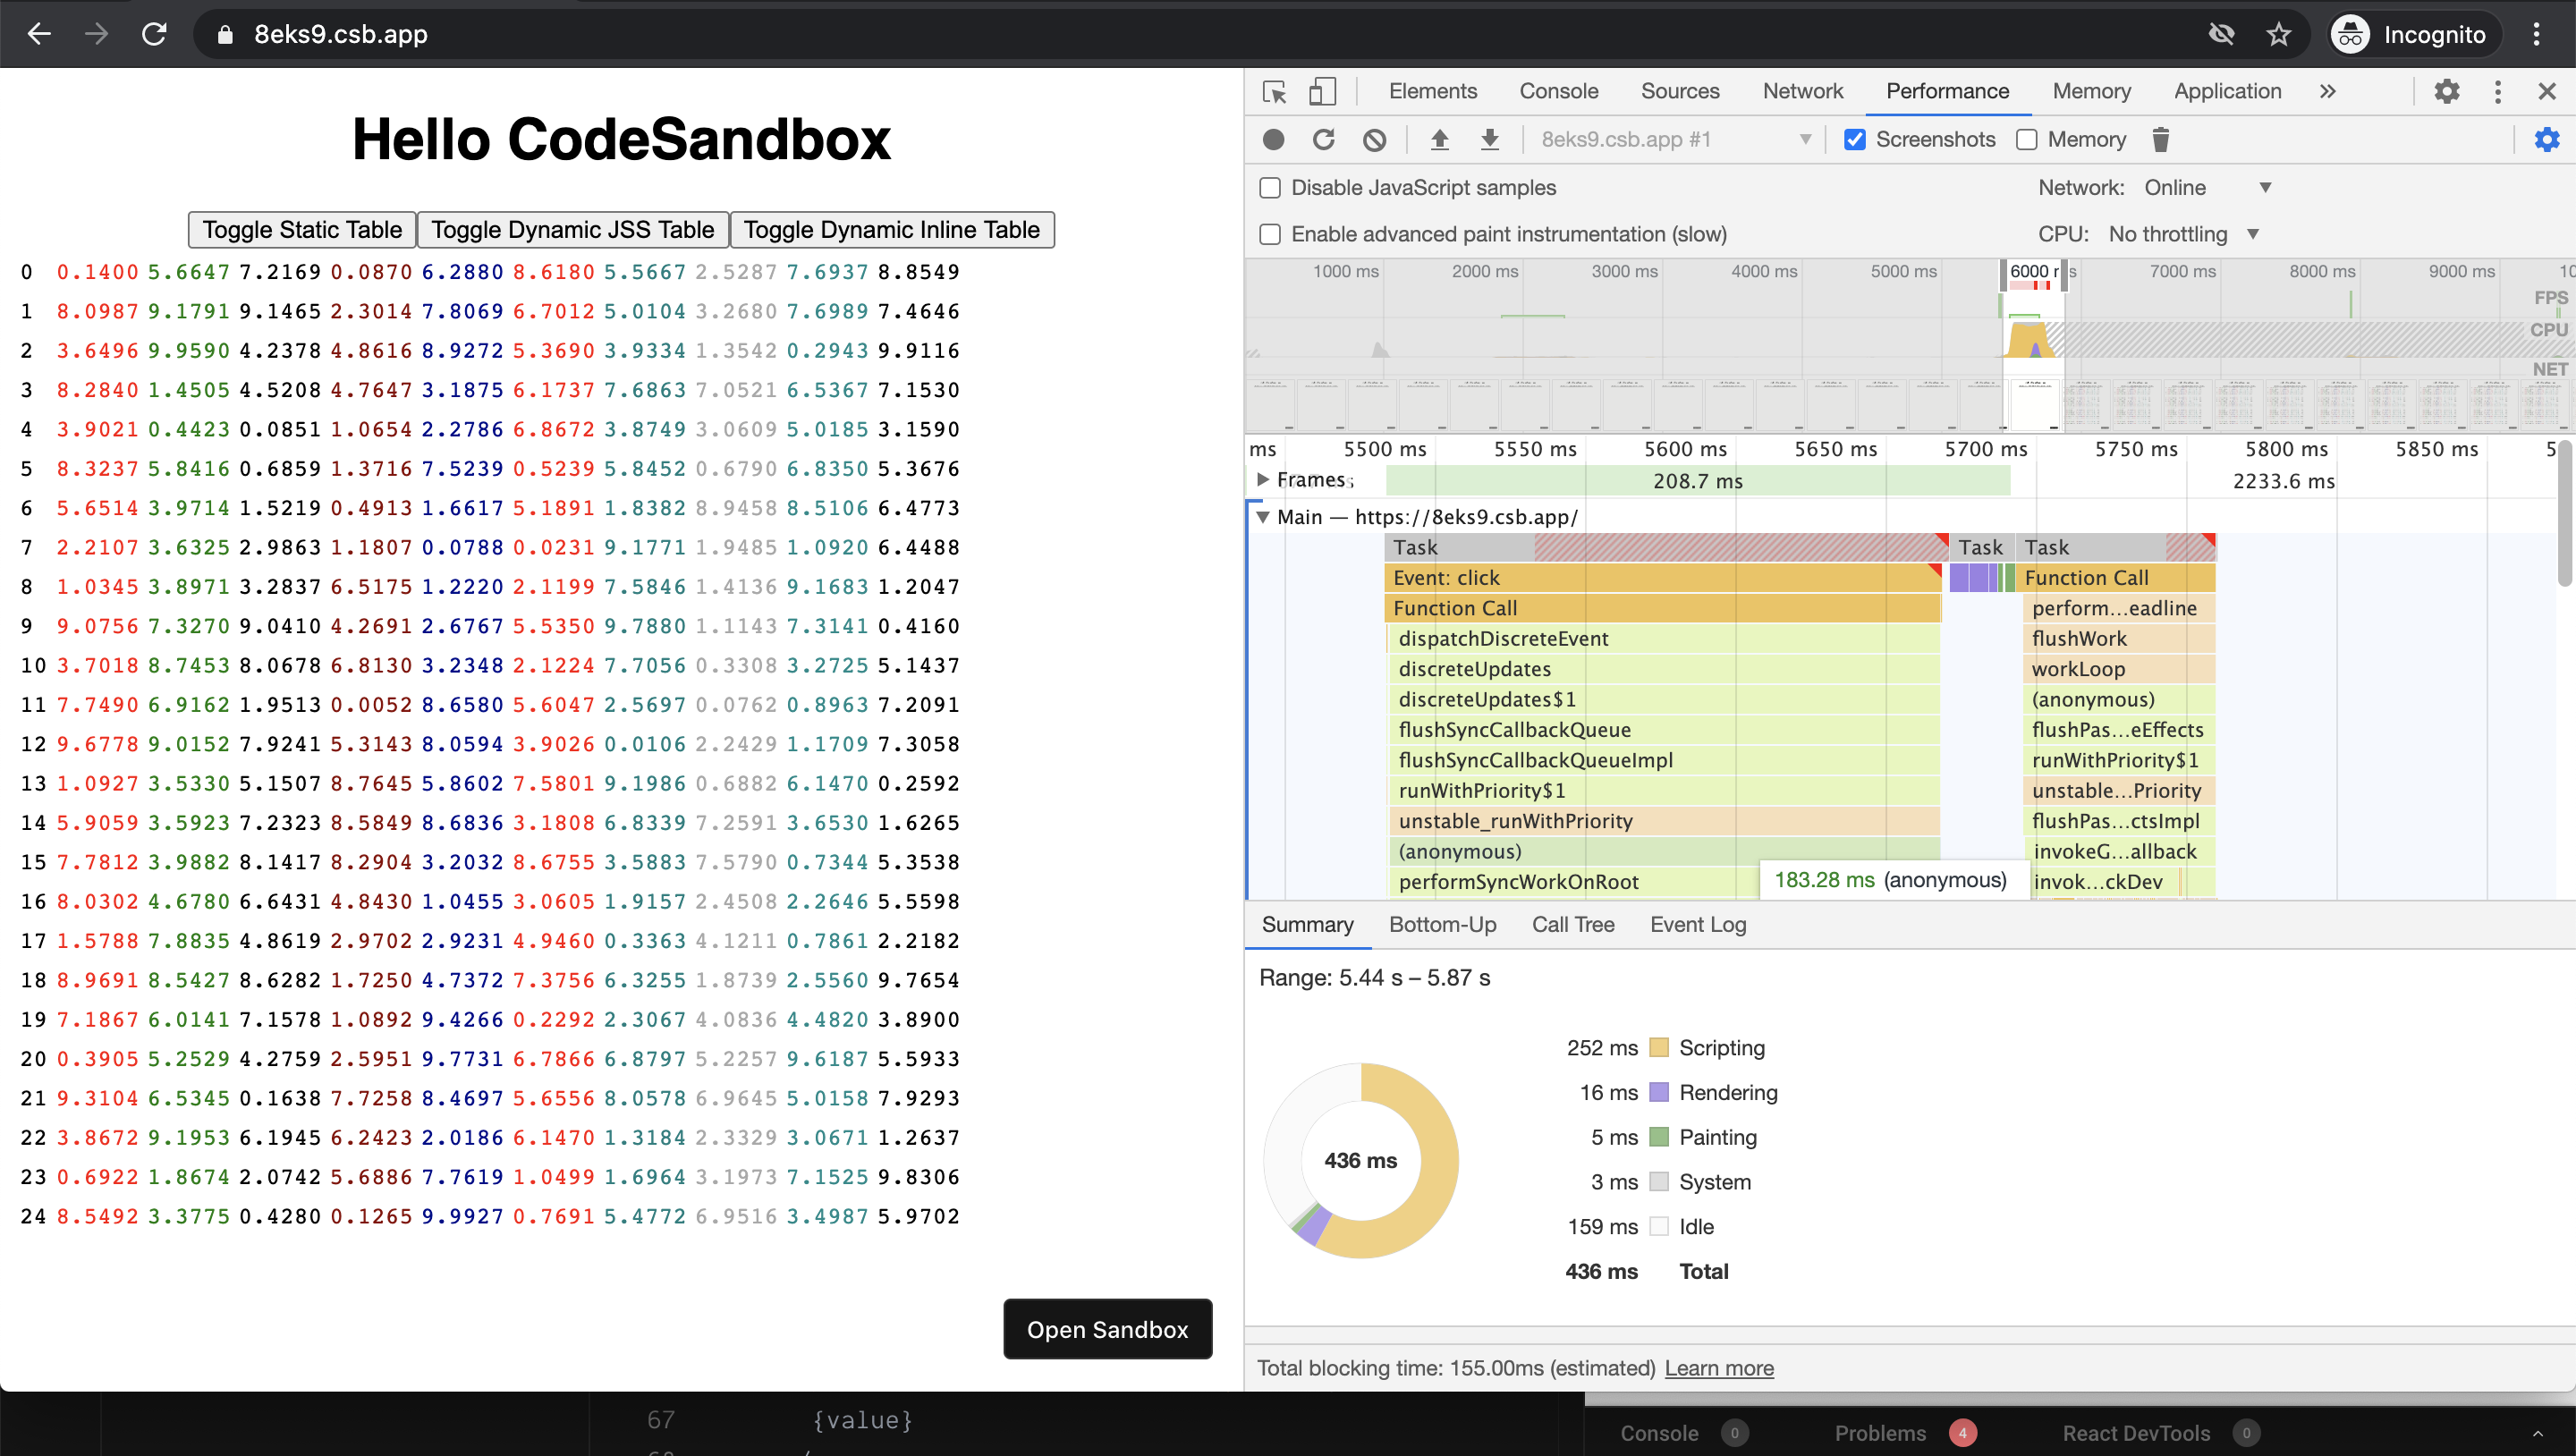
Inline:

kof
on 10 Nov 2020
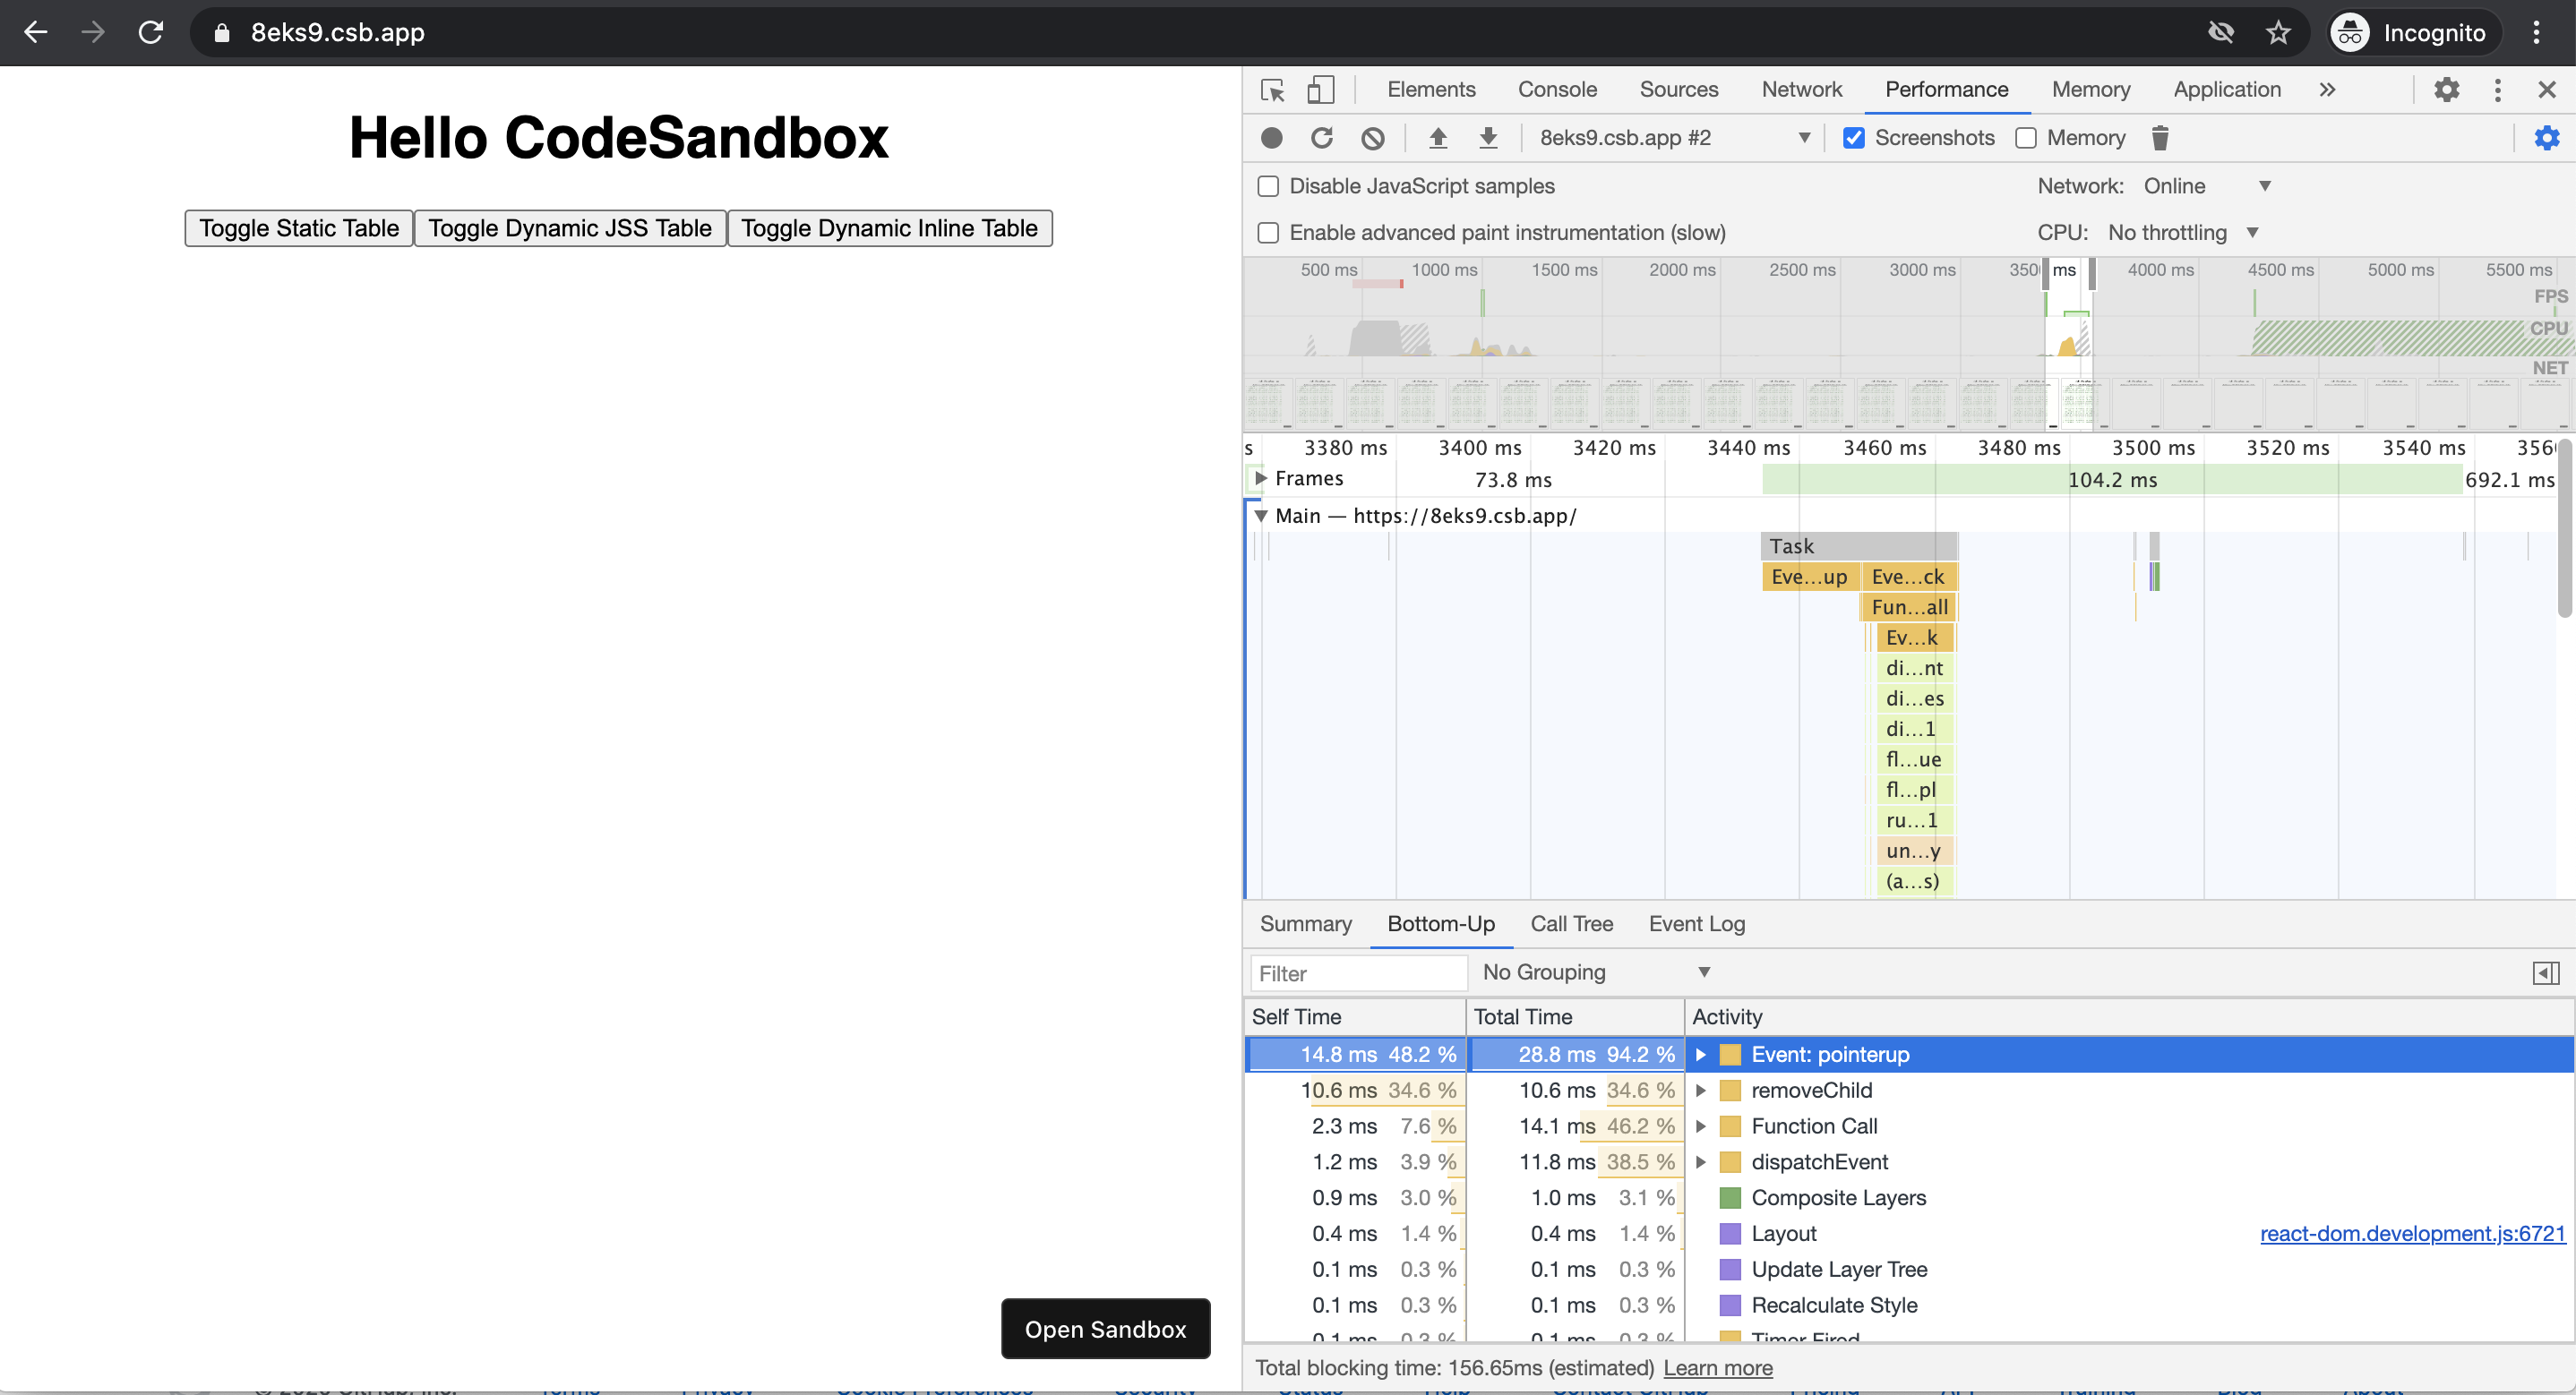
For me on the updated demo there is 25x perf difference (please note that we talk about unmount -- i am a little bit confused about the rendered table on the screenshots:
- static table

- inline style

- dynamic jss

yhaskell
on 10 Nov 2020
Regarding my comment on "almost unreal" -- this is more about the fact that, when combined with apollo and react devtools it becomes unbearable. (I don't think that is specifically a problem of jss though)
yhaskell
on 10 Nov 2020
The way I tested:
- Open in incognito/privacy mode
- Reload before each test
- Click on record, click on render
There should be no unmount because you are in this particular case not unmounting because you are reloading.
kof
on 10 Nov 2020
There should be an unmount since the issue is about perf issue when _deleting_ many nodes :)
yhaskell
on 10 Nov 2020
Right, but it's not what I tested right now, to test unmount I need to record the "hiding" of the table, gonna do this now.
kof
on 10 Nov 2020
Static
Dynamic JSS
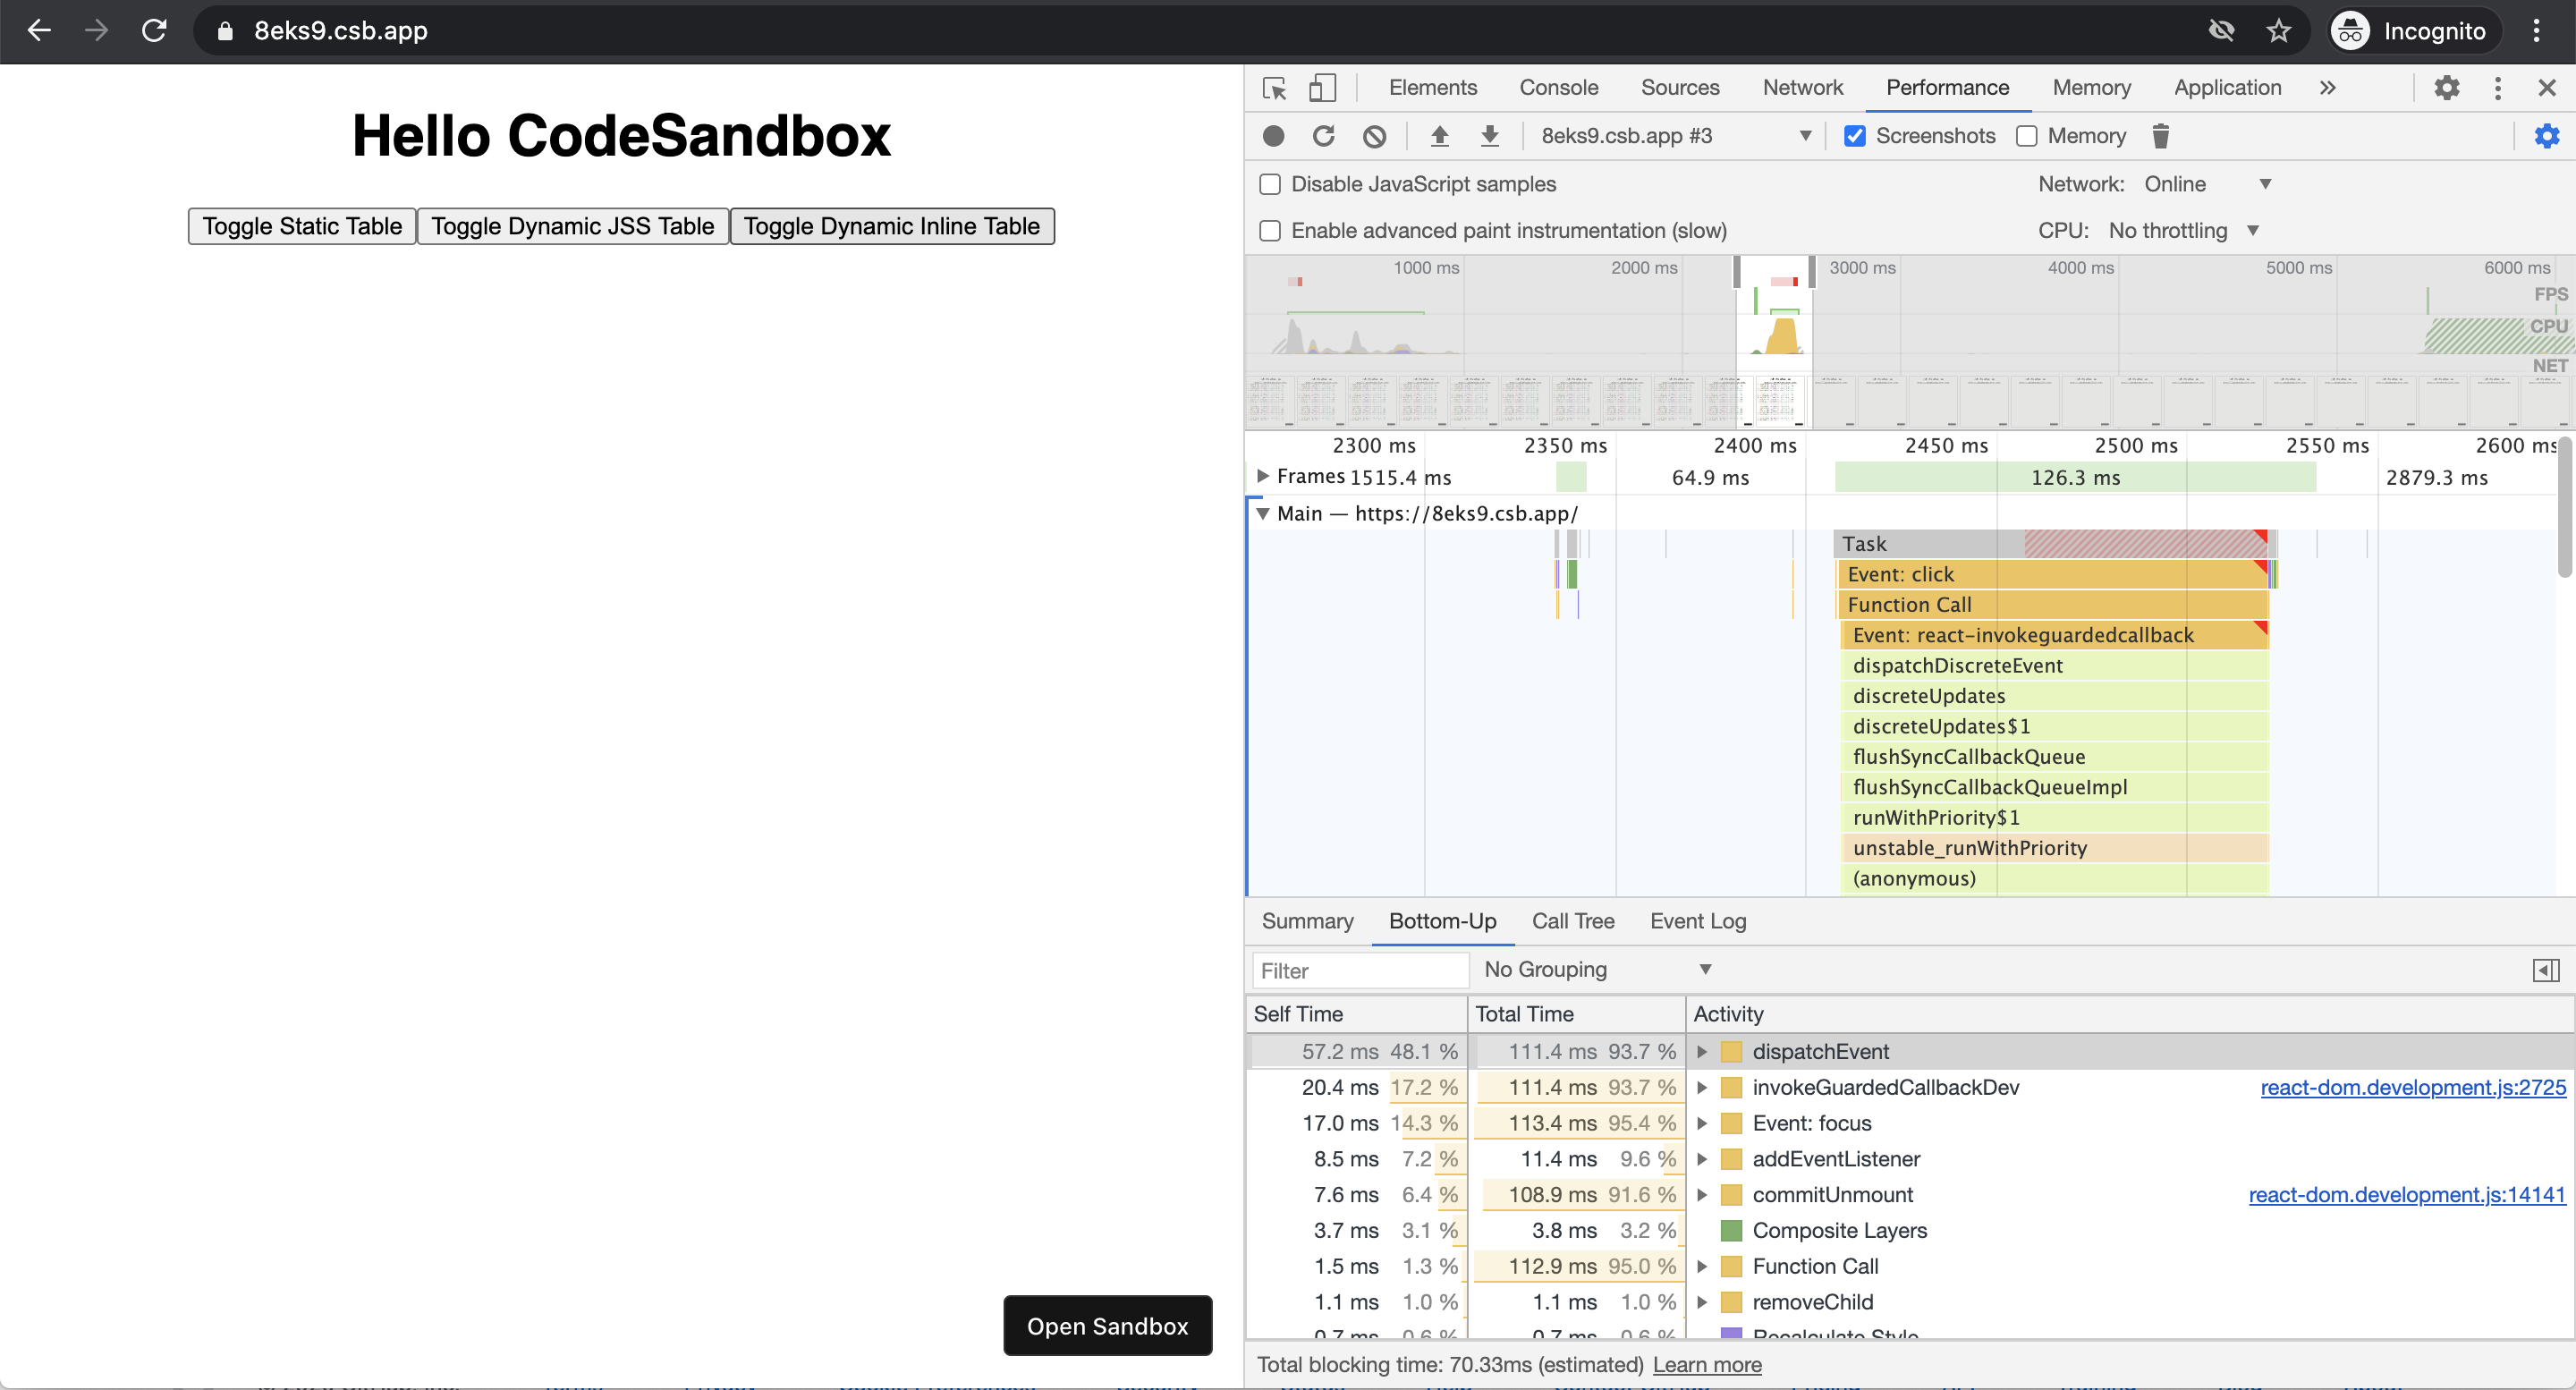
Dynamic inline
kof
on 10 Nov 2020
I don't even see a noticeable overhead with unmount with this test.
kof
on 10 Nov 2020
From your own screen unmount with jss takes around 110 ms, where as the static version takes around 10ms
yhaskell
on 10 Nov 2020
You are looking at dispatchEvent, right? I was trying to follow this through into JSS call but dev tools actually only showed there React calls, mb tooling problem
kof
on 10 Nov 2020
I usually look at the whole time the event handler for onclick takes to process. Since the only change is that with jss you have a useStyles hook, which on unmount runs removeDynamicRules function, I find it as quite close interpretation of the jss overhead. (which might be a little bit misleading, but I think I'm going to allow myself that)
yhaskell
on 10 Nov 2020
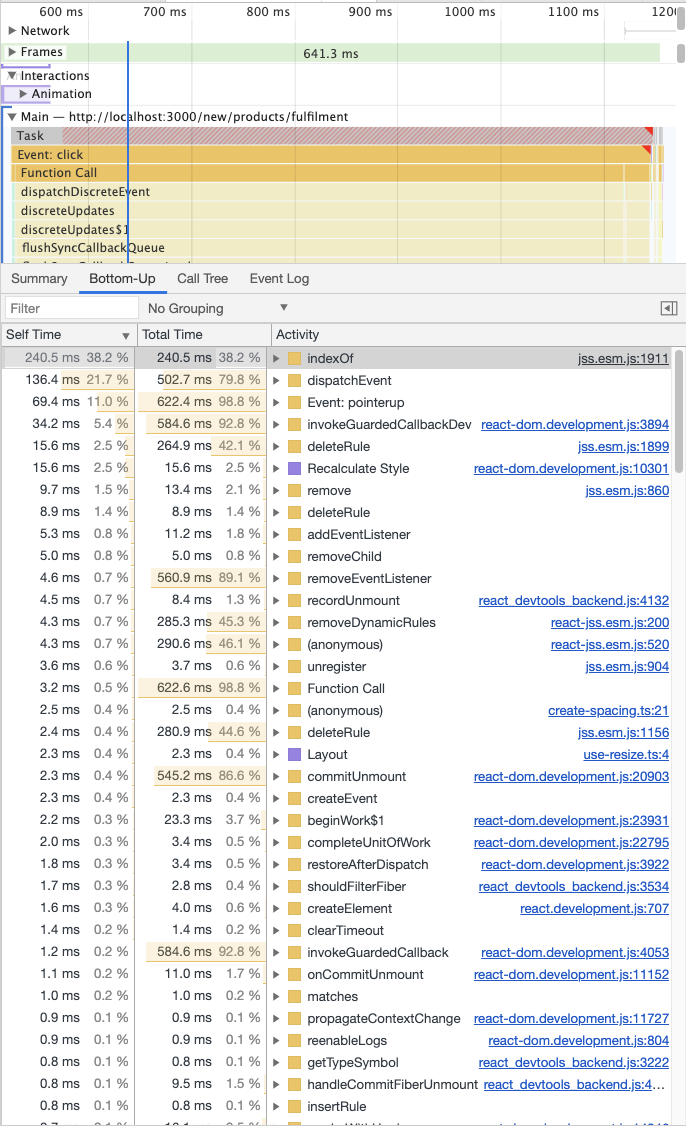
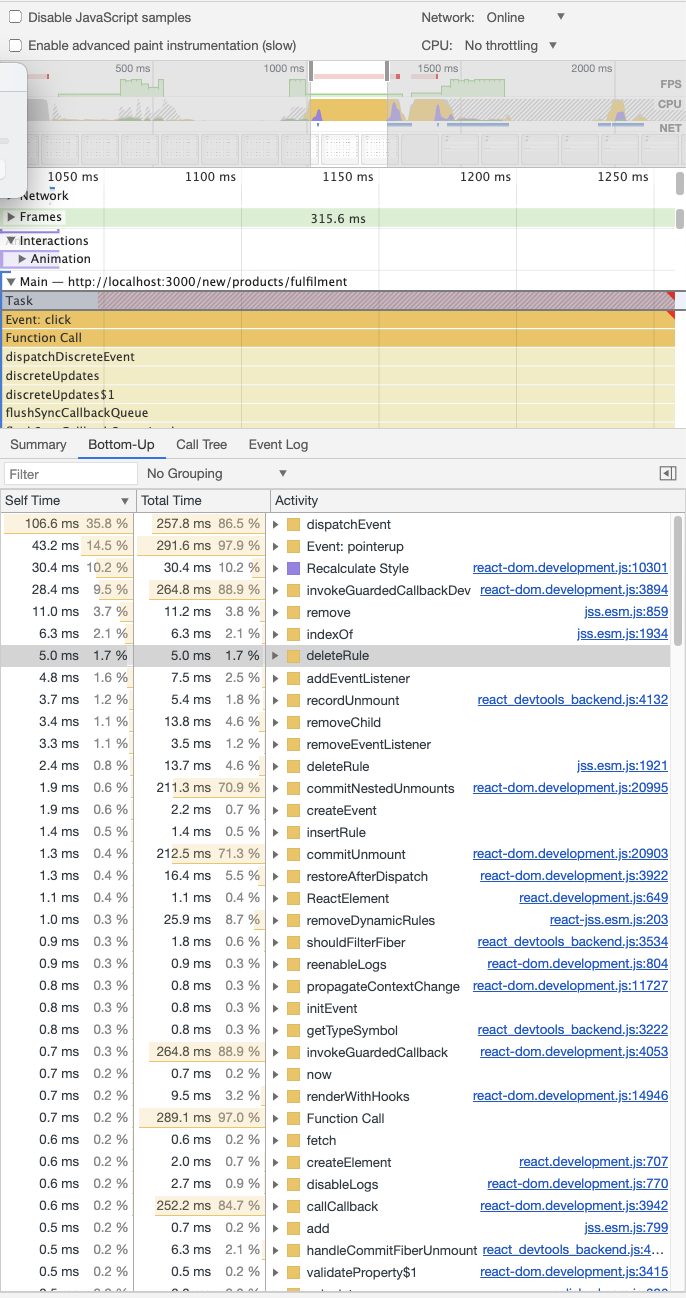
I increased the amount of data items from 10 to 50 to get a more clear picture and yeah, it's once again DomRenderer.indexOf:

kof
on 10 Nov 2020
The only option I see is to avoid iterating over CSSOM to find the index of a rule and instead keep own registry.
If anyone wants to invest time and fix this or alternatively sponsor me to work on this let me know.
kof
on 10 Nov 2020
I have done some testing, I think the profiler output was misleading ... you can verify that by commenting out the deleteRule method. In my case it saved almost nothing.
In the end what actually removed the entire overhead is removing the cleanup function from here
This is quite unexpected, especially since just removing contents of the cleanup function didn't change the perf overhead, only after I actually removed the cleanup function all that overhead disappeared.
kof
on 12 Nov 2020
I am releasing a fix for deleteRule/indexOf performance, need you to test on your machines and products to confirm it got much better
kof
on 13 Nov 2020
Released in https://github.com/cssinjs/jss/releases/tag/v10.5.0
@yhaskell @mario1ua please try it out and post your profiler output, ideally with real world product with before and after
kof
on 15 Nov 2020
Can confirm a huge perf improvement:
before:
after:
yhaskell
on 16 Nov 2020
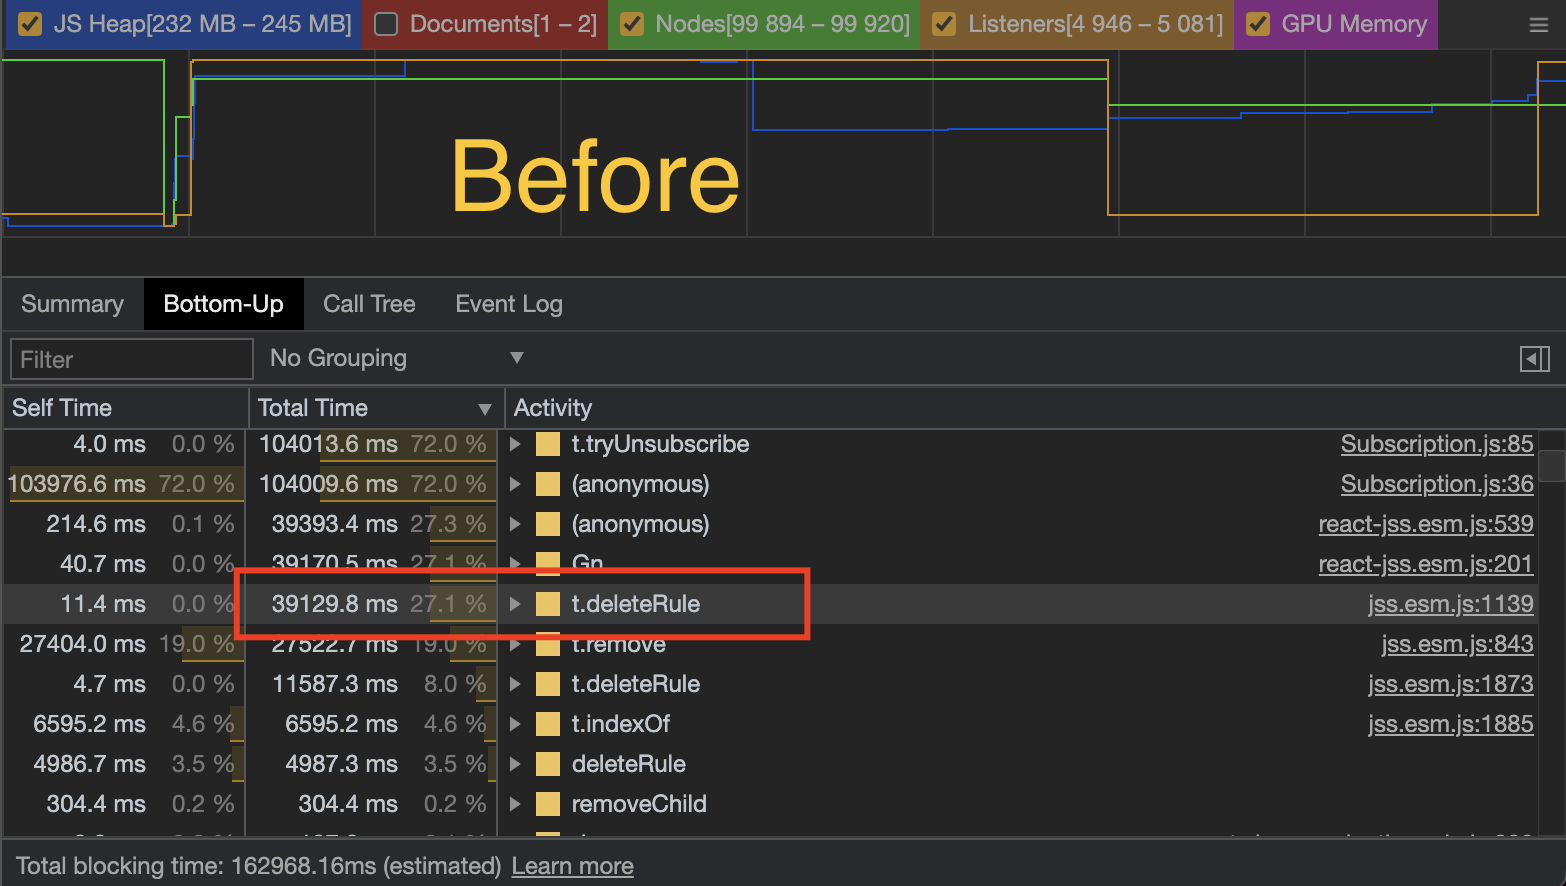
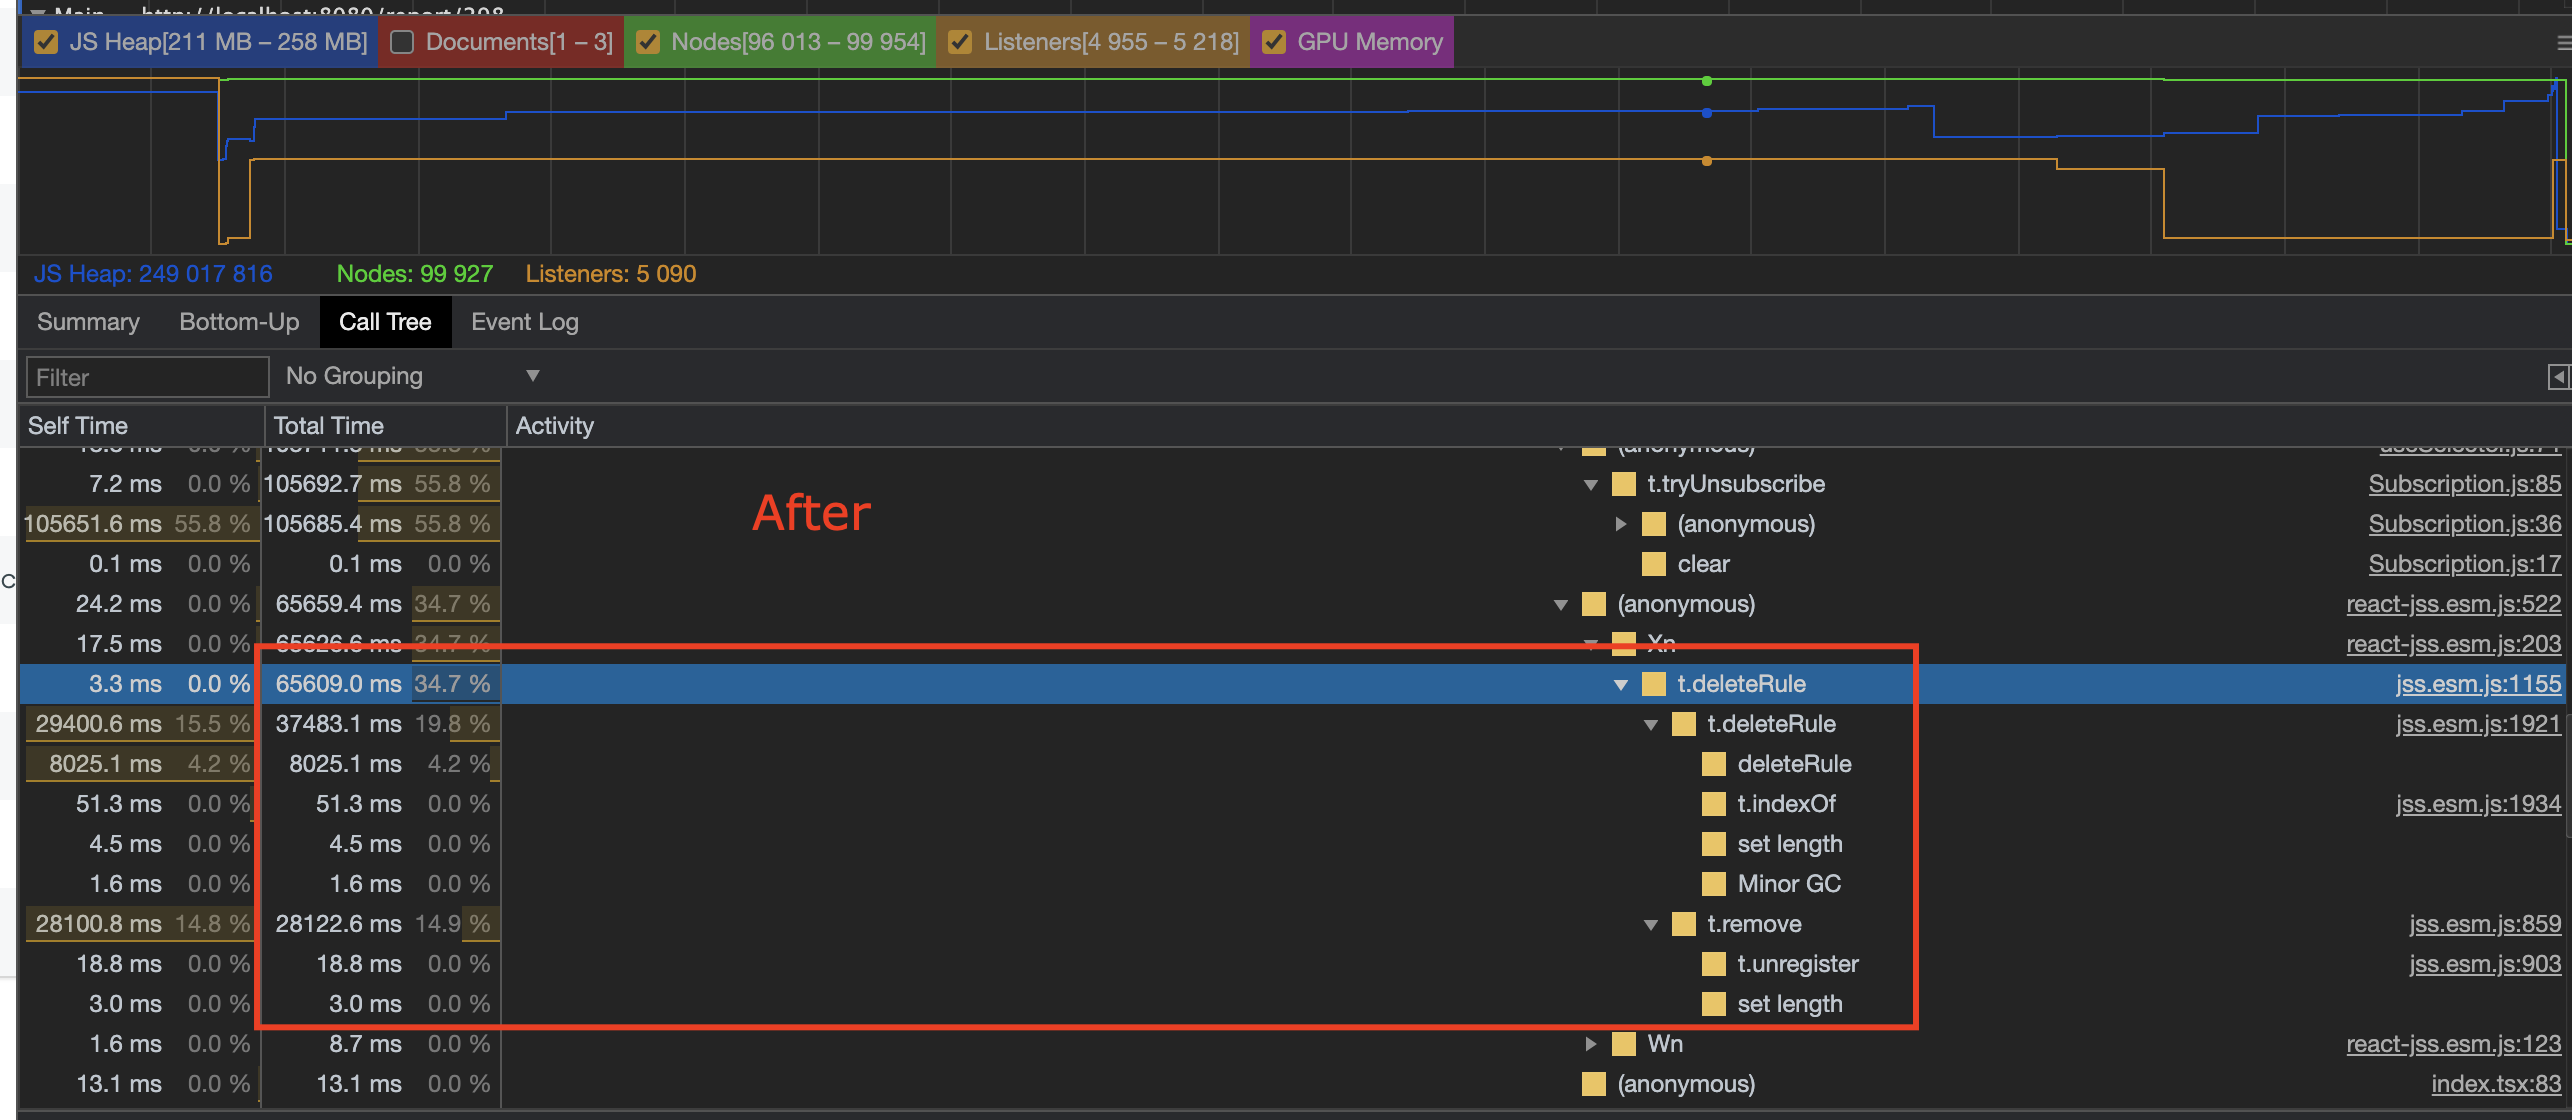
@kof Oleg, interesting thing, according to my test, things got actually worse for 90 000 nodes. 39 seconds vs 68 seconds.
Not sure why digits are so big comparing to my initial post, probably more rules or something, but here I compare v10.0.0 and v10.5.0
As you can see self execution of t.deleteRule and t.remove takes most time.
So it should be that splice()

mario1ua
on 26 Jan 2021
When I splicing all items of 30 000 array, I get around that number - 20 seconds.
a = new Array(30000).fill(0);

console.log('a.length', a.length);
console.log('splicing a...');

time1 = performance.now()

while(a.length > 10) {
 a.splice(5, 1);
}

time2 = performance.now();

console.log('a.length', a.length);
console.log('time', time2-time1, 'milliseconds');
It's possible that you are seeing this performance issue because it's an artificial benchmark with the amount of elements in array we will never have in real life. Its possible that JS VM becomes exponentially slower with such massive arrays and benchmarking something like this doesn't make sense.
I suspect you have some other problem in real world application and you think that this is the problem, but I also suspect that this is not the problem you have.
kof
on 27 Jan 2021
If you truly want to get to the bottom of the problem you have in a product, you need to start with a benchmark that is realistic and stop producing those huge datasets.
kof
on 27 Jan 2021
@kof this is real world application. 300 rows x 15 columns table, stuffed with different kinds of dropdown components, etc. (you can also see 100seconds taken by Redux work)
I agree though that this is more like an edge case. And table needs optimizations in the first place.
mario1ua
on 27 Jan 2021
And in that real-world app, when you analyze it, the bottleneck is still deleteRule? I just can't imagine that this is the case. There must be some other much more problematic places
kof
on 27 Jan 2021
Yes, actually it took almost equal time as everything else.
But here's something interesting I found.
I used functions in createUseStyles() and once I switched a function declaration to regular object, it started taking 10x less time.
Using function:

Using plain object:

I removed
//  dividerWrapper: ({ resizing }) => ({
  dividerWrapper: {
    display: 'flex',
    justifyContent: 'flex-end',
    width: 20,
    position: 'absolute',
    height: '100%',
    top: 0,
    right: 0,
    '&:hover': {
      cursor: 'col-resize',
      opacity: 1,
    },
    opacity: +resizing,
    }
 // }),
mario1ua
on 27 Jan 2021
Dynamic rules can't be shared across component instances by design, because
each can have different styles.
In your case impact is big because you have many instances
On Wed, Jan 27, 2021, 18:00 Sergiy Ostrovsky notifications@github.com
wrote:
Yes, actually it took almost equal time as everything else.
But here's something interesting I found.
I used functions in createUseStyles() and once I switched a function
declaration to regular object, it started taking 10x less time.Using function:
[image: image]
https://user-images.githubusercontent.com/17026982/106024892-e5374200-60d0-11eb-8e96-31d245c19fc2.png
Using plain object:
[image: image]
https://user-images.githubusercontent.com/17026982/106025065-144db380-60d1-11eb-9e2a-1bb3807975cd.pngI removed
// dividerWrapper: ({ resizing }) => ({
dividerWrapper: {
display: 'flex',
justifyContent: 'flex-end',
width: 20,
position: 'absolute',
height: '100%',
top: 0,
right: 0,
'&:hover': {
cursor: 'col-resize',
opacity: 1,
},
opacity: +resizing,
}
// }),—
You are receiving this because you were mentioned.
Reply to this email directly, view it on GitHub
https://github.com/cssinjs/jss/issues/1405#issuecomment-768426573, or
unsubscribe
https://github.com/notifications/unsubscribe-auth/AAAM4WDG6W4IJNYCWEAZXNLS4BBCLANCNFSM4SJFEDGQ
.
kof
on 27 Jan 2021
Related issues
 oliviertassinari
·
6Comments
oliviertassinari
·
6Comments
 Telokis
·
3Comments
kof
·
6Comments
Telokis
·
3Comments
kof
·
6Comments
 brianmhunt
·
5Comments
brianmhunt
·
5Comments
 pofigizm
·
5Comments
pofigizm
·
5Comments
Most helpful comment
Released in https://github.com/cssinjs/jss/releases/tag/v10.5.0
@yhaskell @mario1ua please try it out and post your profiler output, ideally with real world product with before and after