Jormungandr: Jormungandr consumes 100% CPU and crashes
Describe the bug
After a while running Jormungandr, CPU usage slowly creeps to 100% at which point the node is unable to keep in sync with the network. The only way to recover is to reset the node.
The following diagram illustrates this behaviour:
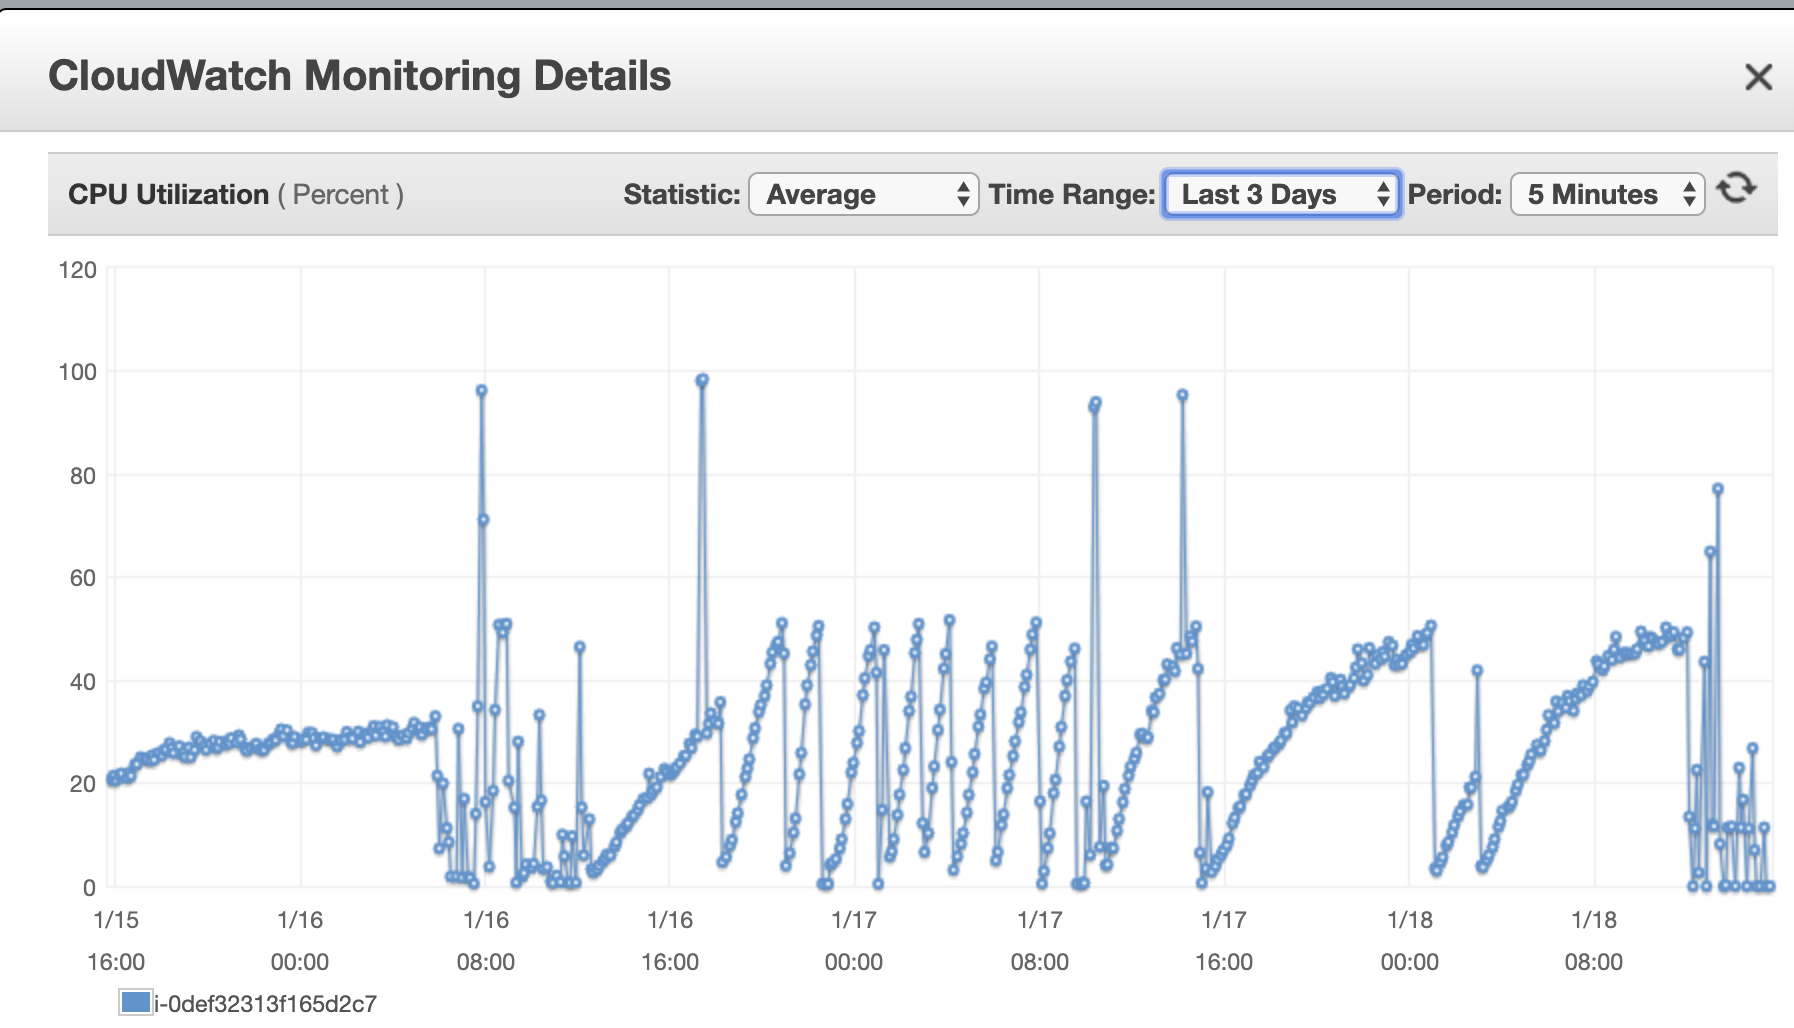
This is a 2 core node, and 50% CPU utilisation represents and entire core being consumed by Jormungandr (I think because the async thread pool being used is singly threaded in the particular path of code highlighted below).
The sawtooth pattern changes depending on max_connections and gossip period. The period between 16:00 and 08:00 shows a steeper climb to total CPU consumption. Later the climb is not so steep because I have changed max_connections and gossip interval from 512 and 5s to 256 and 10s respectively.
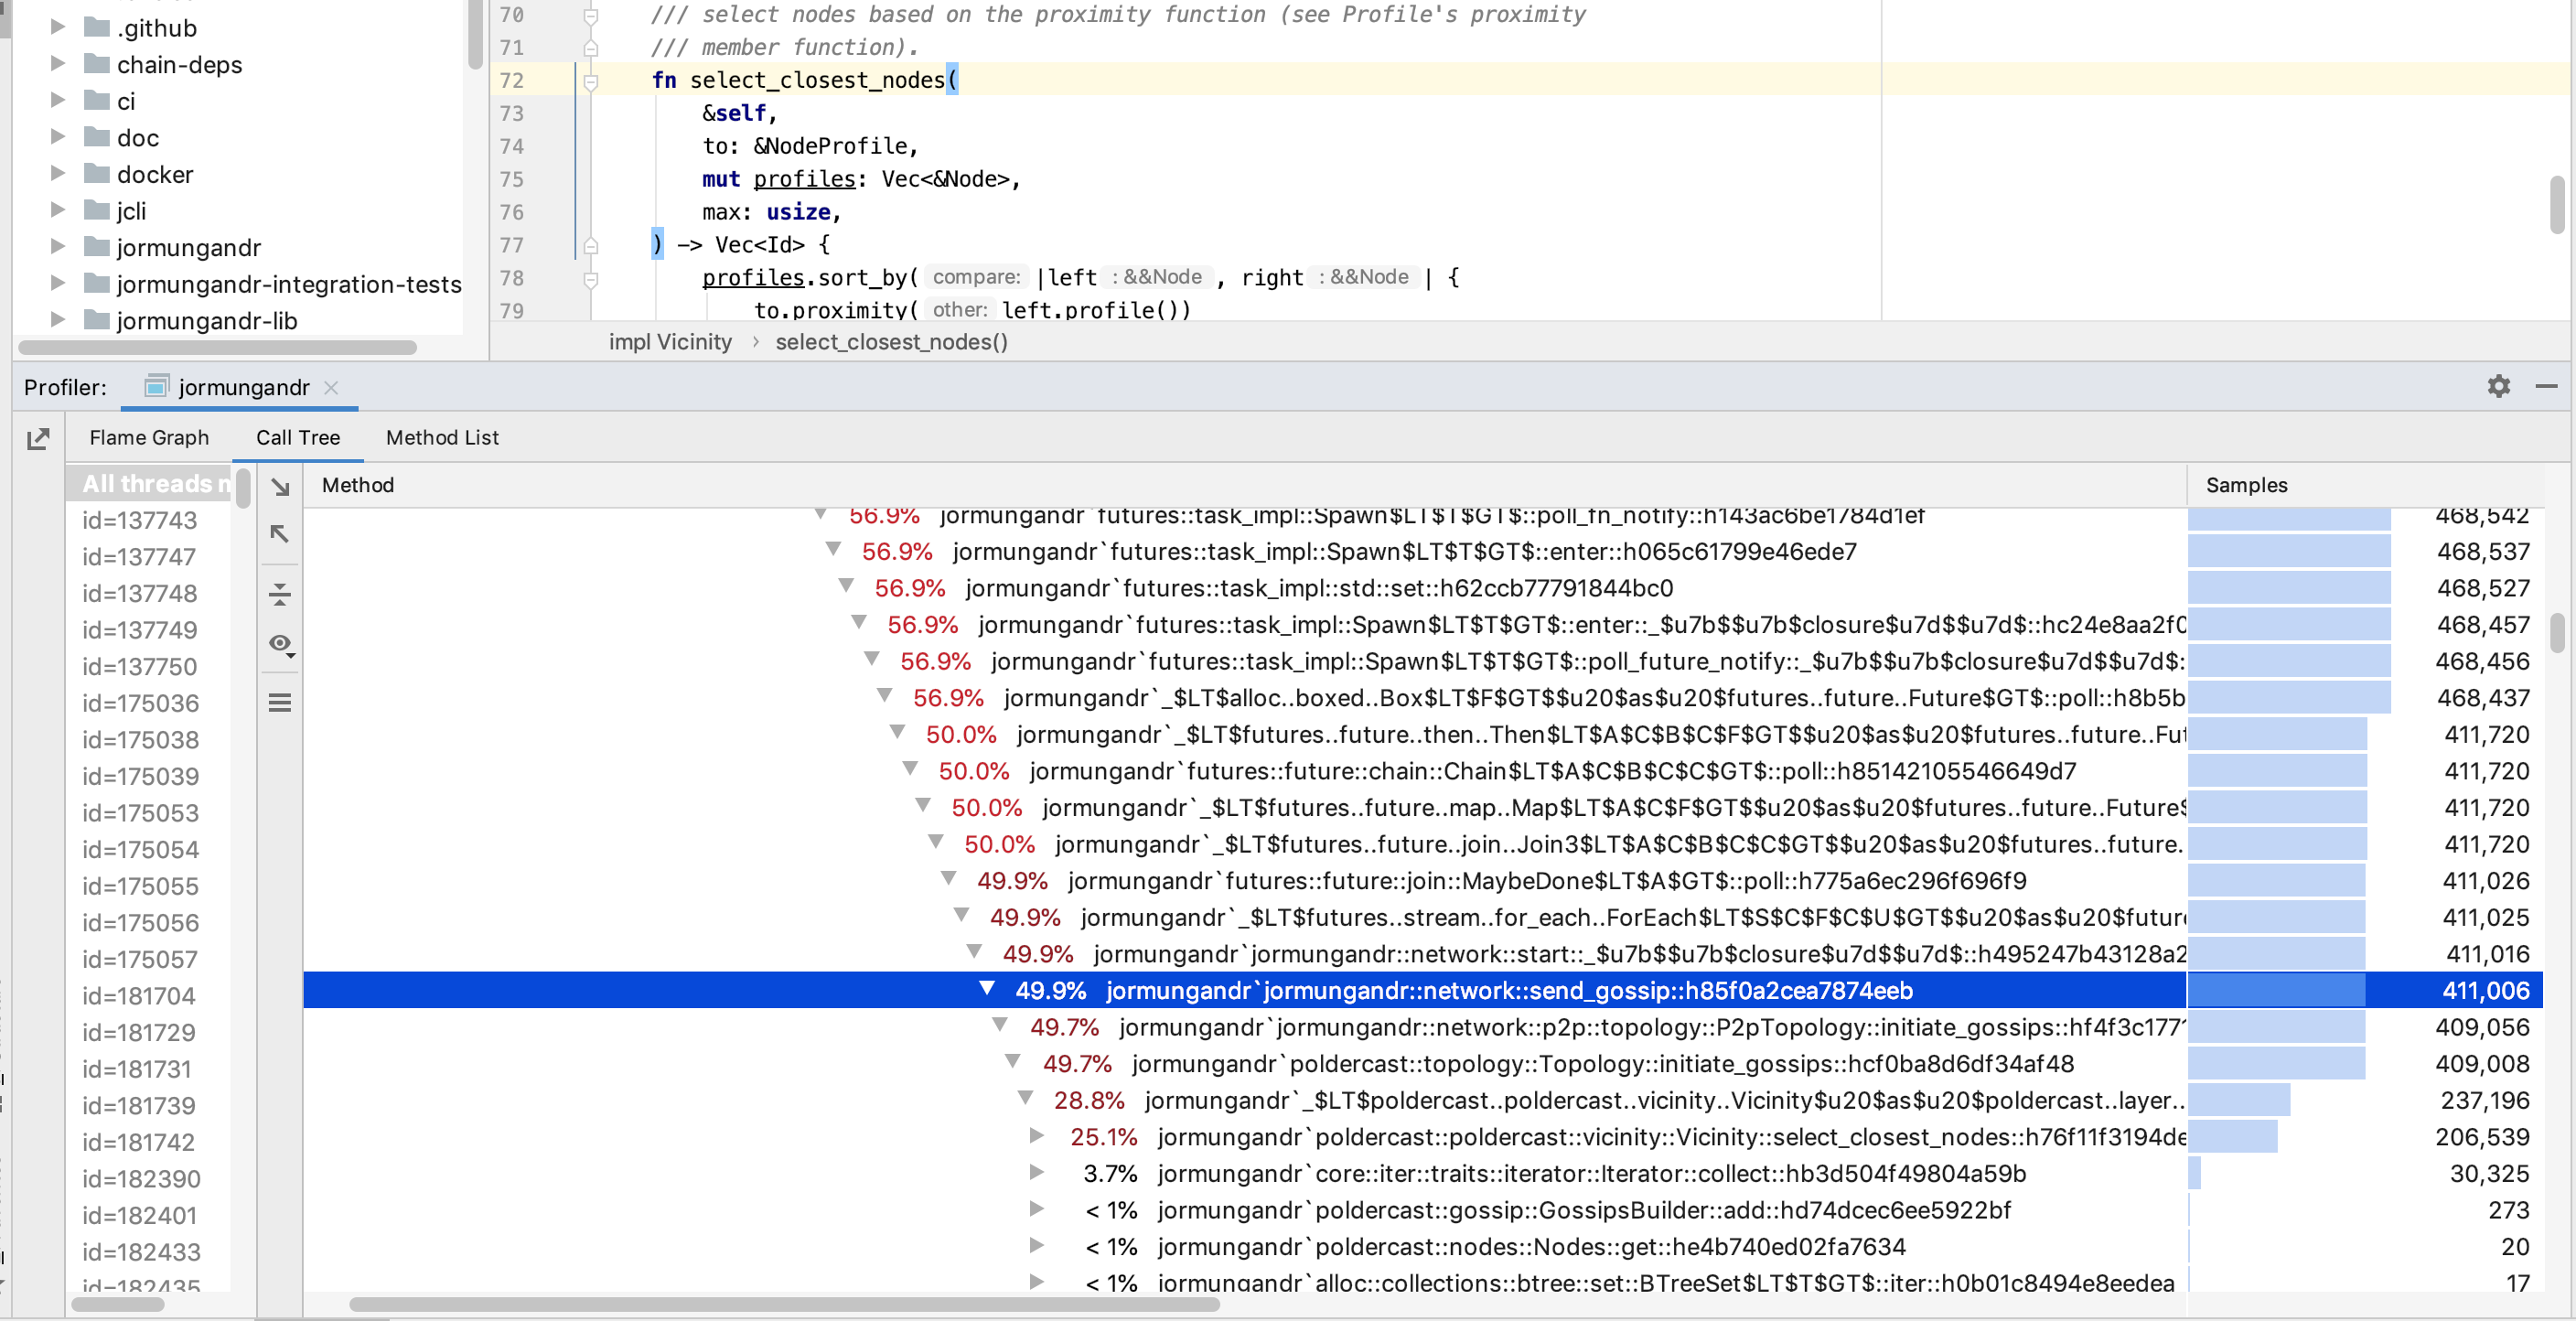
Running a 30 minute profile of Jormungandr (post bootstrap) shows that the majority of CPU usage (greater than 50%) occurs in call to jormungandr::network::send_gossip() function. Within this function, most cycles are consumed deep in the poldercast library during vicinity distance calculation (a merge sort on the total peer list is executed with each iteration).
Mandatory Information
jcli --full-versionoutput;jcli 0.8.6 (master-64780cf3, release, linux [x86_64]) - [rustc 1.39.0 (4560ea788 2019-11-04)]jormungandr --full-versionoutput:jormungandr 0.8.6 (performance-e56aada5, release, linux [x86_64]) - [rustc 1.39.0 (4560ea788 2019-11-04)]
Note: Above versions correspond to test branches that im working off, but tip of master is affected in the exact same way.
To Reproduce
Steps to reproduce the behavior:
- Start Jormungandr with public_address specified and max_connections set to 512.
- Wait a while....
Expected behavior
Jormungandr runs without failure.
Additional context
It's not clear to me if the root cause here as inefficiencies in the vicinity calculation or a build up of the peer list and subscriptions data structures that are being merge sorted often. Probably a combination of both.
Here is the specific call to sort() which within poldercast lib
One theory is that continuous restarting of nodes currently plaguing the ITN is causing the poldercast node data structures to grow more rapidly than anticipated. Perhaps a bug in the node removal policy is also a factor.
Unfortunately it is quite impossible for me to successfully bootstrap the last few epochs which has not only destroyed sandstone pools profits but also limited my ability to effectively debug this issue further!
 michaeljfazio
All 7 comments
Thanks @michaeljfazio definitely some improvements that can be done here. Useful data too.
 NicolasDP
on 18 Jan 2020
NicolasDP
on 18 Jan 2020
This issue is of very high importance IMHO. Pool operators who have the available funds are arms racing to upgrade their nodes to more and more powerful cores to extend the time until the CPU buildup gets too bad and a restart is inevitable. The only other remedy seems to be limiting max connections and increasing gossip interval.
 Straightpool
on 19 Jan 2020
Straightpool
on 19 Jan 2020
In my own setup (BCSH), I did not see any increase in time until node went to 100% by increasing gossip interval. I saw the same ramp regardless.
However, it seems that incoming connections to the node makes a big difference. If I update the firewall to DENY traffic after my node has gotten a decent number of connected peers, this shifts the burden off of jormungandr and onto the firewall to reject connections. By doing this, I've gotten uptimes regularly over 2 hours instead of 10 minutes when I'm fully open to incoming connections.
I'd prefer this issue get fixed, but in the meantime, I've automated the process of opening and closing the firewall to take the load of jormungandr in my node management software here: https://bitbucket.org/muamw10/jormanager
 AndrewWestberg
on 20 Jan 2020
AndrewWestberg
on 20 Jan 2020
Our recent internal soak tests also noticed same behavior:
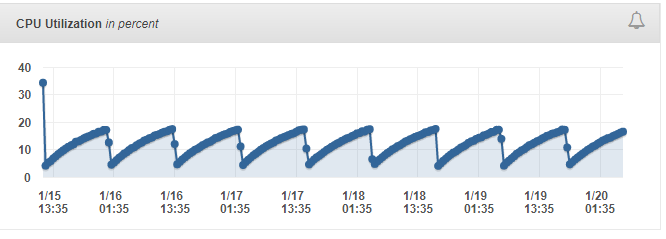
Quick note about test design:
A single node (stake pool without any trusted peers) is being exercised by moderate amount of transactions (sent via rest api) for couple of days.
The same pattern is observed as in reported issue, however due to isolation of the node from entire network the CPU usage is reaching barely 17% of CPU in 12 hours interval.
 dkijania
on 20 Jan 2020
dkijania
on 20 Jan 2020
@michaeljfazio any improvement small/visible after the changes you made to poldercast (thank you again for those contributions)
 rinor
on 30 Jan 2020
rinor
on 30 Jan 2020
@michaeljfazio any improvement small/visible after the changes you made to poldercast (thank you again for those contributions)
Definitely an improvement, but also certainly not a solution. The available peers list simply grows too large and the sort routine is called too often. I see there being two concrete solutions to the issue:
- Rework poldercast Vicinity Layer to use a pre-sorted (insertion sort) data structure for calculating nearest node. * probably not possible *
- Implement a Policy that effectively culls stale nodes.
I'm experimenting with option two as we speak (see this commit on my custom Jormungandr build). The logic is simple, but the implication is also that topology layers will need to be reset periodically, not just on respective network events alone. Necessary because one can't rely on network events to be generated for stale nodes.
michaeljfazio
on 30 Jan 2020
Experiencing same issues running the latest binaries. Server uptime is 2 days and CPU usage slowly climbing. Starting the node after a reboot keeps the CPU around 24% and from there it climbs and doesn't go down. After 2 days, CPU is just under 85%.
./jcli --full-version
jcli 0.8.9 (HEAD-30d20d2, release, linux [x86_64]) - [rustc 1.40.0 (73528e339 2019-12-16)]
./jormungandr --full-version
jormungandr 0.8.9 (HEAD-30d20d2, release, linux [x86_64]) - [rustc 1.40.0 (73528e339 2019-12-16)]
./jcli rest v0 node stats get --host "http://127.0.0.1:3100/api"
blockRecvCnt: 7988
lastBlockContentSize: 0
lastBlockDate: "53.26026"
lastBlockFees: 0
lastBlockHash: 5414c9fe5a8234bf9f1ddacfdce4fe03ca885eac268fd142befcd6e7055dc07e
lastBlockHeight: "166075"
lastBlockSum: 0
lastBlockTime: "2020-02-05T09:41:09+00:00"
lastBlockTx: 0
lastReceivedBlockTime: "2020-02-05T09:41:11+00:00"
peerAvailableCnt: 103403
peerQuarantinedCnt: 35789
peerUnreachableCnt: 3332
state: Running
txRecvCnt: 3938
uptime: 180115
version: jormungandr 0.8.9-30d20d2
 cinnl
on 5 Feb 2020
cinnl
on 5 Feb 2020
Related issues
 jbgi
·
29Comments
jbgi
·
29Comments
 consuman
·
16Comments
NicolasDP
·
19Comments
consuman
·
16Comments
NicolasDP
·
19Comments
 MarcelKlammer
·
12Comments
MarcelKlammer
·
12Comments
 lovelypool
·
14Comments
lovelypool
·
14Comments
Most helpful comment
Thanks @michaeljfazio definitely some improvements that can be done here. Useful data too.