Jormungandr: Socket leak and processing problem while under load
Jormungandr v0.8.5.
After the jormungandr service is started, TCP socket creation, handshake, communication and teardown behaves normally for some time. After some triggering condition, which appears to be some semi-random elevated level of socket load, established socket RECV buffers are no longer read promptly and closing sockets are no longer torn down properly and stay stuck in CLOSE_WAIT state (note that the CPU DOES appear constrained when this happens, at least on 1 jormungandr process thread and logical CPU). In CLOSE_WAIT state, the Linux kernel is waiting for the application to issue a close() call for each file_descriptor, but that doesn't happen. The CLOSE_WAIT sockets slowly build up until they dominate the socket connection states. The TCP ACCEPT queue backs up until overflow. Once the TCP ACCEPT queue is filled, new accepts cannot be established and TCP overflow, orphan and drop errors are reported by the OS. The service then slowly loses established connections and appears unable to create new ones. Once the service is restarted CLOSE_WAIT sockets are released and the process starts over.
Example commands showing socket related output from this lifecycle are:
# Ordinary TCP ACCEPT queue max shown as 1024 (128 normally on our OS without the somaxconn adjustment).  The 0 shows no queueing here.
ss -lnt | grep ":3000"

LISTEN    0         1024               0.0.0.0:3000             0.0.0.0:*

# Ordinary distribution of socket states

netstat -tn | tail -n +3 | awk "{ print \$6 }" | sort | uniq -c | sort -n
      1 FIN_WAIT1
      2 LAST_ACK
     41 SYN_SENT
     58 TIME_WAIT
    317 ESTABLISHED

# As socket connections build, at some point, the receive buffers fill and don't get read promptly as seen in second column of netstat -tn

# Then the TCP ACCEPT queue fills and the socket state distribution changes to predominately CLOSED_WAITs:

LISTEN    570       1024               0.0.0.0:3000             0.0.0.0:*

      1 FIN_WAIT1
      1 SYN_RECV
     21 CLOSE_WAIT
     31 SYN_SENT
     44 TIME_WAIT
   1336 ESTABLISHED

<...elapsed time...>

LISTEN    882       1024               0.0.0.0:3000             0.0.0.0:*

      31 SYN_SENT
     44 TIME_WAIT
    290 CLOSE_WAIT
   1358 ESTABLISHED

<...elapsed time...>

LISTEN    1025      1024               0.0.0.0:3000             0.0.0.0:*

    300175 times the listen queue of a socket overflowed
    300211 SYNs to LISTEN sockets dropped

      1 FIN_WAIT2
     28 SYN_SENT
     37 TIME_WAIT
    591 ESTABLISHED
   1104 CLOSE_WAIT
 johnalotoski
All 9 comments
This problem would describe my anecdotal evidence, that every time my tip diverges from the rest of the nodes, no new connections are being created, as per following graphs.
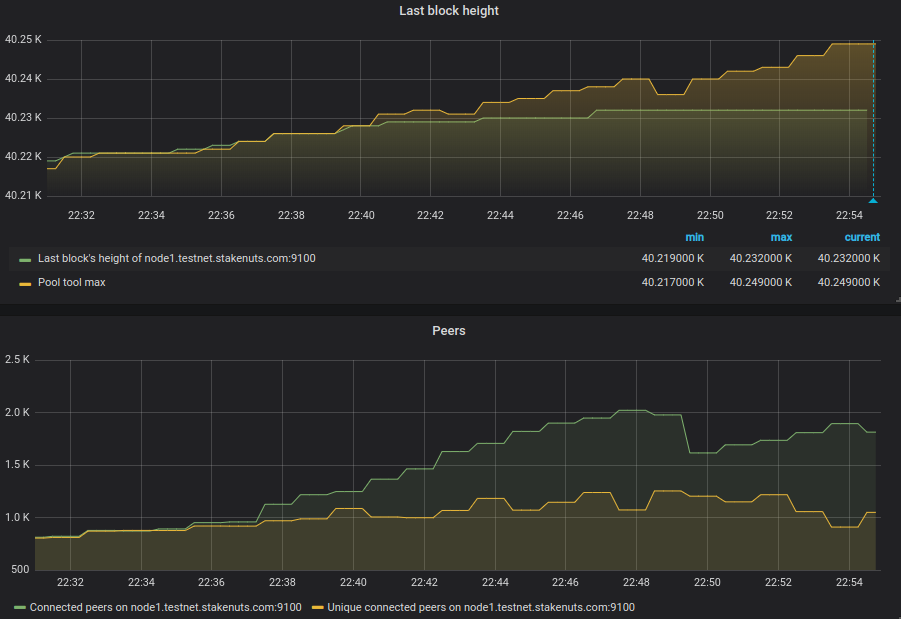
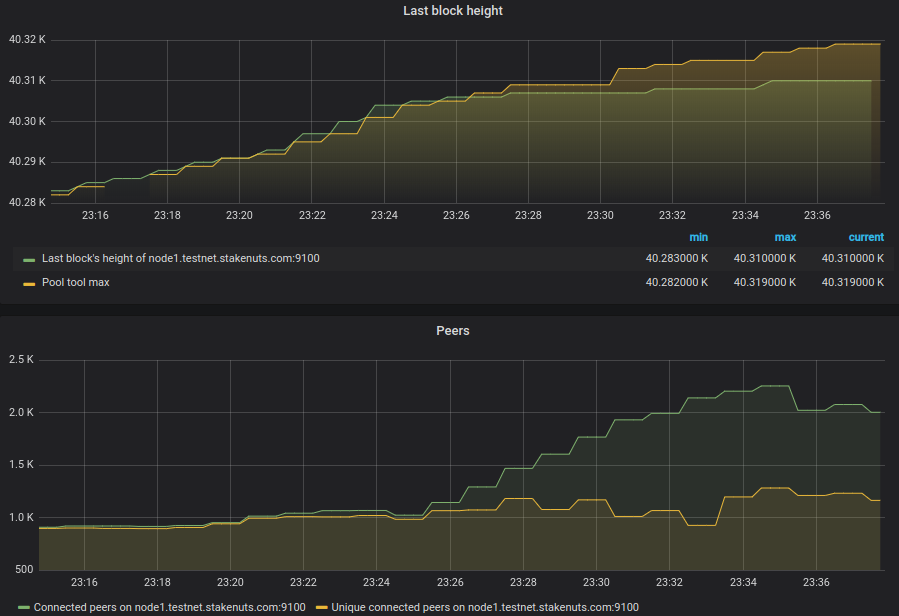
Another case:
 mmahut
on 27 Dec 2019
mmahut
on 27 Dec 2019
Hi John. Interesting observations. The sockets are presumably not being closed because they are believed to be still live. It then sounds as if the code may be waiting for an event that never occurs (and which is not triggered by closing the handles externally). Increasing the accepts wouldn’t have much effect in this scenario since it would just increase the number of additional connections that could be obtained before a collapse. I would be looking for edge conditions (e.g. buffer size boundaries, or special cases in the close-out code) that could act as triggers (gdb or another debugger might be able to help here if you can add the right hooks). If there is some internal state that shadows the socket status, then simply closing down the file descriptors might not have much effect. From what you say, I suspect the system load might not be the trigger (unless e.g. a shared variable is not properly protected, which is more likely to cause a problem with increasing numbers of connections): apart from the sockets, everything seems to be within normal operating parameters when the problem occurs.
If the cause can’t be tracked down or is hard to fix, then additional internal concurrency/monitoring on the read/close code may be enough to keep things alive.
 kevinhammond
on 30 Dec 2019
kevinhammond
on 30 Dec 2019
I test patched the mio rust library to test raising the hardcoded limit for the TCP ACCEPT queue and while the queue does build up quite a bit, it doesn't overflow anymore, but none-the-less, the process still loses chain sync persistently once the socket count grows sufficiently and the ingress data buffers for established sockets can be seen to have unread data sitting on them for extended periods. I had observed some machines where the jormungandr CLOSE_WAIT sockets do disappear on their own after an extended period of time, so this test was to determine if the issue was solely related to the accept buffer not being large enough to handle what might have been a higher steady-state value of TCP sockets. That's not the case, so I agree, it looks like probably a socket concurrency handling issue and/or a bug somewhere.
johnalotoski
on 3 Jan 2020

Adding some more graphs and data around the socket issue.
mmahut
on 3 Jan 2020
Can we reopen this issue, as it's not fixed by that PR.
 manveru
on 8 Jan 2020
manveru
on 8 Jan 2020
I can confirm, seeing the issue even with #1497 in.
mmahut
on 8 Jan 2020
One possible way of how this can occur is if a poll implementation gets stuck in a loop, preventing other futures, including the one driving accept, from being polled in time.
 mzabaluev
on 8 Jan 2020
mzabaluev
on 8 Jan 2020
I'm also seeing the same issue on v0.8.6. When v0.8.5 launched I was able to run +4 days without needing to restart Jormungandr. Back then I had set max_connections to 4096. Now it can run around 30 minutes before getting stuck. It is still following the same pattern described by others in this thread: Established connections increase then CLOSE_WAIT start increasing and then stuck.
I have tried to lower the max_connections to 120, but it doesn't seem to make much difference.
With v0.8.6 I currently have max_connections=256, but when I look at connection count from netstat it keeps increasing over time. Before Jormungandr gets stuck it can look like this:
netstat -tn | tail -n +3 | awk "{ print \$6 }" | sort | uniq -c | sort -n                                                                     Wed Jan 15 18:12:23 2020
      1 CLOSING
      1 FIN_WAIT1
      1 FIN_WAIT2
     22 TIME_WAIT
     71 SYN_SENT
    201 CLOSE_WAIT
    692 ESTABLISHED
...so a lot more connections than should be allowed according to my max_connections=256 setting!? Note: I know I'm not filtering out non-jormungandr connections from the result, but they are insignificant anyway.
Since the max_connections setting doesn't appear to work I have tried to manage the incoming connections using my firewall. So when incoming connections to my public port goes over a certain threshold they get rejected. This gives me some improvement in uptime before Jormungandr has to be restarted, but not much.
Some people link this issue with spikes in CPU. I have a 4 cores on a dedicated server, and on v0.8.5 I used to see CPU utilization go up drastically on one core while utilization on other cores were low. v0.8.6 seems to be much better at utilizing all CPU cores, so I havn't noticed any 100% spikes yet.
 bobdobs
on 16 Jan 2020
bobdobs
on 16 Jan 2020
I'm also seeing the same issue on v0.8.6. When v0.8.5 launched I was able to run +4 days without needing to restart Jormungandr. Back then I had set max_connections to 4096. Now it can run around 30 minutes before getting stuck. It is still following the same pattern described by others in this thread: Established connections increase then CLOSE_WAIT start increasing and then stuck.
I have tried to lower the max_connections to 120, but it doesn't seem to make much difference.
With v0.8.6 I currently have max_connections=256, but when I look at connection count from netstat it keeps increasing over time. Before Jormungandr gets stuck it can look like this:
netstat -tn | tail -n +3 | awk "{ print \$6 }" | sort | uniq -c | sort -n                                                                     Wed Jan 15 18:12:23 2020
      1 CLOSING
      1 FIN_WAIT1
      1 FIN_WAIT2
     22 TIME_WAIT
     71 SYN_SENT
    201 CLOSE_WAIT
    692 ESTABLISHED
...so a lot more connections than should be allowed according to my max_connections=256 setting!? Note: I know I'm not filtering out non-jormungandr connections from the result, but they are insignificant anyway.
Since the max_connections setting doesn't appear to work I have tried to manage the incoming connections using my firewall. So when incoming connections to my public port goes over a certain threshold they get rejected. This gives me some improvement in uptime before Jormungandr has to be restarted, but not much.
Some people link this issue with spikes in CPU. I have a 4 cores on a dedicated server, and on v0.8.5 I used to see CPU utilization go up drastically on one core while utilization on other cores were low. v0.8.6 seems to be much better at utilizing all CPU cores, so I havn't noticed any 100% spikes yet.
A follow up... On 2 out of 2 occasions I have noticed that my node is able to stay in sync for much longer if I wait a couple of hours before restarting Jormungandr. If I restart the Jormungandr quickly after it gets stuck it can stay up for 20-30 minutes tops. But if I wait a couple of hours before restarting, it can stay up and in sync for around 24 hours! So it appears that if other nodes "forget" my node, then that greatly improves my nodes ability to stay in sync.
bobdobs
on 21 Jan 2020
Related issues
 mark-stopka
·
3Comments
mmahut
·
5Comments
mark-stopka
·
3Comments
mmahut
·
5Comments
 dkijania
·
3Comments
dkijania
·
3Comments
 hodlonaut
·
3Comments
hodlonaut
·
3Comments
 ghost
·
4Comments
ghost
·
4Comments
Most helpful comment
Adding some more graphs and data around the socket issue.