Jinja: Implement builtin template helper to dump available template variables
Smarty template engine has a very convenient {debug} built-in that gives a quick overview of variables available for designer.

It would be nice to have the same stuff in Jinja2 by default
All 16 comments
I'd have to check, but I think this should work:
<h2>locals()</h2>
<pre>{{ locals() }}</pre>
<h2>globals()</h2>
@mitsuhiko from https://stackoverflow.com/a/13757358/188833 :
import jinja2

@jinja2.contextfunction
def get_context(c):
 return c

app.jinja_env.globals['context'] = get_context
app.jinja_env.globals['callable'] = callable
for debugging, e.g. pyramid_debugtoolbar can show the template context if the view function -- appropriately abstracted IMHO -- just returns a context object (e.g. dict, OrderedDict)
- https://github.com/Pylons/pyramid_debugtoolbar
- https://westurner.org/wiki/awesome-python-testing#pyramid
use case
My use case here is passing a few args from a CLI utility through to a jinja2 template (where I'd like to define defaults within the template (e.g. for Dockerfiles (without autoescape, of all things))
What I'd like to do is
{% set ENVVAR=context.get('ENVVAR', 'DEFAULT') %}
but, alas, the actual context object is [...]
@westurner, so does it work? I am unable to check it right now, but it looks to me that {{ locals() }} should fail if it contains non-convertible bytes.
json.dumps(locals())won't work without a custom JSONEncoder (with egrepr()for [code objects,])- maybe
pprint.pformat(locals())? (this would be a convenient builtin)
- ...
autoescape=Truewould then prevent XSS
This would be a boon to have when extending templates of a third-party app. I am currently using hieroglyph to create slide-shows, which builds on sphinx, and thus Jinja2.
I've extended the default hieroglyph theme, and what I would like to find out is if the template contains some variable which tells me if I'm on a slide or not. Maybe the variable is there, maybe it isn't. So I am currently poking inside the hieroglyph source-code to find what I need.
Being able to simply dump all the available variables directly from within the template (that is, without modifying any Python code) would make this so much quicker and easier. So, let's say being able to do something like this would be nice:
{% extends "!layout.html %}

{# ... or any other sensible name #}
{% dump_variables() %}

{% block body %}
Hello World!
super()
Goodbye World
{% endblock %}
This way, I could introspect whatever hieroglyph offers me while developing the new theme.
I created an extension for this purpose, it can be found at https://github.com/niwinz/django-jinja/files/1607805/jinja_extensions.py.txt
@ShaheedHaque any screens?
If you open the file, the comments have an example of the output. If
needed, I can provide an actual screenshot when I get home tonight...
On 6 Jan 2018 02:23, "anatoly techtonik" notifications@github.com wrote:
@ShaheedHaque https://github.com/shaheedhaque any screens?
—
You are receiving this because you were mentioned.
Reply to this email directly, view it on GitHub
https://github.com/pallets/jinja/issues/174#issuecomment-355716273, or mute
the thread
https://github.com/notifications/unsubscribe-auth/AEp7KdBBslHJPIGp5VliuF74bxSZTk-wks5tHtkEgaJpZM4AXefd
.
@ShaheedHaque screen would be really nice to compare with Smarty output from the first post.

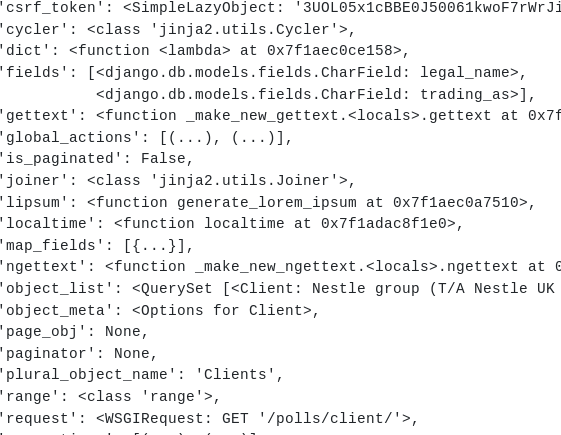
As requested. You'll see that the contents are organised (and sorted) by context variables, filters and tests. Also, here is a zoomed-in view on a screen with a few more "interesting" context variables. See how the limit to depth=3 is enough to show a bit of detail, without incurring the possibility of overly nested output since, I believe, the most requested thing is to know exactly what (top level) context variables are present and not the full depth of any structures:

You'll also likely see that it is trivial to change/extend the details of what is shown (or it will be, for somebody who knows how the parser works...I'm not in that blessed circle :-)).
Looks useful. So why not to fill a PR?
I'd be happy to do that given some guidance on where in the ninja codebase the new code should live (I'm not familiar with this project).
Me neither, but https://github.com/pallets/jinja/blob/master/jinja2/ext.py seems like a good start.
See PR #798.
Will be available as a new extension in 2.11.
Thanks!
The debug extension docs should caution users about unintentional
disclosure of sensitive information
through the {% debug %} tag, and how to determine whether the extension
is enabled (so that a static analyzer can identify that someone forgot to
remove {% debug .* %} before release.
983
On Friday, October 4, 2019, David Lord notifications@github.com wrote:
Closed #174.
—
You are receiving this because you were mentioned.
Reply to this email directly, view it on GitHub, or mute the thread.
Most helpful comment
As requested. You'll see that the contents are organised (and sorted) by context variables, filters and tests. Also, here is a zoomed-in view on a screen with a few more "interesting" context variables. See how the limit to depth=3 is enough to show a bit of detail, without incurring the possibility of overly nested output since, I believe, the most requested thing is to know exactly what (top level) context variables are present and not the full depth of any structures:
You'll also likely see that it is trivial to change/extend the details of what is shown (or it will be, for somebody who knows how the parser works...I'm not in that blessed circle :-)).