Jellyfin: High CPU usage when idling if port mapping is enabled
Describe the bug
Since 10.5.0 jellyfin has higher CPU usage even when not being used.
System (please complete the following information):
- OS: official docker
- Virtualization: Docker
- Clients: any or none
- Jellyfin Version: 10.5.0
- Installed Plugins: none
- Reverse Proxy: traefik
- Base URL: none
- Networking: Host
- Storage: local zfs
- CPU: i7 mobile
To Reproduce
- Run jellyfin 10.5.0 - after upgrade from 10.4.x
- Observe
docker stats
https://gfycat.com/gravehelpfulconch
Expected behavior
When jellyfin isn't used, CPU usage should be that high
Logs
Nothing is logged when CPU has high usage and no client is using jellyfin
 agilob
All 39 comments
Anything in the logs? Could be background tasks, thumbnail image extraction, etc
 YouKnowBlom
on 13 Mar 2020
YouKnowBlom
on 13 Mar 2020
CPU usage has been on that level since upgrade, that's a few days now as I was early adopter and helped with testing of 10.5.0. Logs are pretty much empty, no scanning is going on in background.
docker logs jellyfin --follow shows only past started playbacks and warnings about broken websockets from yesterday and today:
[10:39:07] [ERR] [36] App: AcceptWebSocketAsync error
System.Net.WebSockets.WebSocketException (0x80004005): The remote party closed the WebSocket connection without completing the close handshake.
 ---> System.Net.WebSockets.WebSocketException (0x80004005): The remote party closed the WebSocket connection without completing the close handshake.
   at System.Net.WebSockets.ManagedWebSocket.ThrowIfEOFUnexpected(Boolean throwOnPrematureClosure)
   at System.Net.WebSockets.ManagedWebSocket.EnsureBufferContainsAsync(Int32 minimumRequiredBytes, CancellationToken cancellationToken, Boolean throwOnPrematureClosure)
   at System.Net.WebSockets.ManagedWebSocket.ReceiveAsyncPrivate[TWebSocketReceiveResultGetter,TWebSocketReceiveResult](Memory`1 payloadBuffer, CancellationToken cancellationToken, TWebSocketReceiveResultGetter resultGetter)
   at System.Net.WebSockets.ManagedWebSocket.ReceiveAsyncPrivate[TWebSocketReceiveResultGetter,TWebSocketReceiveResult](Memory`1 payloadBuffer, CancellationToken cancellationToken, TWebSocketReceiveResultGetter resultGetter)
   at Emby.Server.Implementations.SocketSharp.WebSocketSharpListener.ProcessWebSocketRequest(HttpContext ctx)
[10:43:30] [ERR] [13] Emby.Server.Implementations.HttpServer.HttpListenerHost: Error processing request: A task was canceled.
[10:43:30] [ERR] [25] Emby.Server.Implementations.HttpServer.HttpListenerHost: Error processing request: The operation was canceled.
[10:43:30] [ERR] [13] Emby.Server.Implementations.HttpServer.HttpListenerHost: Error processing request: The operation was canceled.
I have the same problem. Since I updated Jellyfin in idle state it consumes 10% of cpu. The time now is 18:49 and the last log is in the startup phase of the container at 18:16, there are no active processes yet, but the processor consumes 10%
[18:16:15] [INF] [1] App: Core startup complete
[18:16:16] [INF] [9] LibraryMonitor: Watching directory /data/cartoon
[18:16:16] [INF] [6] LibraryMonitor: Watching directory /data/film2
[18:16:16] [INF] [11] LibraryMonitor: Watching directory /data/movies
[18:16:16] [INF] [11] LibraryMonitor: Watching directory /data/serie2
[18:16:16] [INF] [9] LibraryMonitor: Watching directory /data/tvshows
[18:16:16] [INF] [10] LibraryMonitor: Watching directory /data/music
[18:16:16] [INF] [1] App: Executed all post-startup entry points in 0:00:01.0497372
[18:16:16] [INF] [1] Main: Startup complete 0:00:10.2206823
[18:16:17] [INF] [9] TaskManager: StartupTrigger fired for task: Update Plugins
[18:16:17] [INF] [9] TaskManager: Queueing task PluginUpdateTask
[18:16:17] [INF] [20] TaskManager: Executing Update Plugins
[18:16:20] [INF] [11] TaskManager: Update Plugins Completed after 0 minute(s) and 2 seconds
[18:16:20] [INF] [11] TaskManager: ExecuteQueuedTasks
 zedred79
on 13 Mar 2020
zedred79
on 13 Mar 2020
Same here, my CPU is always between 10-15% even more in idle. I have OpenMediaVault and I am receiving all day al different times warnings that my cpu usage is been too high for too much time.
If I see anything relevant in the logs I will post it here.
 goliath888
on 14 Mar 2020
goliath888
on 14 Mar 2020
Try to UNCHECK the "Networking->Allow remote connections to this Jellyfin Server " option, if you dont need the remote access or done it by nginx. Works for me.
 Lisuibiao
on 16 Mar 2020
Lisuibiao
on 16 Mar 2020
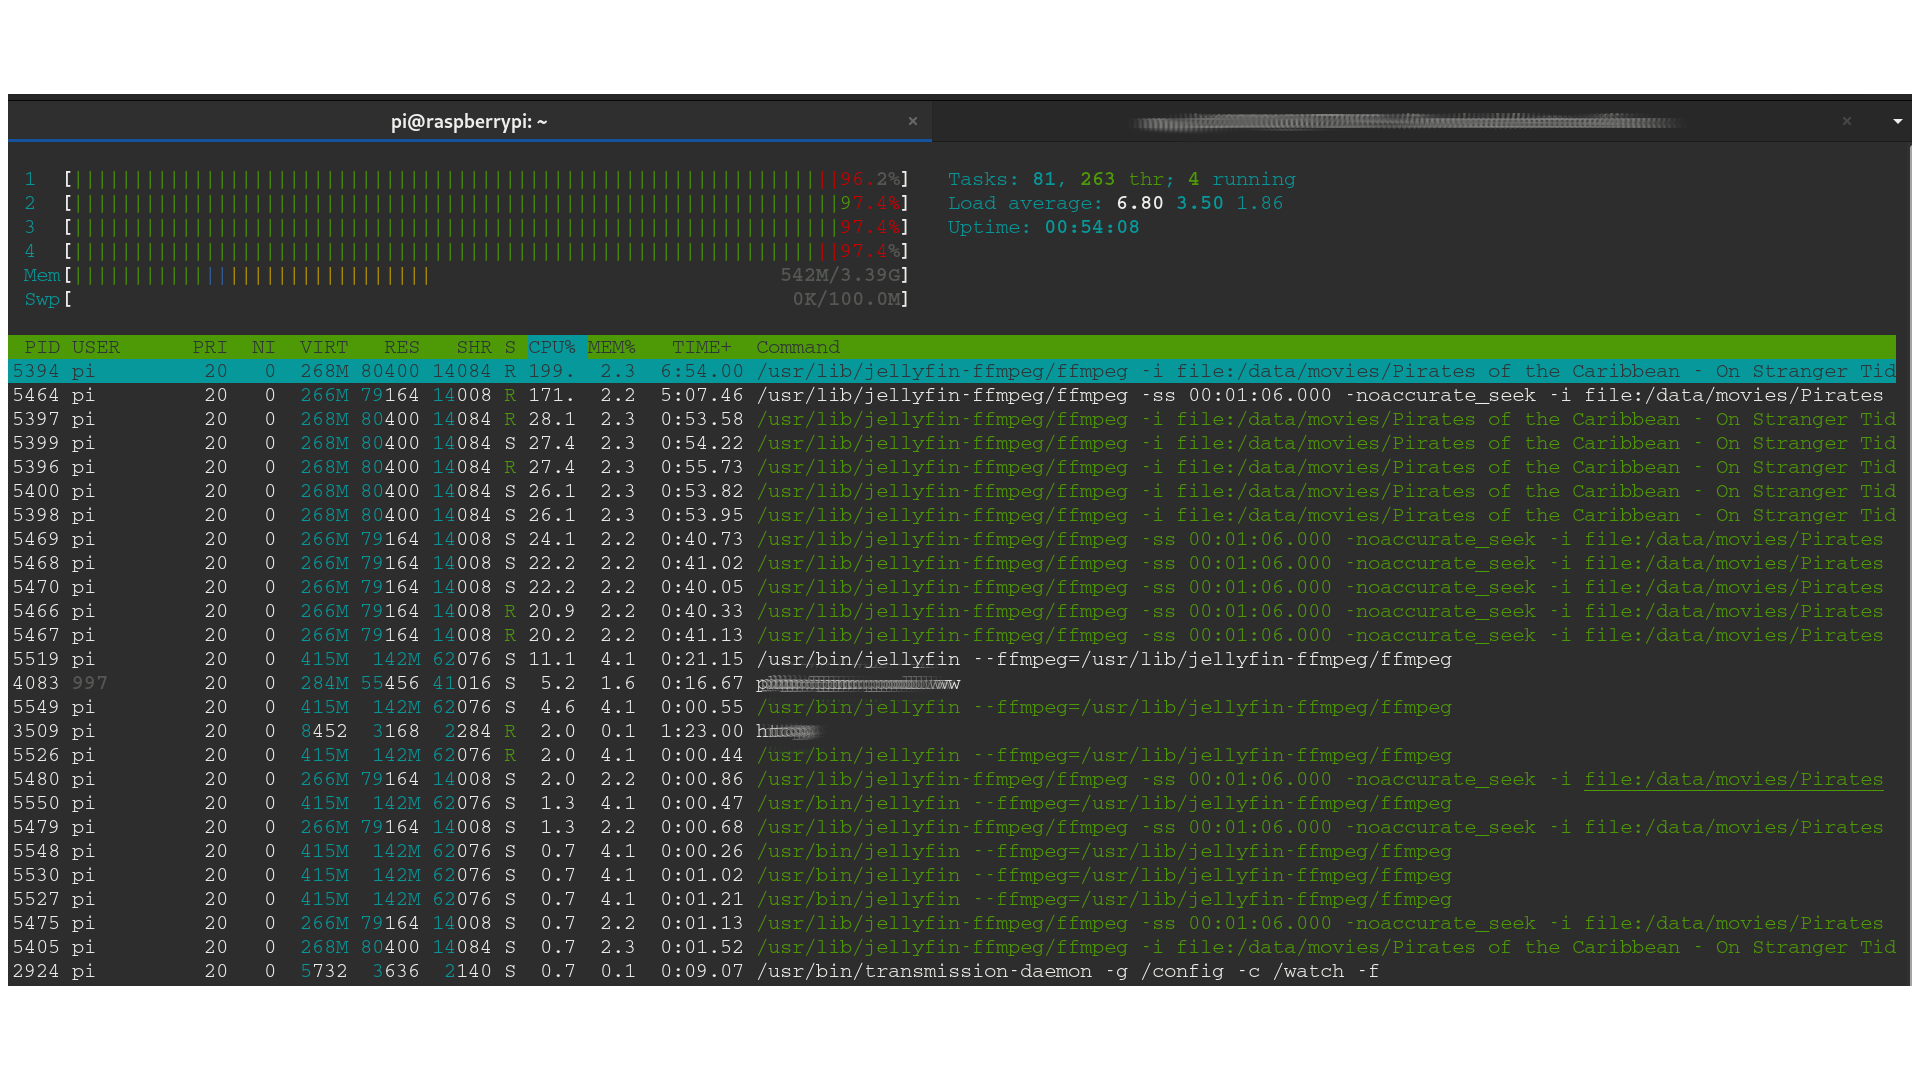
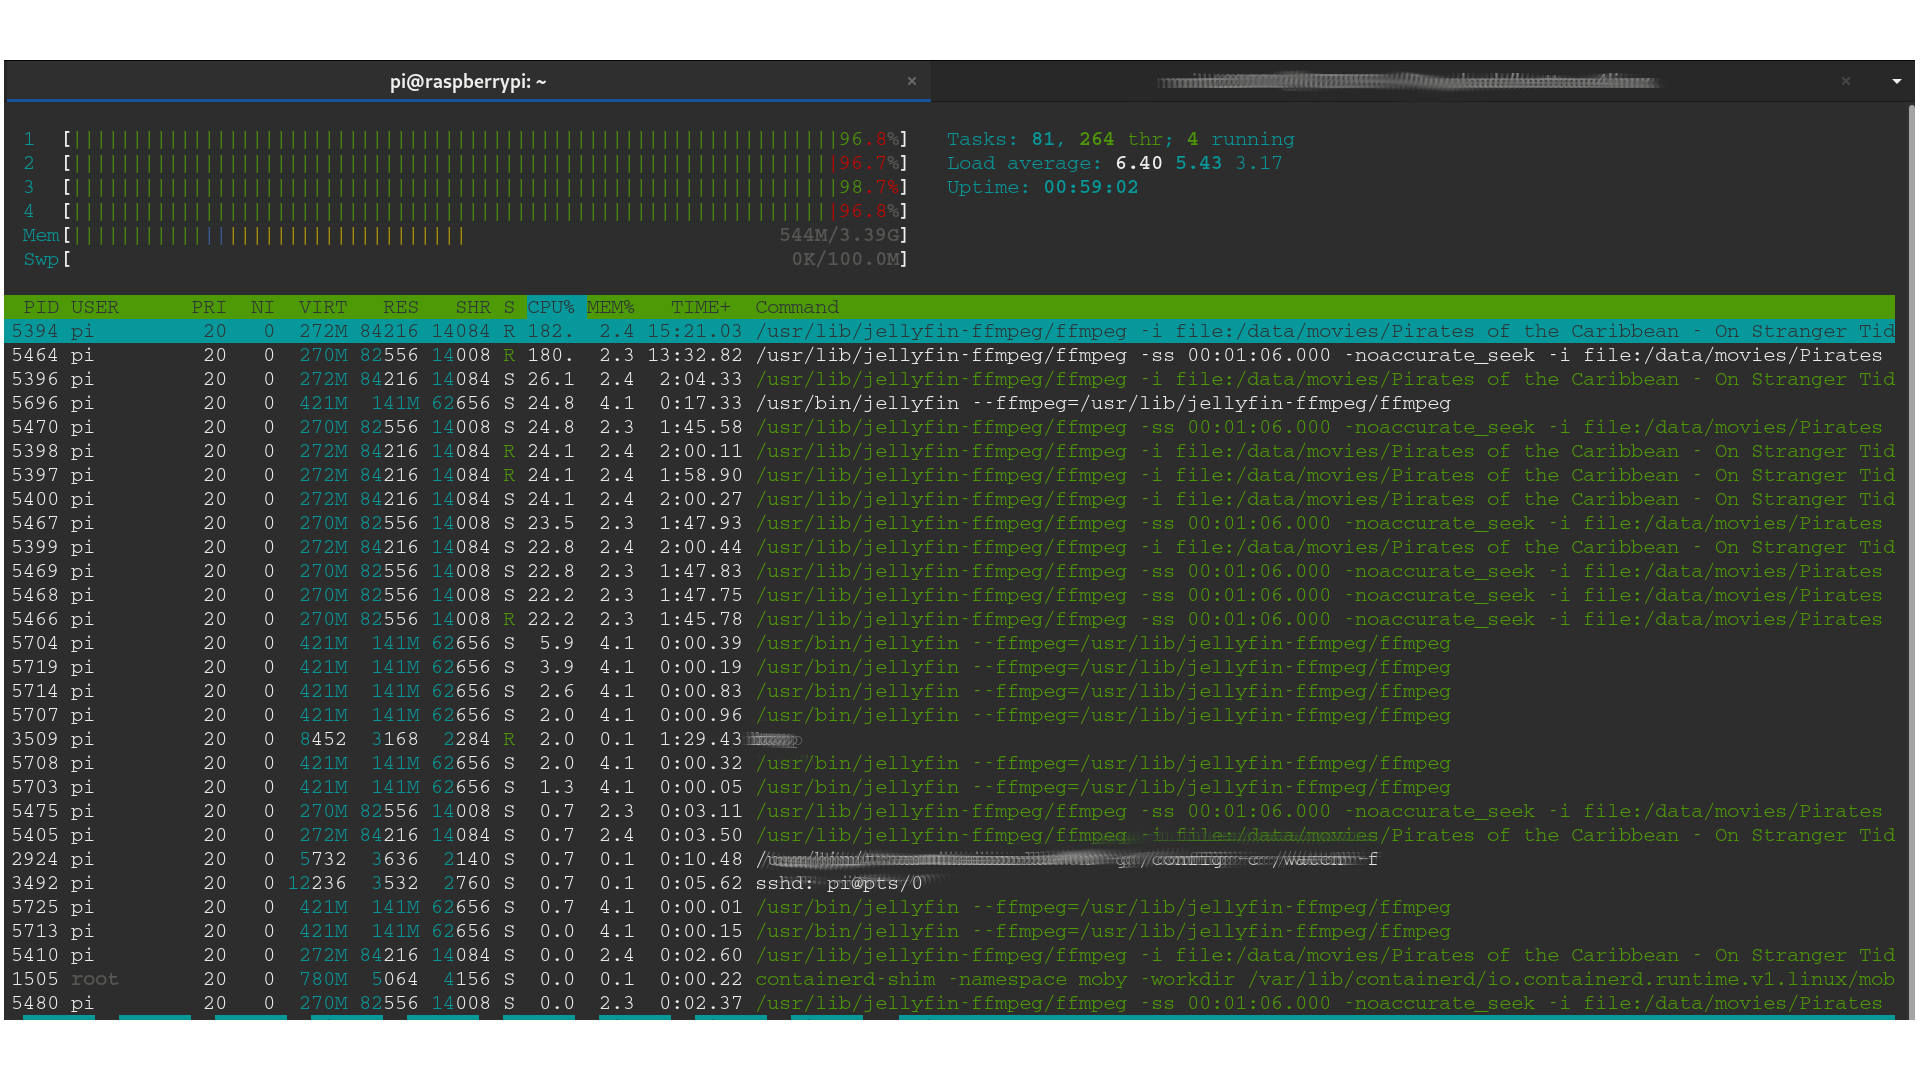
when the docker image upgrade to 10.5 version. the server has some problem.
i open the htop command line. and found the ffmpeg program comumeing much much more cpu resource. the cpu is in high perference.
but at that time, i am already stop plying and close the web client. but the ffmpeg decoding thread still running and using much CPU resource.
system information
- hardware : Raspberry pi 4 4G RAM
- OS : Raspberry OS (based on debian 10 buster 32bit)
- Docker : the latest version
- Jellyfin version : 10.5 ( download from hub.docker.com)
please reference the follow scrrem print.
 code-moritz
on 16 Mar 2020
code-moritz
on 16 Mar 2020
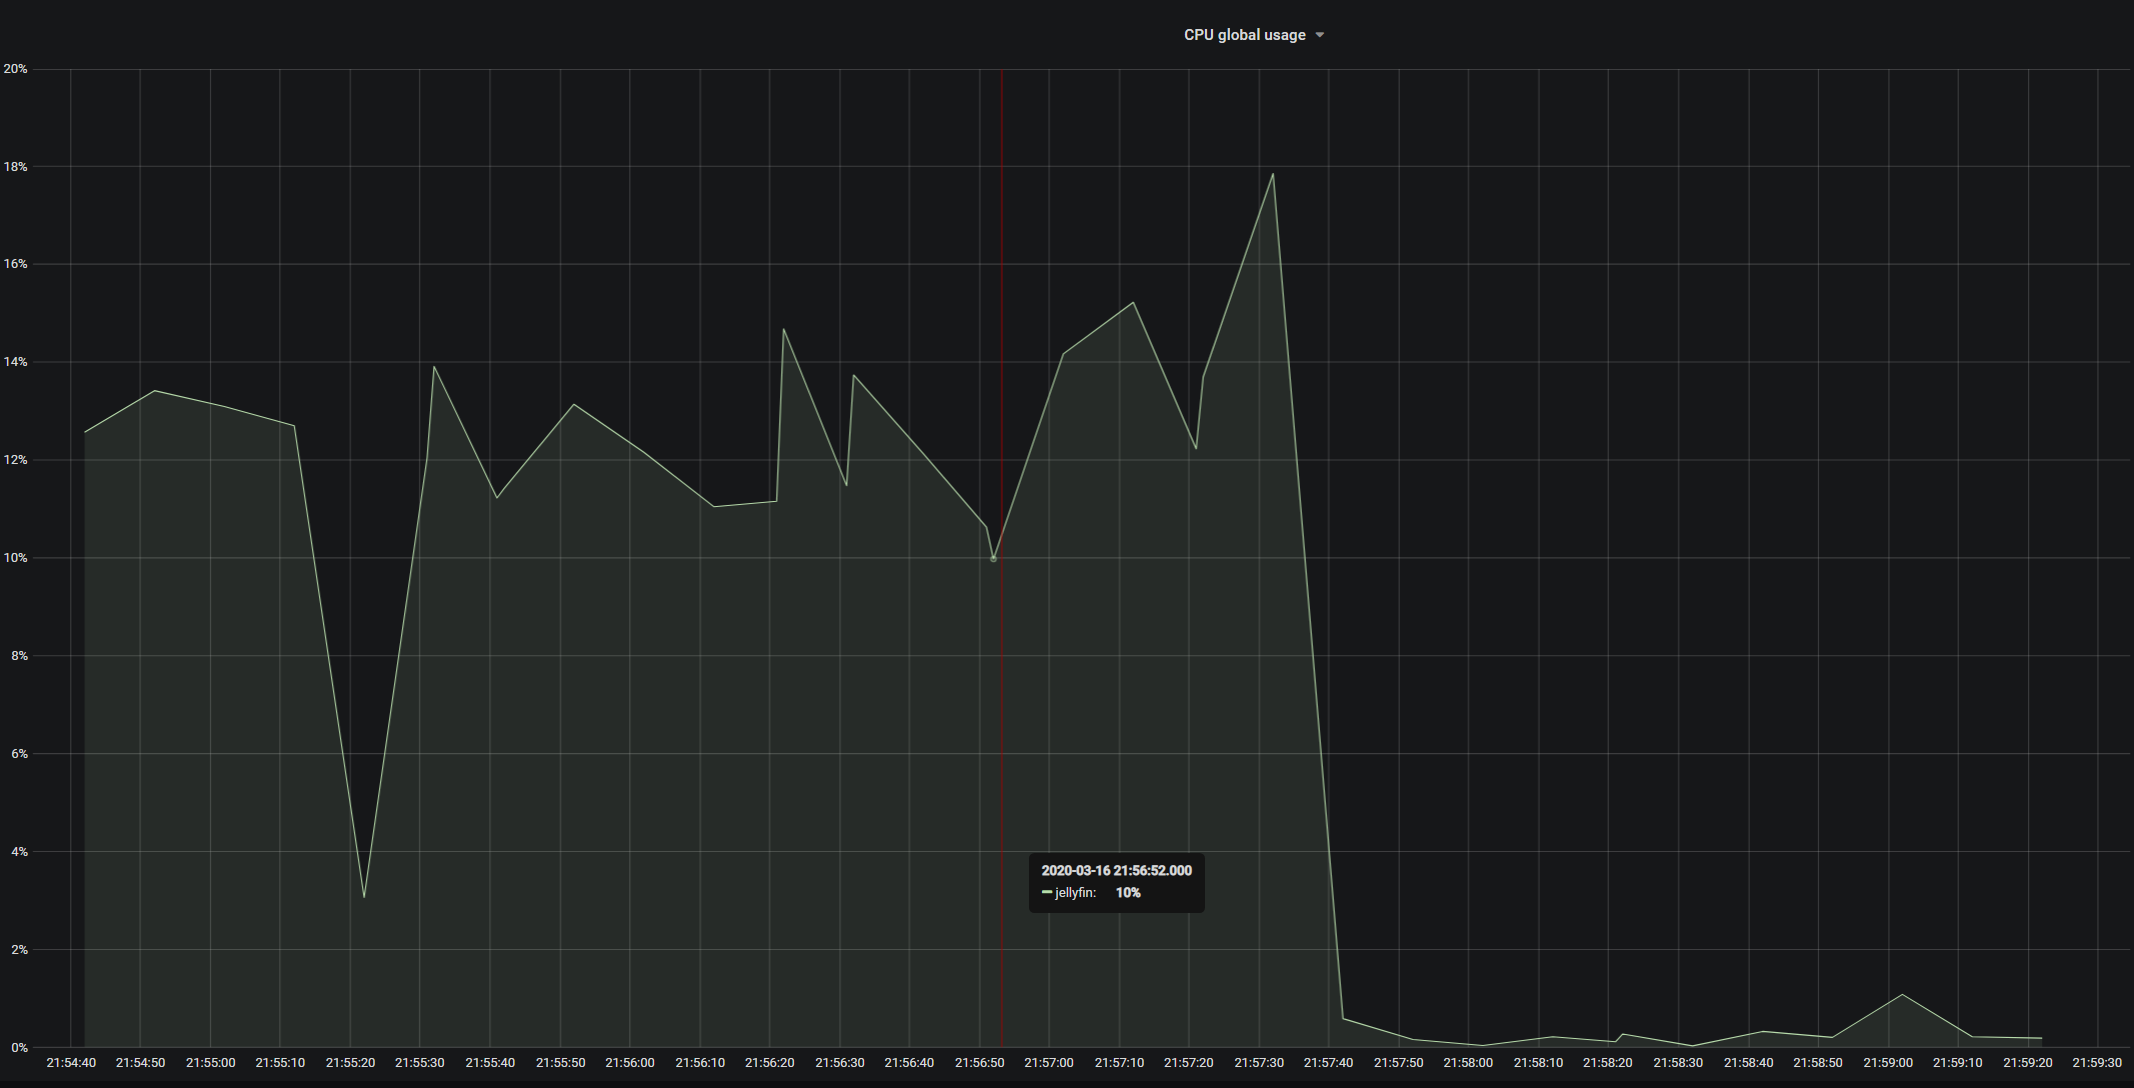
Try to UNCHECK the "Networking->Allow remote connections to this Jellyfin Server " option, if you dont need the remote access or done it by nginx. Works for me.
Yes, this actually worked. CPU usage when idling went down to >0.2%
agilob
on 16 Mar 2020
ECK the "Networking->Allow remote connections to this Jellyfin Server " option, if you dont need the remote access or done it by nginx. Works for me.
That is the answer! Thanks
Just look at this:
goliath888
on 16 Mar 2020
ECK the "Networking->Allow remote connections to this Jellyfin Server " option, if you dont need the remote access or done it by nginx. Works for me.
That is the answer! Thanks
Just look at this:
It works for me too, but now I can't connect to my jellyfin anymore outside of my network using domain name. It says "Forbidden". I'm using traefik as my reverse proxy too. Any idea?
 budimanjojo
on 29 Mar 2020
budimanjojo
on 29 Mar 2020
Hmmmm this bug just became extremely interesting.
 dkanada
on 29 Mar 2020
dkanada
on 29 Mar 2020
So main culprit is the remote connection handling. But I checked Secure connection mode to handled by reverse proxy. So Jellyfin should do nothing and let the reverse proxy doing it's job (in my case Traefik). What is Jellyfin doing when handled by reverse proxy is checked?
budimanjojo
on 29 Mar 2020
I've was working on documenting the networking options yesterday and I from what I can tell here are the two things that the 'allow remote connections' option controls:
- EnableRemoteAccess
- Used to enable/disable UPnP. For UPnP to be enabled, both the
EnableUPnPandEnableRemoteAccesssettings must be true
- If true, turns on filtering of remote IP addresses using the whitelist/blacklist
It's possible, that UPnP is causing this, it does some work in the background on a timer. Maybe someone with this issue can try enabling remote access again, then setting EnableUPnP to false to check if this is the culprit.
 mark-monteiro
on 29 Mar 2020
mark-monteiro
on 29 Mar 2020
I've was working on documenting the networking options yesterday and I from what I can tell here are the two things that the 'allow remote connections' option controls:
EnableRemoteAccess
- Used to enable/disable UPnP. For UPnP to be enabled, both the
EnableUPnPandEnableRemoteAccesssettings must be true- If true, turns on filtering of remote IP addresses using the whitelist/blacklist
It's possible, that UPnP is causing this, it does some work in the background on a timer. Maybe someone with this issue can try enabling remote access again, then setting
EnableUPnPtofalseto check if this is the culprit.
It's work!!!
Thanks you
zedred79
on 29 Mar 2020
I've was working on documenting the networking options yesterday and I from what I can tell here are the two things that the 'allow remote connections' option controls:
EnableRemoteAccess
- Used to enable/disable UPnP. For UPnP to be enabled, both the
EnableUPnPandEnableRemoteAccesssettings must be true- If true, turns on filtering of remote IP addresses using the whitelist/blacklist
It's possible, that UPnP is causing this, it does some work in the background on a timer. Maybe someone with this issue can try enabling remote access again, then setting
EnableUPnPtofalseto check if this is the culprit.
Wow it works.. Disabling enable automatic port mapping brings my idle cpu usage from 11% to 0.5%!
budimanjojo
on 29 Mar 2020
We really should default "automatic port mapping" to "disable". The concept itself is just so... _wrong_ (not in JF, but in general in UPnP).
 JustAMan
on 4 Apr 2020
JustAMan
on 4 Apr 2020
Yeah, I had Jellyfin 10.5.5 doing similar. It would MAX one or sometimes even two cores on my CPU and just hold them there. Just disabling uPnP didn't do it for me, but keeping that off and also disabling all DLNA features did. Jellyfin is now using only about 100MB of Ram, and next to no CPU. So, I would highly recommend giving that a try for anyone that can live without them. Hmm, okay.. I was wrong, after a day or so it is back to maxing out 2 cores of my CPU all the time again.
 sponix
on 4 May 2020
sponix
on 4 May 2020
Can confirm that I've had this in jellyfin (docker), but my htop indicated the builtin ffmpeg was the one hogging 5-10% cpu constantly, which striked me as weird, because (A) I wasn't using the server at the time and (B) all image extraction / chapter image generation had been disabled.
Would have never thought this was UPNP related.
Disabling automatic port forwarding made the cpu usage go away.
Might be related (though not the same project, of course): Plex at one point had an issue with their builtin UPNP client hammering miniupnpd somewhere in the network, pegging one core at 100% constantly too.
 Forceflow
on 7 May 2020
Forceflow
on 7 May 2020
Can confirm that I've had this in jellyfin (docker), but my htop indicated the builtin ffmpeg was the one hogging 5-10% cpu constantly, which striked me as weird, because (A) I wasn't using the server at the time and (B) all image extraction / chapter image generation had been disabled.
Would have never thought this was UPNP related.
Disabling automatic port forwarding made the cpu usage go away.
Might be related (though not the same project, of course): Plex at one point had an issue with their builtin UPNP client hammering miniupnpd somewhere in the network, pegging one core at 100% constantly too.
I have the same exact issue as you, but im unable to fix it by disabling remote conections
 hardwareadictos
on 10 Jun 2020
hardwareadictos
on 10 Jun 2020
Also disabled all DLNA settings and automatic port mapping, anyone tried anything else? My Pi4 has always one core at 100% constantly when Jellyfin container is running, even if its idling with the ffmpeg process, Its only happening with 10.5.5
hardwareadictos
on 14 Jun 2020
Also disabled all DLNA settings and automatic port mapping, anyone tried anything else? My Pi4 has always one core at 100% constantly when Jellyfin container is running, even if its idling with the ffmpeg process, Its only happening with 10.5.5
Have you restarted jellyfin since changing that setting? That was necessary for me to resolve the issue. (JellyFin in Docker)
Forceflow
on 15 Jun 2020
Also disabled all DLNA settings and automatic port mapping, anyone tried anything else? My Pi4 has always one core at 100% constantly when Jellyfin container is running, even if its idling with the ffmpeg process, Its only happening with 10.5.5
Have you restarted jellyfin since changing that setting? That was necessary for me to resolve the issue. (JellyFin in Docker)
I did and it solved the issue momentaneously. After some minutes it starts using one core intensively again.
hardwareadictos
on 15 Jun 2020
I can confirm this as well. Unchecking "Enable automatic port mapping" on the Network settings reduced CPU usage from around 10-15% to essentially 0%
 dufferzafar
on 16 Jun 2020
dufferzafar
on 16 Jun 2020
So now we have some reports that this is the fix and one report that this is only a temporary fix, I wonder if there's some other variable at play here.
dkanada
on 16 Jun 2020
Okay, i can confirm that the only way for me to workaround this is to rollback to 10.4.X Releases...
hardwareadictos
on 17 Jun 2020
Jellyfin 10.5.5 in docker on Ubuntu 20,04 host.
I am glad I found this issue. It was bugging me why I was seeing high load on this server the last couple times I was remoted in or using an app hosted on it. I actually just was messing around with different hardware and was dismissed to the new hardware.
My server load went from 12-13 to 0.2 when changing Enable automatic port mapping under Networking. Will monitor for changes.
 alpacalife
on 20 Jun 2020
alpacalife
on 20 Jun 2020
PR #3339 and #3257 might help.
Jellyfin processes it's own SSDP multicasts. uPNP port mapping was also linked into SSDP detection causing a constant background processing loop.
It also doesn't handle any kind of network changes well.
 BaronGreenback
on 2 Jul 2020
BaronGreenback
on 2 Jul 2020
@BaronGreenback is it possible to split the larger PR into a few smaller parts, e.g. just fix this on its own, without the remaining overhaul, then keep the overhaul separate? We're aiming for a Sunday release, so if the bugfix for this issue is just a small part of the larger network rework PR, we could probably get that in and leave the rest for after, but I'll defer to you as the author.
 joshuaboniface
on 4 Jul 2020
joshuaboniface
on 4 Jul 2020
I'm afraid not - if you decouple the ssdp link from #3339 then there is a chance that uPnP won't detect the gateway.
3339: Mono never picked up my gateway device as it sends out a general "is any device there" call. My device is dual router / wifi AP. When presented with a "is anyone there" it responds only with the wifi AP device. #3339 basically changes the type of "is any device" request to "is there any internet device there", and instantiates the library so it is more network reliant. (My issue is that i have a rather dodgy internet connection - I live in the country - so I tend to see a lot of issues due to router reboots and network outages.)
The original mono code doesn't work well at all as it's a singleton initiated at creation - hence the requirement to import the code, so the change can be made, Apart from this the majority of #3339 is straight from github with the formatting changed to meet Jellyfin standards.
One of the links is that any device picked up via SSDP is passed to mono to process. I suspect this is the work around to make things work.
2986 did do some work with SSDP broadcast blocking (which has been accepted), but whilst putting together that, i came across the loopback, and uPNP would circumvent all that coding anyway.
3257: Puts in the other pieces of the puzzle by checking the IP address of incoming packets and discarding them if they are from ourselves. Theoretically this could be extracted from there, but the amount of testing due to the spaghetti nature of the current network functions would make it risky.
Sorry, some of my PR's tend to be on the large side. Apart from my next #nullable PR - they should be much smaller.
Would be great if we could start looking at these two PR's sooner rather than later - as they make my system far more stable.
Have updated the PR description for #3339
BaronGreenback
on 4 Jul 2020
Hey,
Just deployed yesterday release (latest tag, 10.5.5) and seems that the issue (for the moment) is gone. I'm going to test it furder during some days to certify it.
Thank you!
hardwareadictos
on 6 Jul 2020
Hey,
Just deployed yesterday release (latest tag, 10.5.5) and seems that the issue (for the moment) is gone. I'm going to test it furder during some days to certify it.
Thank you!
Sorry, false alarm, the bug strikes again
hardwareadictos
on 7 Jul 2020
Is the cpu as the same level?
BaronGreenback
on 7 Jul 2020
Also if you enable debug logging for Mono.Nat or Mono.Nat.Searcher then it should show you if uPNP is the culprit as it now has logging.
BaronGreenback
on 7 Jul 2020
I just upgraded from 10.5.5 to 10.6.0 on Arch Linux. This is an actual install without Docker. CPU was constantly between 10-15% even when idle. I've got the following checked, which I'm 99% sure was the default:
Enable DLNA Play To: ENABLED
Enable DLNA server: ENABLED
Blast alive messages: ENABLED
Allow remote connections to this Jellyfin Server: ENABLED
Enable automatic port mapping: ENABLED
I changed Enable automatic port mapping to DISABLED and idle CPU usage dropped to almost zero.
 NearlCrews
on 22 Jul 2020
NearlCrews
on 22 Jul 2020
See above. The PR's are waiting for review and were not included in 10.6.
There's also an additional PR #3529 which filters the SSDP broadcast so should reduce processing.
I haven't been able to reproduce this problem at my end. Have you got many SSDP devices on your network?
BaronGreenback
on 23 Jul 2020
Have you got many SSDP devices on your network?
I just ran tcpdump to check. I've probably got about 60 IPs assigned on my network. The majority of the port 1900 traffic is between Jellyfin and my HDHomeRun. Broadcasts are basically non-existent, so not much in the way of SSDP broadcasts.
NearlCrews
on 23 Jul 2020
@NearlCrews - are you able to do custom builds, and would be willing to try PR #3339?
As i haven't been able to reproduce this issue, i can't say it's a 100% guaranteed fix - but it does have detailed logging - so should be able to tell us what's happening even if it doesn't fix the issue.
BaronGreenback
on 23 Jul 2020
Blast alive messages: ENABLED
I can confirm this behaviour as well.
hardwareadictos
on 23 Jul 2020
@BaronGreenback I can spin up a VM and give it a shot later. I don't have an easy way of doing it on my existing build. Let me take a look later today and I'll get back to you. Thanks again!
NearlCrews
on 23 Jul 2020
I changed
Enable automatic port mappingtoDISABLEDand idle CPU usage dropped to almost zero.
Can confirm this as well - Odroid N2 and Jellyfin doing nothing was at ~10% load all the time. Disabling automatic port mapping and it disappeared from top output (v 10.0.6.5.).
 bugsyb
on 23 Oct 2020
bugsyb
on 23 Oct 2020
Related issues
 anthonylavado
·
3Comments
anthonylavado
·
3Comments
 grravity
·
3Comments
grravity
·
3Comments
 triDcontrols
·
3Comments
triDcontrols
·
3Comments
 MSG-maniac
·
3Comments
MSG-maniac
·
3Comments
 thejacer87
·
3Comments
thejacer87
·
3Comments
Most helpful comment
Try to UNCHECK the "Networking->Allow remote connections to this Jellyfin Server " option, if you dont need the remote access or done it by nginx. Works for me.