Jamulus: Server performance & optimization
Follows from https://github.com/corrados/jamulus/issues/339#issuecomment-657076545 for better focus of the discussion.
So, as the previous issue started to explore multi-threading on the server for better use of resources, I first run a profiling of the app on debian.
Special build with:
qmake "CONFIG+=nosound headless noupcasename debug" "QMAKE_CXXFLAGS+=-pg" "QMAKE_LFLAGS+=-pg" -config debug Jamulus.pro && make clean && make -j
Then run as below, and connecting a couple of clients for a few seconds:
./jamulus --nogui --server --fastupdate
Once disconnecting the clients I gracefully killed the server
pkill -sigterm jamulus
And finally run gprof, with the results posted below:
gprof ./jamulus > gprof.txt
https://gist.github.com/WolfganP/46094fd993906321f1336494f8a5faed
It would be interesting to see those who observed high cpu usage run test sessions and collect profiling information as well to detect bottlenecks and potential code optimizations, before embarking on multi-threading analysis that may require major rewrites.
 WolfganP
All 285 comments
Hi,
I don't know if this is of much help since I don't know what I'm doing here ;) but I generated the data as instructed on my private cloud server.
https://gist.github.com/dingodoppelt/802c40b1cb13c75d96f38b9604fa22df
cheers, nils
 dingodoppelt
on 15 Jul 2020
dingodoppelt
on 15 Jul 2020
Thanks @dingodoppelt Could you please describe the test session/environment? (ie, how many clients connected, which hardware/Operating System you were running the server on, whatever you feel noticeable)
WolfganP
on 15 Jul 2020
@sthenos you mentioned in https://www.facebook.com/groups/507047599870191/?post_id=564455474129403&comment_id=564816464093304 that you're running the server in linux now.
Would it be possible for you to run a profiling session in any of the casual/preparation jam sessions with multiple clients to measure REAL server stress? (obviously not during the WJN main event :-)
WolfganP
on 15 Jul 2020
I tested with 12 clients connected from my machine with small network buffers enabled on 64 samples buffersize.
the server is a cloud hosted kvm virtual rootserver (1fire.hosting) with 2 vcpus, 1 gig of ram on ubuntu 20.04 lowlatency.
If i get the opportunity I'll repeat the test on my other server in a real life scenario.
cheers, nils
dingodoppelt
on 16 Jul 2020
Are you still interested in these data? I can run a few tests on ubuntu over the weekend.
Is there a particular release or tag we should checkout as I tried last week to compile but it froze my server.
 storeilly
on 18 Jul 2020
storeilly
on 18 Jul 2020
One quick comment @WolfganP -- for some reason you build command line (rather than a simple qmake) causes the TARGET = jamulus line to trigger... I don't understand why!
EDIT Dawn strikes... Yes, it does have noupcase in the CONFIG+=... I just couldn't see it...
So if you're on anything but Windows, you'll probably want to mv it back again, otherwise start up scripts, etc, won't work.
Final edit to note: jamulus.drealm.info is running with profiling. I'll leave it up over the weekend so it should amass a fair amount of data. I'll run the gprof on Monday. Obviously a bit more "real world", as I run with logging and recording enabled, so I'm expecting different number...
 pljones
on 18 Jul 2020
pljones
on 18 Jul 2020
A different view should come from the Rock and Clasical/Folk/Choir genre servers that I've just updated to r3_5_9 with profiling.
make distclean
qmake "CONFIG+=nosound headless debug" "QMAKE_CXXFLAGS+=-pg" "QMAKE_LFLAGS+=-pg" -config debug Jamulus.pro
make -j
make clean
They probably won't show much OPUS usage but this should show anything that's "weird" with server list server behaviour (although they only have about 20 registering servers, until Default).
I wasn't sure what CONFIG+=debug and -config debug added -- the code appeared to have symbols regardless.
pljones
on 19 Jul 2020
@pljones yes, I added debug flags to qmake just to make sure all symbols are included and no stripping is applied.
Anyways, a good way to check if symbols were included in the final exec and gprof instrumentation applied is objdump --syms jamulus | grep -i mcount (mcount* being the snippets of code added for profiling instrumentation)
WolfganP
on 19 Jul 2020
Standard build:
peter@fs-peter:~$ objdump --syms git/Jamulus-wip/Jamulus | grep -i mcount
0000000000000000       F *UND*  0000000000000000              mcount@@GLIBC_2.2.5
This just changing the binary to "Jamulus", IIRC:
peter@fs-peter:~$ objdump --syms git/Jamulus/Jamulus | grep -i mcount
0000000000000000       F *UND*  0000000000000000              mcount@@GLIBC_2.2.5
This was
make distclean; qmake "CONFIG+=nosound headless debug" "QMAKE_CXXFLAGS+=-pg" "QMAKE_LFLAGS+=-pg" -config debug Jamulus.pro; make -j; make clean
peter@fs-peter:~$ objdump --syms git/Jamulus-stable/Jamulus | grep -i mcount
0000000000000000       F *UND*  0000000000000000              mcount@@GLIBC_2.2.5
Had a few people tonight noticing additional jitter. Not everyone... Those who noticed - myself included - had just upgraded to 3.5.9. No idea why... (I "fixed" it for the evening by upping my buffer size from 64 to 128.)
14 clients connected to the server and it's looking like this in top:
  PID USER      PR  NI    VIRT    RES    SHR S %CPU %MEM     TIME+ COMMAND
32704 Jamulus  -21   0  320.3m  28.6m   9.1m S 10.8  0.2  80:09.58 Jamulus-server
 1066 root     -51   0    0.0m   0.0m   0.0m S  0.2  0.0  10:15.69 irq/130-enp2s0-
 1070 root     -51   0    0.0m   0.0m   0.0m S  0.1  0.0   3:27.74 irq/132-enp2s0-
 1071 root     -51   0    0.0m   0.0m   0.0m S  0.1  0.0   4:00.96 irq/133-enp2s0-
Mmm, I guess those enp2s0 IRQ handlers are a bit busy as that's the network interface... There are actually five, it seems:
peter@fs-peter:~$ ps axlww -L | grep enp2s0
1     0  1063     2  1063 -51   -      0     0 -      S    ?          0:00 [irq/129-enp2s0]
1     0  1066     2  1066 -51   -      0     0 -      S    ?         10:06 [irq/130-enp2s0-]
1     0  1068     2  1068 -51   -      0     0 -      S    ?          0:01 [irq/131-enp2s0-]
1     0  1070     2  1070 -51   -      0     0 -      S    ?          3:22 [irq/132-enp2s0-]
1     0  1071     2  1071 -51   -      0     0 -      S    ?          3:56 [irq/133-enp2s0-]
but it copes with only three in heavy demand. 129 and 131 seem left out.
Let's see what the gprof looks like in the morning :).
pljones
on 19 Jul 2020
OK, I decided to restart the central servers without profiling before I totally forget, so all the number are now in.
Jamulus-Central1 gprof.out
Jamulus-Central2 gprof.out
jamulus.drealm.info gprof.out
pljones
on 20 Jul 2020
OK, I decided to restart the central servers without profiling before I totally forget, so all the number are now in.
Jamulus-Central1 gprof.out
Jamulus-Central2 gprof.out
jamulus.drealm.info gprof.out
Thx for the info @pljones, good to also have some performance info for the Central Server role.
Regarding the info on the audio server role, it seems it confirms the CPU impact of CServer::ProcessData and some Opus routines (I assume that as a result of the mix processing inside CServer::OnTimer), and that make sense (at least to me).
On the Opus codec front, I found this article worthy to read: https://freac.org/developer-blog-mainmenu-9/14-freac/257-introducing-superfast-conversions/ (code at https://github.com/enzo1982/superfast#superfast-codecs)
Another item I think needs some attention (or verify is already optimized) is the buffering of audio blocks to avoid unnecessary memcopies. But still reading the code :-)
WolfganP
on 20 Jul 2020
Are you still interested in these data? I can run a few tests on ubuntu over the weekend.
Is there a particular release or tag we should checkout as I tried last week to compile but it froze my server.
Of course @storeilly the more information the better to compare performance on diff use cases and verify common patterns of CPU usage, and direct optimization efforts.
WolfganP
on 20 Jul 2020
Here is a short test on GCP n1-standard-2 (2 vCPUs, 7.5 GB memory) ubuntu 18.04.
A single user connected for a few seconds. I'm running the server overnight with two instances, one on a private central and another on jamulusclassical.fischvolk.de:22524 for more data
storeilly
on 21 Jul 2020
Overnights with 1 or 2 connections... Choir meeting later so will run again after that
storeilly
on 22 Jul 2020
Thanks @storeilly for the files, but those last 2 indicate a period of app usage extremely short, it doesn't even register significant stats to evaluate (even the cumulative times are in 0.00).
WolfganP
on 22 Jul 2020
Oh sorry about that, maybe because I had them running as a service. I saw the message just before the choir meeting so ran this up as a live instance. We only had 8 connections for about 90 mins so I hope it is of some use.
storeilly
on 22 Jul 2020
Thanks @storeilly, that latest file is more representative of a live session and similar to the others posted previously. Thx a lot for sharing.
WolfganP
on 22 Jul 2020
For your info: I will change the ProcessData function now to avoid some of the Double2Short calls and have a better clipping behavior.
 corrados
on 23 Jul 2020
corrados
on 23 Jul 2020
For your info: I will change the ProcessData function now to avoid some of the Double2Short calls and have a better clipping behavior.
Excellent @corrados , we can keep running profiling sessions here and there and measure the improvements.
CMovingAv (in src/util.h) is another function that is called very frequently according to the stats, do you mind to check if no unnecessary typing switch in there is performed as well?
Another thing that I couldn't still pay sufficient attention is the management of buffers of audio blocks, to make sure unnecessary memcopies are avoided. Do you recall how is it implemented?
WolfganP
on 23 Jul 2020
I will do further investigations when I return from my vacation.
corrados
on 24 Jul 2020
Is there a possibility somebody can build a Windows exe with profiling config? A friend is trying a multi server load test on Windows tomorrow evening?
storeilly
on 28 Jul 2020
Is there a possibility somebody can build a Windows exe with profiling config? A friend is trying a multi server load test on Windows tomorrow evening?
https://docs.microsoft.com/en-us/visualstudio/profiling/running-profiling-tools-with-or-without-the-debugger?view=vs-2017
Virtually all the docs refer to working in Visual Studio using graphical tools rather than simple tools like gprof. This was about the closest I could find...
The Windows build doesn't seem to like "CONFIG+=nosound headless"
...src\../windows/sound.h(28): fatal error C1083: Cannot open include file: 'QMessageBox': No such file or directory
Leaving headless out lets the build run. (Though nosound should prevent ...src\../windows/sound.h being used, surely?)
So, Qt Creator under Windows has an "Analyze -> Performance Analyzer" tool. First thing, it kicks off the compile... Before it tries to run, it says

Hm. Surely it can check what OS it's running on (i.e. it's Windows!) and disable the menu item entirely? No... So hit OK. It then fails:

Yes, quite. And then, just to make sure you know it didn't work:

pljones
on 28 Jul 2020
https://gist.github.com/dingodoppelt/9fecd468be2176dacd6d6d3ae3d1d078
here is another one.
a public server (that hasn't seen too much use) on a 4 core cpu. It ran on the most recent code including the reduction of doubletoshort calls, if that is of any interest here.
dingodoppelt
on 30 Jul 2020
Thanks dingodoppelt. In your profile log the ProcessData() function is much lower in the list compared to the profile given by storeilly in jamprof03.txt. So maybe the Double2Short optimization may already have given us a faster Jamulus server.
corrados
on 31 Jul 2020
I've been dabbling with getting my service units to run at real time priority. The 2013 documentation linked from one of the guides is actually out of date. There's no need to fuss with changing cgroups from within the service unit - the latest kernels are quite happy dealing with individual slices.
[Service]
CPUSchedulingPolicy=rr
CPUSchedulingPriority=99
IOSchedulingClass=realtime
IOSchedulingPriority=3
Having said that, I noticed something when checking the status with ps:
peter@fs-peter:~/git/Jamulus-wip$ sudo chrt -r 99 sudo -u peter ./Jamulus -s -n -p 55850 -R /tmp/recording; rm -rf /tmp/recording/  - server mode chosen
- no GUI mode chosen
- selected port number: 55850
- recording directory name: /tmp/recording
Recording state enabled
 *** Jamulus, Version 3.5.10git
 *** Internet Jam Session Software
 *** Released under the GNU General Public License (GPL)
So that starts up the server real time quite happily:
peter@fs-peter:~/git/Jamulus-wip$ ps axwwH -eo user,pid,tid,spid,class,pri,comm,args | sort +5n | grep 'PID\|Jamulus' | grep 'PID\|^peter'
USER       PID   TID  SPID CLS PRI COMMAND         COMMAND
peter    11320 11322 11322 TS   19 Jamulus::CSocke ./Jamulus -s -n -p 55850 -R /tmp/recording
peter    11320 11320 11320 RR  139 Jamulus         ./Jamulus -s -n -p 55850 -R /tmp/recording
peter    11320 11321 11321 RR  139 Jamulus::JamRec ./Jamulus -s -n -p 55850 -R /tmp/recording
What I couldn't follow in the thread flow of control was why CSocket loses real time and yet JamRecorder retains it.
I'm looking to drop the priority of the jam recorder, really - and I'd have thought the socket handling code wanted to retain it?
Here's the patch that names the CSocket thread:
peter@fs-peter:~/git/Jamulus-wip$ git diff
diff --git a/src/server.cpp b/src/server.cpp
index fe9b50a8..ed1bae35 100755
--- a/src/server.cpp
+++ b/src/server.cpp
@@ -58,6 +58,8 @@ CHighPrecisionTimer::CHighPrecisionTimer ( const bool bNewUseDoubleSystemFrameSi
     veciTimeOutIntervals[1] = 1;
     veciTimeOutIntervals[2] = 0;

+    setObjectName ( "Jamulus::CHighPrecisionTimer" );
+
     // connect timer timeout signal
     QObject::connect ( &Timer, &QTimer::timeout,
         this, &CHighPrecisionTimer::OnTimer );
diff --git a/src/socket.h b/src/socket.h
index adc9c67f..b4ec15e9 100755
--- a/src/socket.h
+++ b/src/socket.h
@@ -169,7 +169,9 @@ protected:
     {
     public:
         CSocketThread ( CSocket* pNewSocket = nullptr, QObject* parent = nullptr ) :
-          QThread ( parent ), pSocket ( pNewSocket ), bRun ( true ) {}
+          QThread ( parent ), pSocket ( pNewSocket ), bRun ( true ) {
+        setObjectName ( "Jamulus::CSocketThread" );
+    }

         void Stop()
         {
(I don't know what CHighPrecisionTimer is used for but I didn't see it get a thread - maybe it's for short-lived stuff?)
pljones
on 1 Aug 2020
The way I understood the server code, CHighPrecisionTimer is the base for the "realtime" processing of client audio mixes at ProcessData (one of the functions topping the performance charts consistently) via the OnTimer interrupt occurring every 1ms (https://github.com/corrados/jamulus/blob/f67dbd1290a579466ff1f315457ad9090b39747e/src/server.cpp#L792)
That async processing of data via the timer, was probably why the early parallelization test didn't work as intended.
WolfganP
on 1 Aug 2020
I've also noticed the following:
USER       PID   TID  SPID CLS PRI COMMAND         COMMAND
peter    18959 18962 18962 TS   19 Jamulus::CSocke ./Jamulus -s -p 55850 -R /tmp/recording
peter    18959 18959 18959 RR  139 Jamulus         ./Jamulus -s -p 55850 -R /tmp/recording
peter    18959 18960 18960 RR  139 QXcbEventReader ./Jamulus -s -p 55850 -R /tmp/recording
peter    18959 18961 18961 RR  139 Jamulus::JamRec ./Jamulus -s -p 55850 -R /tmp/recording
peter    18959 18963 18963 RR  139 QDBusConnection ./Jamulus -s -p 55850 -R /tmp/recording
When kicking off the server with the GUI enabled at RT priority, the GUI runs at RT priority, too! That's definitely not wanted.
EDIT:
USER       PID   TID  SPID CLS PRI COMMAND         COMMAND
peter    19817 19820 19820 TS   19 Jamulus::CSocke ./Jamulus -s -p 55850 -R /tmp/recording
peter    19817 19883 19883 TS   19 Jamulus::CHighP ./Jamulus -s -p 55850 -R /tmp/recording
peter    19817 19817 19817 RR  139 Jamulus         ./Jamulus -s -p 55850 -R /tmp/recording
peter    19817 19818 19818 RR  139 QXcbEventReader ./Jamulus -s -p 55850 -R /tmp/recording
peter    19817 19819 19819 RR  139 Jamulus::JamRec ./Jamulus -s -p 55850 -R /tmp/recording
peter    19817 19821 19821 RR  139 QDBusConnection ./Jamulus -s -p 55850 -R /tmp/recording
And with a user connected to start up CHighPrecisionTimer. That also drops out of RT.
pljones
on 1 Aug 2020
Ah yes: CHighPrecisionTimer -> OnTimer. I think I did work that out once.
My "instinct" is that:
- RR/FF Real time -> CHighPrecisionTimer (for a steady OnTimer)
- RR/FF RT (or very high priority) -> CServer (to process OnTimer), CSocketThread (to process CServer requests)
- TS 19 ("normal") -> JamRecorder, GUI (QXcbEventReader, QDBusConnection)
I've still not understood why CSocketThread drops RT and yet I can't explain to Qt that I want JamRecorder to drop RT...
pljones
on 1 Aug 2020
486 relates to the client configured with "nosound" and vaguely relates to performance, so I'll mention it here.
pljones
on 1 Aug 2020
I've still not understood why CSocketThread drops RT
see: https://github.com/corrados/jamulus/blob/master/src/socket.h#L153 and https://github.com/corrados/jamulus/blob/master/src/socket.h#L209
At these places the priority is defined.
corrados
on 2 Aug 2020
Yes - but I don't see why QThread::TimeCriticalPriority means the thread gets TS 19 rather than something actually high. TS 19 is what a login shell or any other "normal" process is scheduled at.
USER       PID   TID  SPID CLS PRI COMMAND         COMMAND
Jamulus   2235  2251  2251 TS   19 QThread         /opt/Jamulus/bin/Jamulus-server -s -n -F -p 54850 -u 30 -e jamulus.fischvolk.de:22224 -m /opt/Jamulus/run/status.html -l /opt/Jamulus/log/Jamulus.log -y /opt/Jamulus/log/history.svg -L -R /opt/Jamulus/run/recording -a jamulus.drealm.info -o jamulus.drealm.info;London;224 -w ...
peter     4053  4053  4053 TS   19 grep            grep --color=auto PID\|bin/Jamulus
Jamulus   2235  2250  2250 RR  139 Jamulus::JamRec /opt/Jamulus/bin/Jamulus-server -s -n -F -p 54850 -u 30 -e jamulus.fischvolk.de:22224 -m /opt/Jamulus/run/status.html -l /opt/Jamulus/log/Jamulus.log -y /opt/Jamulus/log/history.svg -L -R /opt/Jamulus/run/recording -a jamulus.drealm.info -o jamulus.drealm.info;London;224 -w ...
- 2235 is the main server thread
- 2251 is the QSocketThread (unpatched Jamulus)
and - 4053 is a normal user process
Also, if I patch the Jam recorder:
pthJamRecorder->start ( QThread::NormalPriority );
it _doesn't_ drop (but the network thread does - so it's not because of how I'm running the server):
USER       PID   TID  SPID CLS PRI COMMAND         COMMAND
peter     3856  3858  3858 TS   19 Jamulus::CSocke ./Jamulus -s -n -p 55850 -R /tmp/recording
peter     3952  3952  3952 TS   19 grep            grep --color=auto PID\|\./Jamulus
peter     3953  3953  3953 TS   19 grep            grep --color=auto PID\|^peter
peter     3856  3856  3856 RR  139 Jamulus         ./Jamulus -s -n -p 55850 -R /tmp/recording
peter     3856  3857  3857 RR  139 Jamulus::JamRec ./Jamulus -s -n -p 55850 -R /tmp/recording
It's as if passing the priority isn't having the documented effect and something else entirely is happening.
pljones
on 2 Aug 2020
Well... this is ... peculiar. I've got the JamRecorder priority down.
peter@fs-peter:~$ ps axwwH -eo user,pid,spid,class,pri,comm,args | sort +4n | grep 55850
peter    21623 21624 TS   19 JamRecorder     /opt/Jamulus/bin/Jamulus-wip -s -n -F -p 55850 -u 4 -L -R /tmp/recording -a drealm.info Test Server
peter    21623 21625 TS   19 CSocketThread   /opt/Jamulus/bin/Jamulus-wip -s -n -F -p 55850 -u 4 -L -R /tmp/recording -a drealm.info Test Server
peter    21628 21628 TS   19 grep            grep --color=auto 55850
peter    21623 21623 RR  139 Jamulus-wip     /opt/Jamulus/bin/Jamulus-wip -s -n -F -p 55850 -u 4 -L -R /tmp/recording -a drealm.info Test Server
That was done by moving the new instance to the new thread, connecting the signals/slots and calling pthJamRecorder->start ( QThread::NormalPriority ); - in that order.
Moving to the new thread _after_ connecting up and the priority setting was ignored.
However, using pthJamRecorder->start ( QThread::TimeCriticalPriority ); rather than NormalPriority made no difference -- still get TS 19 rather than RR 139.
Not specifying a priority in the start call gets the RR 139 (i.e. putting everything back how I'd had it).
So it definitely looks like passing the priority is behaving ... _strangely_ ...
pljones
on 3 Aug 2020
I need your help. I have done some multithreading implementation for the server using QtConcurrent. I need to see if this is the right path. So if you have a multi-core CPU and would like to do some evaluation for me, please do the following:
git clone https://github.com/corrados/jamulus.git
cd jamulus
git checkout --track origin/qtconcurrentrun_test
qmake "CONFIG+=nosound headless multithreading"
make
Please make sure that you see "_Project MESSAGE: Multithreading in the server is enabled._"
_edit: the code is now merged to the master branch, no need to checkout a special branch anymore_
corrados
on 4 Aug 2020
@corrados I was looking at QtConcurrent examples as well (https://www.bogotobogo.com/Qt/Qt5_QtConcurrent_RunFunction_QThread.php) lately, after looking at how QTimer was implemented (https://doc.qt.io/qt-5/qtimer.html)
Basically is a high priority events queue inside the Qt framework, not a hard interrupt timer as the low level ones used in basic/close to the metal apps.
Interesting thou, the official doc says: In multithreaded applications, you can use QTimer in any thread that has an event loop. To start an event loop from a non-GUI thread, use QThread::exec(). Qt uses the timer's thread affinity to determine which thread will emit the timeout() signal. Because of this, you must start and stop the timer in its thread; it is not possible to start a timer from another thread. so that could probably affect the way concurrent Qthreads are created as they probably have to own it's own timer as per the docs?
WolfganP
on 4 Aug 2020
Good question. But now we have a first implementation and we should use that as a benchmark. I would be very interesting how this new code behaves if a lot of clients are connected and a multi-core CPU is used.
corrados
on 4 Aug 2020
Good question. But now we have a first implementation and we should use that as a benchmark. I would be very interesting how this new code behaves if a lot of clients are connected and a multi-core CPU is used.
Perfect! I'll try the new branch separated from the master.
BTW, for stress testing and reproducible benchmarking purposes, is there any quick way you can modify the client code to connect as multiple clients and inject multiple streams? (even if it drops the audio mix back, fake a sine-wave tone or inject an audio file w/o connecting to an actual interface, ...)
Anything that we can quickly simulate 2, 4, 12, 36, ... whatever clients actively connected and stress the server easy and in a controlled way...
WolfganP
on 4 Aug 2020
one more:
same server as last time, this time with multithreading enabled. all clients were on small network buffers. i'll give it another try on 128 samples and with more clients
https://gist.github.com/dingodoppelt/4f81a6dcaca85b119160f41ad0fe370b
dingodoppelt
on 4 Aug 2020
Thanks Nils. The problem with the profile is that we cannot see how many CPU cores are actually used and how good the multithreading works. I guess we need some real-world tests where we have multiple musicians connected and check if the server still works correctly (no audio issues, stability) and monitor the CPU load with, e.g., htop to see if the load is equally distributed over all CPU cores.
corrados
on 4 Aug 2020
I guess we need some real-world tests where we have multiple musicians connected and check if the server still works correctly (no audio issues, stability) and monitor the CPU load with, e.g., htop to see if the load is equally distributed over all CPU cores.
That's why I suggested in my previous comment some quick and dirty mod to the client where the load can be simulated in lab conditions, so all measurements can be comparable (ie 1, 2, 12, 50 active connected clients; server in mono or multi-thread, different strategies/branches/optimizations).
It doesn't need to be pretty :-)
WolfganP
on 4 Aug 2020
May this be of any help?

dingodoppelt
on 4 Aug 2020
That's interesting. You only have three Jamulus threads but since your CPU has four cores you should have at least four Jamulus threads. Can you please make sure that you are running the correct Jamulus binary? It seems the "multithreading" is not enabled in that binary you are running.
corrados
on 4 Aug 2020
For your information: I did some tests today and also cleanup up the code so that it is now ready to be merged to master. So I will merge the code and delete the branch. Then if you want to test that new code, simply clone the latest git code and use the CONFIG multithreaded switch.
corrados
on 4 Aug 2020
Tagging #491 which adds thread names. And drops the priority of the JamRecorder (which was an issue if you're running the main server thread at realtime).
pljones
on 4 Aug 2020
May this be of any help?
Good test @dingodoppelt . Do you mind to describe how did you get the 30 clients test? (were they simulated or real clients? were they running in windows, linux; GUI or headless?))
WolfganP
on 4 Aug 2020
Good test @dingodoppelt . Do you mind to describe how did you get the 30 clients test? (were they simulated or real clients? were they running in windows, linux; GUI or headless?))
I launched them on Linux via bash script in headless mode.
That's interesting. You only have three Jamulus threads but since your CPU has four cores you should have at least four Jamulus threads. Can you please make sure that you are running the correct Jamulus binary? It seems the "multithreading" is not enabled in that binary you are running.
You're right, I misspelled "multihreading" in the qmake line :) I enabled it now and it really keeps the CPU usage down and nicely balanced. What I found still is that audio quality degrades at a certain amount of clients depending on their usage of small network buffers though the CPU cores aren't maxed out. But I don't know how much I can trust my tests since I'm running all clients on one machine and internet connection.
dingodoppelt
on 5 Aug 2020
@dingodoppelt Are you running the server SCHED_RR/SCHED_FIFO or SCHED_OTHER and what priority/nice values?
pljones
on 5 Aug 2020
@pljones : [Unit]
Description=Jamulus-Server
After=network.target
[Service]
Type=simple
User=jamulus
Group=nogroup
NoNewPrivileges=true
ProtectSystem=true
ProtectHome=true
Nice=-20
IOSchedulingClass=realtime
IOSchedulingPriority=0
CPUSchedulingPolicy=rr
CPUSchedulingPriority=99
dingodoppelt
on 5 Aug 2020
And if you run
ps axwwH -eo user,pid,spid,class,pri,comm,args | sort +4n | grep '^jamulus\|^USER'
What's the output showing now?
pljones
on 5 Aug 2020
@pljones
USER         PID    SPID CLS PRI COMMAND         COMMAND
jamulus     1509    1517 TS   39 QThread         /usr/local/bin/Jamulus -s -F -n -u 20 -w <br><h1 style=text-align:center>FetteHupeBackstage</h1><p style=text-align:center>Willkommen auf dem <b>privaten</b> Jamulus Server der Big Band <b>Fette Hupe</b> aus Hannover</p><p style=text-align:center><b>https://fettehupe.de</b></p><p style=text-align:left></p> -o FetteHupe;Frankfurt;82
jamulus     1509    1509 RR  139 Jamulus         /usr/local/bin/Jamulus -s -F -n -u 20 -w <br><h1 style=text-align:center>FetteHupeBackstage</h1><p style=text-align:center>Willkommen auf dem <b>privaten</b> Jamulus Server der Big Band <b>Fette Hupe</b> aus Hannover</p><p style=text-align:center><b>https://fettehupe.de</b></p><p style=text-align:left></p> -o FetteHupe;Frankfurt;82
dingodoppelt
on 5 Aug 2020
You've lost the formatting and at least one line of output there (PID 1509 / SPID 1517 - so there should be a line for SPID 1509 itself).
this is the exact output of the command you sent. how do I keep the formatting?
dingodoppelt
on 5 Aug 2020
USER    PID  SPID CLS PRI COMMAND COMMAND
jamulus 1509 1517 TS   39 QThread /usr/local/bin/Jamulus
jamulus 1509 1509 RR  139 Jamulus /usr/local/bin/Jamulus
My guess as to why this set up (which I've been using, to) has some instability in network performance, is the QThread ("high priority") socket thread is being busied out by the main Jamulus thread.
```
block
```
preserves formatting, by the way
pljones
on 5 Aug 2020
USER         PID    SPID CLS PRI COMMAND         COMMAND
jamulus     1842    1852 TS   39 QThread         /usr/local/bin/Jamulus -s -F -n -u 25 -w <br><h1 style=text-align:center>FetteHupeBackstage</h1><p style=text-align:center>Willkommen auf dem <b>privaten</b> Jamulus Server der Big Band <b>Fette Hupe</b> aus Hannover</p><p style=text-align:center><b>https://fettehupe.de</b></p><p style=text-align:left></p> -o FetteHupe;Frankfurt;82
jamulus     1842    1842 RR  139 Jamulus         /usr/local/bin/Jamulus -s -F -n -u 25 -w <br><h1 style=text-align:center>FetteHupeBackstage</h1><p style=text-align:center>Willkommen auf dem <b>privaten</b> Jamulus Server der Big Band <b>Fette Hupe</b> aus Hannover</p><p style=text-align:center><b>https://fettehupe.de</b></p><p style=text-align:left></p> -o FetteHupe;Frankfurt;82
I relaunched the server and pasted the new output.
My guess as to why this set up (which I've been using, to) has some instability in network performance, is the QThread ("high priority") socket thread is being busied out by the main Jamulus thread.
That sounds very interesting. What priority or scheduling setting would you recommend then? I'm having issues with my two core server and maybe I can get any "audible" improvements on that one.
dingodoppelt
on 5 Aug 2020
If you add cpuid to the ps line it will also show which core the thread is assigned to:
ps axwwH -eo user,pid,spid,class,cpuid,pri,comm,args | sort +4n | grep '^jamulus\|^USER'
WolfganP
on 5 Aug 2020
You could apply this patch (it's a git diff, so patch -p1 to apply):
diff --git a/src/socket.h b/src/socket.h
index 232725ed..f36055d9 100755
--- a/src/socket.h
+++ b/src/socket.h
@@ -149,8 +151,9 @@ public:
     void Start()
     {
         // starts the high priority socket receive thread (with using blocking
-        // socket request call)
-        NetworkWorkerThread.start ( QThread::TimeCriticalPriority );
+        // socket request call - priorty is "ignored" on linux: actually broken)
+        //NetworkWorkerThread.start ( QThread::TimeCriticalPriority );
+        NetworkWorkerThread.start();
     }

     void SendPacket ( const CVector<uint8_t>& vecbySendBuf,
If you also apply #491 you'll get the thread names (and, if you use the recorder, that _won't_ run RT).
In the meantime, I've been trying to get pThreads priorities working...
diff --git a/src/socket.h b/src/socket.h
index 232725ed..f36055d9 100755
--- a/src/socket.h
+++ b/src/socket.h
@@ -34,6 +34,8 @@
#ifndef _WIN32
# include <netinet/in.h>
# include <sys/socket.h>
+# include <sched.h>
+# include <pthread.h>
#endif
@@ -169,7 +172,18 @@ protected:
{
public:
CSocketThread ( CSocket* pNewSocket = nullptr, QObject* parent = nullptr ) :
- QThread ( parent ), pSocket ( pNewSocket ), bRun ( true ) { setObjectName ( "CSocketThread" ); }
+ QThread ( parent ), pSocket ( pNewSocket ), bRun ( true )
+ {
+ setObjectName ( "CSocketThread" );
+
+#ifdef SCHED_RR
+struct sched_param param;
+param.sched_priority = sched_get_priority_max ( SCHED_RR ) -
+ ( sched_get_priority_max ( SCHED_RR ) - sched_get_priority_min ( SCHED_RR ) ) / 5;
+qInfo() << "SCHED_RR defined, setting sched_priority to" << param.sched_priority;
+pthread_setschedparam( pthread_self(), SCHED_RR, ¶m );
+#endif
+ }
void Stop()
{
That had no effect...
pljones
on 5 Aug 2020
USER         PID    SPID CLS CPUID PRI COMMAND         COMMAND
jamulus    11844   12162 TS      1  39 CHighPrecisionT /usr/local/bin/Jamulus -s -n -F -u 25 -w <br><h1 style=text-align:center>FetteHupe</h1><p style=text-align:center>Willkommen auf dem Jamulus Server der Big Band <b>Fette Hupe</b> aus Hannover</p><p style=text-align:center><b>https://fettehupe.de</b></p><p style=text-align:left></p> -e jamulus.fischvolk.de -o FetteHupe;Frankfurt;82
jamulus    11844   12164 RR      1 139 Thread (pooled) /usr/local/bin/Jamulus -s -n -F -u 25 -w <br><h1 style=text-align:center>FetteHupe</h1><p style=text-align:center>Willkommen auf dem Jamulus Server der Big Band <b>Fette Hupe</b> aus Hannover</p><p style=text-align:center><b>https://fettehupe.de</b></p><p style=text-align:left></p> -e jamulus.fischvolk.de -o FetteHupe;Frankfurt;82
jamulus    11844   12163 RR      2 139 Thread (pooled) /usr/local/bin/Jamulus -s -n -F -u 25 -w <br><h1 style=text-align:center>FetteHupe</h1><p style=text-align:center>Willkommen auf dem Jamulus Server der Big Band <b>Fette Hupe</b> aus Hannover</p><p style=text-align:center><b>https://fettehupe.de</b></p><p style=text-align:left></p> -e jamulus.fischvolk.de -o FetteHupe;Frankfurt;82
jamulus    11844   11844 RR      3 139 Jamulus         /usr/local/bin/Jamulus -s -n -F -u 25 -w <br><h1 style=text-align:center>FetteHupe</h1><p style=text-align:center>Willkommen auf dem Jamulus Server der Big Band <b>Fette Hupe</b> aus Hannover</p><p style=text-align:center><b>https://fettehupe.de</b></p><p style=text-align:left></p> -e jamulus.fischvolk.de -o FetteHupe;Frankfurt;82
jamulus    11844   11856 TS      3  39 QThread         /usr/local/bin/Jamulus -s -n -F -u 25 -w <br><h1 style=text-align:center>FetteHupe</h1><p style=text-align:center>Willkommen auf dem Jamulus Server der Big Band <b>Fette Hupe</b> aus Hannover</p><p style=text-align:center><b>https://fettehupe.de</b></p><p style=text-align:left></p> -e jamulus.fischvolk.de -o FetteHupe;Frankfurt;82
jamulus    11844   12165 RR      3 139 Thread (pooled) /usr/local/bin/Jamulus -s -n -F -u 25 -w <br><h1 style=text-align:center>FetteHupe</h1><p style=text-align:center>Willkommen auf dem Jamulus Server der Big Band <b>Fette Hupe</b> aus Hannover</p><p style=text-align:center><b>https://fettehupe.de</b></p><p style=text-align:left></p> -e jamulus.fischvolk.de -o FetteHupe;Frankfurt;82
jamulus    11844   12166 RR      3 139 Thread (pooled) /usr/local/bin/Jamulus -s -n -F -u 25 -w <br><h1 style=text-align:center>FetteHupe</h1><p style=text-align:center>Willkommen auf dem Jamulus Server der Big Band <b>Fette Hupe</b> aus Hannover</p><p style=text-align:center><b>https://fettehupe.de</b></p><p style=text-align:left></p> -e jamulus.fischvolk.de -o FetteHupe;Frankfurt;82
Here is one more with 25 clients connected.
@pljones : Thanks, I'll try that on my two core server first to listen for improvement :)
dingodoppelt
on 5 Aug 2020
@pljones : this is ps with all your patches applied
USER         PID    SPID CLS CPUID PRI COMMAND         COMMAND
jamulus    13406   13418 RR      1 120 CSocketThread   /usr/local/bin/Jamulus -s -n -F -u 25 -w <br><h1 style=text-align:center>FetteHupe</h1><p style=text-align:center>Willkommen auf dem Jamulus Server der Big Band <b>Fette Hupe</b> aus Hannover</p><p style=text-align:center><b>https://fettehupe.de</b></p><p style=text-align:left></p> -e jamulus.fischvolk.de -o FetteHupe;Frankfurt;82
jamulus    13406   13422 RR      1 120 Thread (pooled) /usr/local/bin/Jamulus -s -n -F -u 25 -w <br><h1 style=text-align:center>FetteHupe</h1><p style=text-align:center>Willkommen auf dem Jamulus Server der Big Band <b>Fette Hupe</b> aus Hannover</p><p style=text-align:center><b>https://fettehupe.de</b></p><p style=text-align:left></p> -e jamulus.fischvolk.de -o FetteHupe;Frankfurt;82
jamulus    13406   13430 RR      1 120 Thread (pooled) /usr/local/bin/Jamulus -s -n -F -u 25 -w <br><h1 style=text-align:center>FetteHupe</h1><p style=text-align:center>Willkommen auf dem Jamulus Server der Big Band <b>Fette Hupe</b> aus Hannover</p><p style=text-align:center><b>https://fettehupe.de</b></p><p style=text-align:left></p> -e jamulus.fischvolk.de -o FetteHupe;Frankfurt;82
jamulus    13406   13420 RR      2 120 Thread (pooled) /usr/local/bin/Jamulus -s -n -F -u 25 -w <br><h1 style=text-align:center>FetteHupe</h1><p style=text-align:center>Willkommen auf dem Jamulus Server der Big Band <b>Fette Hupe</b> aus Hannover</p><p style=text-align:center><b>https://fettehupe.de</b></p><p style=text-align:left></p> -e jamulus.fischvolk.de -o FetteHupe;Frankfurt;82
jamulus    13406   13426 RR      2 120 Thread (pooled) /usr/local/bin/Jamulus -s -n -F -u 25 -w <br><h1 style=text-align:center>FetteHupe</h1><p style=text-align:center>Willkommen auf dem Jamulus Server der Big Band <b>Fette Hupe</b> aus Hannover</p><p style=text-align:center><b>https://fettehupe.de</b></p><p style=text-align:left></p> -e jamulus.fischvolk.de -o FetteHupe;Frankfurt;82
jamulus    13406   13406 RR      3 120 Jamulus         /usr/local/bin/Jamulus -s -n -F -u 25 -w <br><h1 style=text-align:center>FetteHupe</h1><p style=text-align:center>Willkommen auf dem Jamulus Server der Big Band <b>Fette Hupe</b> aus Hannover</p><p style=text-align:center><b>https://fettehupe.de</b></p><p style=text-align:left></p> -e jamulus.fischvolk.de -o FetteHupe;Frankfurt;82
jamulus    13406   13419 TS      3  39 CHighPrecisionT /usr/local/bin/Jamulus -s -n -F -u 25 -w <br><h1 style=text-align:center>FetteHupe</h1><p style=text-align:center>Willkommen auf dem Jamulus Server der Big Band <b>Fette Hupe</b> aus Hannover</p><p style=text-align:center><b>https://fettehupe.de</b></p><p style=text-align:left></p> -e jamulus.fischvolk.de -o FetteHupe;Frankfurt;82

dingodoppelt
on 5 Aug 2020
Thanks @dingodoppelt , good info. What puzzles me is the ps output and the htop screenshot doesn't match (diff process ids involved, server 13406 vs htop 1346*). Are they from diff machines or sessions? Are the clients running on the same machine as the server?
BTW, in htop you can add columns for PROCESSOR and NLWP (number of threads) that may be useful for the analysis as well.
WolfganP
on 5 Aug 2020

@WolfganP : this is htop with the suggested columns added. I've relaunched the server and patched it a few times yesterday (this morning, actually ;) could be I mixed up some screenshots and command outputs.
here it is all together in one post
jamulus    15106   15369 RR      0 139 Thread (pooled) /usr/local/bin/Jamulus -s -n -F -u 25 -w <br><h1 style=text-align:center>FetteHupe</h1><p style=text-align:center>Willkommen auf dem Jamulus Server der Big Band <b>Fette Hupe</b> aus Hannover</p><p style=text-align:center><b>https://fettehupe.de</b></p><p style=text-align:left></p> -e jamulus.fischvolk.de -o FetteHupe;Frankfurt;82
jamulus    15106   15372 RR      0 139 Thread (pooled) /usr/local/bin/Jamulus -s -n -F -u 25 -w <br><h1 style=text-align:center>FetteHupe</h1><p style=text-align:center>Willkommen auf dem Jamulus Server der Big Band <b>Fette Hupe</b> aus Hannover</p><p style=text-align:center><b>https://fettehupe.de</b></p><p style=text-align:left></p> -e jamulus.fischvolk.de -o FetteHupe;Frankfurt;82
USER         PID    SPID CLS CPUID PRI COMMAND         COMMAND
jamulus    15106   15106 RR      2 139 Jamulus         /usr/local/bin/Jamulus -s -n -F -u 25 -w <br><h1 style=text-align:center>FetteHupe</h1><p style=text-align:center>Willkommen auf dem Jamulus Server der Big Band <b>Fette Hupe</b> aus Hannover</p><p style=text-align:center><b>https://fettehupe.de</b></p><p style=text-align:left></p> -e jamulus.fischvolk.de -o FetteHupe;Frankfurt;82
jamulus    15106   15368 RR      2 139 CHighPrecisionT /usr/local/bin/Jamulus -s -n -F -u 25 -w <br><h1 style=text-align:center>FetteHupe</h1><p style=text-align:center>Willkommen auf dem Jamulus Server der Big Band <b>Fette Hupe</b> aus Hannover</p><p style=text-align:center><b>https://fettehupe.de</b></p><p style=text-align:left></p> -e jamulus.fischvolk.de -o FetteHupe;Frankfurt;82
jamulus    15106   15371 RR      2 139 Thread (pooled) /usr/local/bin/Jamulus -s -n -F -u 25 -w <br><h1 style=text-align:center>FetteHupe</h1><p style=text-align:center>Willkommen auf dem Jamulus Server der Big Band <b>Fette Hupe</b> aus Hannover</p><p style=text-align:center><b>https://fettehupe.de</b></p><p style=text-align:left></p> -e jamulus.fischvolk.de -o FetteHupe;Frankfurt;82
jamulus    15106   15107 RR      3 139 CSocketThread   /usr/local/bin/Jamulus -s -n -F -u 25 -w <br><h1 style=text-align:center>FetteHupe</h1><p style=text-align:center>Willkommen auf dem Jamulus Server der Big Band <b>Fette Hupe</b> aus Hannover</p><p style=text-align:center><b>https://fettehupe.de</b></p><p style=text-align:left></p> -e jamulus.fischvolk.de -o FetteHupe;Frankfurt;82
jamulus    15106   15370 RR      3 139 Thread (pooled) /usr/local/bin/Jamulus -s -n -F -u 25 -w <br><h1 style=text-align:center>FetteHupe</h1><p style=text-align:center>Willkommen auf dem Jamulus Server der Big Band <b>Fette Hupe</b> aus Hannover</p><p style=text-align:center><b>https://fettehupe.de</b></p><p style=text-align:left></p> -e jamulus.fischvolk.de -o FetteHupe;Frankfurt;82
I enabled it now and it really keeps the CPU usage down and nicely balanced.
This is really good new. This is what I wanted to achieve with the threading implementation. The rest is fine-tuning (thread priorities, thread synchronization, etc.).
What I found still is that audio quality degrades at a certain amount of clients depending on their usage of small network buffers though the CPU cores aren't maxed out. But I don't know how much I can trust my tests since I'm running all clients on one machine and internet connection.
Running so many clients on the same machine, I would expect that you get audio issues. A better test would be to have a lot of individual clients connecting to a server which has a fast CPU and a high network bandwidth available. Maybe we should ask @sthenos to run one of his Waiting Rooms at the World Jam in qmake "CONFIG+=multithreading" mode.
corrados
on 6 Aug 2020
I just did a quick test with my laptop which has a dual core CPU with hyper threading (shows 4 cores in htop). I connected 20 clients from my Windows PC over ethernet. In normal mode, the CPU load of the Jamulus server was about 80-90%. In multithreading mode, the total Jamulus server load was about 180-190% but the load was equally distributed over the cores. So it seems we still have some threading overhead but not as much as we saw with the OMP implementation. But if the thread overhead is 100%, you would not gain much on a dual core CPU. But if you would have 4 or more cores, then I assume the multithreading Jamulus server will be able to handle more clients (which has to be proven by real-world tests I guess).
corrados
on 6 Aug 2020
100% overhead is too much, almost weird. I wonder if the concurrent threads are dividing up work or just processing the whole array of clients inputs in parallel unnecessarily...
WolfganP
on 6 Aug 2020
Each connected client needs the audio from all the connect clients to create its own mix.
So, for N audio inputs, you need to:
- read and decompress N streams
- mix N streams of input to N streams of output
- compress and send N streams
Each of those tasks can be parallelised but there's a hard serialisation point between them where _all_ the data needs exchanging with the next step - for each frame.
  R      M      s
 /-\    /-\    /-\
.---.->.---.->.---.
 \-/    \-/    \-/
You want to limit the number of threads to a count based on the available hardware cores (not virtual cores, so a four core with hyperthreading, means 4 cores) - as otherwise you drive the CPU into overload with task switching. You also need to reserve a thread / core for "other work". Looks like there are three "pools" for threads - read / mix / send, then distribute over that.
Now I have to go read the code, I guess 😁 .
pljones
on 6 Aug 2020
So, for N audio inputs, you need to:
* read and decompress N streams

* mix N streams of input to N streams of output

* compress and send N streams
Each of those tasks can be parallelised but there's a hard serialisation point between them where _all_ the data needs exchanging with the next step - for each frame.
Completely agree. Due to the nature of the data and flow, there are 3 clear serial steps that will benefit from being parallelized by each own onside the OnTimer clicks.
It also implies that data structures need to be optimized for that parallelization (ie global preallocated buffers/arrays, accessible by all parallel threads), one thread being reserved for UI-I/O-ancilliary concurrent functions.
WolfganP
on 6 Aug 2020
A brief look and it seems that the timer calls "read and decompress N streams", than then pushes "mix N streams of input to N streams of output" and "compress and send N streams" into a concurrent future, and then waits for that to complete. To me, that looks like a single serial operation. I think something more complex like QtConcurrent::map might be better (three of them, serialised), once the code structure fits.
I like the QtConcurrent use generally, though - it looks like it takes a lot of the pain out of implementing the details (the core balancing, etc).
pljones
on 6 Aug 2020
Audio encoding takes much more time than to decode. What is implemented right now is that the audio decoding of all input streams is done in one thread. Then the mixing and encoding of each individual output stream is done in separate threads. So it is actually not three steps as you depicted but only two of them. I actually don't see a need to do parallel processing of the first part since this would introduce additional thread overhead.
corrados
on 6 Aug 2020
I don't think it's done in multiple threads - QtConcurrent::run() appears to run the entire workload in a single thread, from the way I read the manual. QtConcurrent::map() could iterate over a list, processing each entry in a separate thread, balancing across available resources.
At the moment, each OnTimer() call reads all the data in then creates a single thread to mix, encode and send that data, waiting for the thread to complete. So there are two threads: the timer thread itself and the mix/encode/send thread.
If each "tick" is kicking off a separate OnTimer() thread, then that might work -- but it's still a serialised process path as it stands, as far as I can tell.
[thread collapse edit]
I will say I was wrong on the structure though - it is just the one sync point, not two, so
  R      M  S
 /-\    /----\
*---*->*------*
 \-/    \----/
[thread collapse edit]
OK, I see I'd missed the outer for() {} block that contains the ::run(). But I think it would still be better replaced with a ::map() - seems more "in style".
pljones
on 6 Aug 2020
Are there any real-world tests with the new multithreading implementation done? I am curious if we can serve more clients with the multithreading option enabled on a multiprocessor (>= 4 cores) compared to the Jamulus server running on the same CPU where the multithreading option is not enabled.
If anybody has already performed these type of tests, please share your experiences here.
corrados
on 10 Aug 2020
As kind of makeup lab, I'm setting up a headless raspberry to host multiple clients and leave the server in a separate machine, but still struggling with the audio part (no external audio interface other than the integrated bcm2835) to have an stable setup (following your https://github.com/corrados/jamulus/blob/master/distributions/raspijamulus.sh as guidance btw)
WolfganP
on 10 Aug 2020
Can the multithreading_testing branch get rebased to / merged from latest master at some point, too, please. (With the modules, as otherwise changing branch complains...)
pljones
on 11 Aug 2020
done
corrados
on 11 Aug 2020
OK, running with the latest version and 8 clients:
https://drive.google.com/file/d/1vYHyFfiD1vztk-QN0ECeVFzZ2ADI-9vy/view?usp=sharing
(severe apologies for the image... only had my phone handy as a terminal and this was about the only way to grab the data).
%CPU is 4.0 for CSocketThread and JamulusServer; ~1.8 for the pooled threads and 0.2 for CHighPrecisionTimer -- those are running at SCHED_FIFO priority 60; %CPU for the JamRecorder is 0.7 running SCHED_OTHER, nice 0. The spread across the cores is good: CSocketThread on 0, JamulusServer on 3, CHighPrecisionTimer on 1, pool using 0, 2, 4 and 5, with the JamRecorder on 2.
I didn't get the overall system load figures, unfortunately.
pljones
on 12 Aug 2020
I ran a test with assistance on 4 instances on the same AWS server tonight (32 GB RAM, 8 vCPUs) 2 of the instances were compiled with multithreading and the others normal. The normal servers had good sound up to 35 users approx (virtual users and two normal users) The multithreaded servers had a lower limit before the sound deteriorated of about 25. I was watching htop as we added users. The multithreaded servers seemed to spread the load and use all cpu's until about 15-20 users then appeared to reach some point when most of the processing jumped onto one cpu. I'm going to check I compiled correctly and re-test in a few days. Hope this is of some help!
storeilly
on 13 Aug 2020
@storeilly if you can test with similar loads (ie 25 ppl in one mono-thread server and then a similar load in a multi-thread server) could you please check (if you can capture screenshots of htop the better) the total system load? The total shouldn't be so different (ie 80% in one core vs ~20% in each of 4 cores)
The idea is to validate the system is distributing the load well, and not just replicating the same work on diff cores.
WolfganP
on 14 Aug 2020
I considered screenshots but the load was jumping across cpu's and a video
might be better. It didn't seem balanced though which leads me to think
I've made a mistake. Is it possible to move the control for multithreading
into a command line switch instead of a build config switch? Thanks guys
for the great work! 👍
On Thu 13 Aug 2020, 23:45 WolfganP, notifications@github.com wrote:
@storeilly https://github.com/storeilly if you can test with similar
loads (ie 25 ppl in one mono-thread server and then a similar load in a
multi-thread server) could you please check (if you can capture screenshots
of htop the better) the total system load? The total shouldn't be so
different (ie 80% in one core vs ~20% in each of 4 cores)The idea is to validate the system is distributing the load well, and not
just replicating the same work on diff cores.—
You are receiving this because you were mentioned.
Reply to this email directly, view it on GitHub
https://github.com/corrados/jamulus/issues/455#issuecomment-673746507,
or unsubscribe
https://github.com/notifications/unsubscribe-auth/ABIJSQOX2Q3TSTC434IKTDLSARUKBANCNFSM4OXQXIXQ
.
storeilly
on 14 Aug 2020
The multithreaded servers had a lower limit before the sound deteriorated of about 25.
Thank you for that test. That shows that the current multithreading implementation does not give you any improvement. I'll mark this feature as "experimental" in qmake for now.
I have some more ideas to improve the situation with multithreading. I'll do some more tests.
Is it possible to move the control for multithreading into a command line switch instead of a build config switch?
Yes, I think this should be possible.
corrados
on 14 Aug 2020
@storeilly I have just implemented another test. I now do not create a thread for each client but I work on blocks of clients. With the current test code I create a new thread if the number of clients exceeds 20. So if you have 50 clients, you will get two threads working on 20 clients and one thread working on 10 clients. I hope that this reduces the threding overhead.
I put the changes on our multithreading testing branch: https://github.com/corrados/jamulus/tree/multithreading_improvements
I also set a new label to the test code: https://github.com/corrados/jamulus/releases/tag/multithreading_testing2
Unfortunately, I cannot test the new code if it works correctly. So it may be that it does not work correctly or even crashes. At least I am pretty confident that it should work just fine. If you are interested to test this new code like you did before, it would be great to get some feedback.
corrados
on 14 Aug 2020
It's running (and I can, at least, connect) on my server. I'll see how it behaves over the weekend.
By the way, did you explicitly push the tag? I don't see it.
pljones
on 14 Aug 2020
Great. But which server is it? The _jamulus.drealm.info_?
Any yes, I pushed the tag. And it is listed on Github: https://github.com/corrados/jamulus/tags
corrados
on 14 Aug 2020
Ah, right - git pull needs --tags, too. I can probably config it on by default...
And yes - I'm not putting anything but release builds on the server lists.
pljones
on 14 Aug 2020
One thing I want to mention when it comes to the maximum supported number of connected clients: The worst case for the server is if it is running in "--fastupdate" mode but most of the clients use the 128 samples buffers. If the server also runs on 128 sample block size, on each timer call it has about 2.6 ms time to decode/encode the OPUS packets. But if the server runs on 64 samples block size and receives a 128 samples block, it stores the big block and only decodes/encodes every second timer call. But in that case the time to finish the decoding/encoding of the 128 block is in that case just about 1.3 ms (i.e. half the time). Therefore you may hit the sound deterioration limit earlier.
So it would make sense to do your tests with/without the --fastupdate flag.
corrados
on 15 Aug 2020
I just sysbenched my two servers as well as my PC and what was audible on the servers was visible in numbers in sysbench (the cheapest one not being able to run on small buffers).
Does anybody know of a benchmark that would produce numbers we can compare and predict the performance of the jamulus server? I don't know which benchmarks to try because I don't know which would simulate or benchmark the features we are interested in. The Phoronix test suite offers a multitude of benchmarks to choose from.
Has anybody made some test of that kind already?
dingodoppelt
on 16 Aug 2020
I've setup a group of test servers on the same AWS server for another go at this test later this week.. 6 in total. 4 with all combinations of Fast updates on/off and multithreading on/off and the last 2 at r3_5_10 with and without -F
Have you any suggestions of what to record except screenshots of htop?
storeilly
on 17 Aug 2020
@storeilly Please use the tag multithreading_testing2 instead of r3_5_10 since r3_5_10 does not include the latest changes to the multithreading code.
corrados
on 17 Aug 2020
I am using that tag on 4 of the instances.. only 2 of them have the 3.5.10
for comparison.
On Mon, Aug 17, 2020 at 4:40 PM Volker Fischer notifications@github.com
wrote:
@storeilly https://github.com/storeilly Please use the tag
multithreading_testing2 instead of r3_5_10 since r3_5_10 does not include
the latest changes to the multithreading code.—
You are receiving this because you were mentioned.
Reply to this email directly, view it on GitHub
https://github.com/corrados/jamulus/issues/455#issuecomment-674955480,
or unsubscribe
https://github.com/notifications/unsubscribe-auth/ABIJSQPEE5VKAVEUYLYL25DSBFFPXANCNFSM4OXQXIXQ
.
storeilly
on 17 Aug 2020
We ran out of time testing last night and only got through 3 instances.
Provisional numbers are...
Key S= above tag built without multithreading,
T= above tag with multithreading,
F= fast updates enabled on server, #= fast updates disabled on server,
f= fast updates enabled on client, != fast updates disabled on client.
S# f 23 clients
S# ! 36 clients
SF f 21 clients
SF ! 40 clients
T# f 60 clients
T# ! 72 clients
We hope to hit that last server and monitor htop before the weekend however
it looks great with 72 clients!!
On Mon 17 Aug 2020, 16:51 Stephen OReilly, soreilly64@gmail.com wrote:
I am using that tag on 4 of the instances.. only 2 of them have the 3.5.10
for comparison.On Mon, Aug 17, 2020 at 4:40 PM Volker Fischer notifications@github.com
wrote:@storeilly https://github.com/storeilly Please use the tag
multithreading_testing2 instead of r3_5_10 since r3_5_10 does not include
the latest changes to the multithreading code.—
You are receiving this because you were mentioned.
Reply to this email directly, view it on GitHub
https://github.com/corrados/jamulus/issues/455#issuecomment-674955480,
or unsubscribe
https://github.com/notifications/unsubscribe-auth/ABIJSQPEE5VKAVEUYLYL25DSBFFPXANCNFSM4OXQXIXQ
.
storeilly
on 20 Aug 2020
Wow! That looks very promising :-) Thank you for your tests.
BTW: There is a magic number in the multithreading code which might also be adjusted to support more clients: https://github.com/corrados/jamulus/blob/multithreading_improvements/src/server.cpp#L1024 Right now I have set it to 20 clients per CPU core. But maybe it makes sense to increase this number. Maybe to 25 or 30.
corrados
on 20 Aug 2020
I'm still fighting with alsa's asoundrc to create a virtual soundcard that allows me to launch multiple clients with a wav sound source for "close to real life" testing, and have a way to measure performance under high loads in a "lab" environment (multiple jamulus clients in one machine ingesting a wav audio file, a jamulus server in another machine to allow performance measurement of diff strategies/versions).
So, if anyone has any deep understanding with alsa's plugins (particularly file) any help will be appreciated. Thx!
WolfganP
on 20 Aug 2020
We did have an anomaly that has me puzzled though. A couple of times during the client add and removal I could not connect to the server and hear sound. The issue presented itself only on the third server and with both my connections. I'm using W10 with a focusrite 4i4 as primary and a Raspberry pi with a UM2. Both setups worked fine on my other instances before and after, when the server was empty it was also fine. My friend Tord could hear me fine.
storeilly
on 20 Aug 2020
I'm still fighting with alsa's asoundrc to create a virtual soundcard that allows me to launch multiple clients with a wav sound source for "close to real life" testing, and have a way to measure performance under high loads in a "lab" environment (multiple jamulus clients in one machine ingesting a wav audio file, a jamulus server in another machine to allow performance measurement of diff strategies/versions).
So, if anyone has any deep understanding with alsa's plugins (particularly file) any help will be appreciated. Thx!
I've used jaaa to inject a tone from a headless server with jack using a dummy driver
storeilly
on 20 Aug 2020
Folks:
I now have this tag running on a server in the U.S. East Coast (Newark NJ; Linode; 4 CPU 8 GB. It is newark-music.allyn.com.
Here are the steps that I did:
On Wednesday, August 20 at about 11 AM I did the following:
git clone https://github.com/corrados/jamulus.git
cd into jamulu
git fetch --all --tags
git tag (just to confirm that multithreading_testing2 is there
git checkout multithreading_testing
sudo apt-get install build-essential qt5-qmake qtdeclarative5-dev libjack-jackd2-dev qt5-default
qmake "CONFIG+=nosound multithreading" Jamulus.pro
make clean
make
The server is set for a maximum capacity of 100 users.
Server is Linode Ubuntu 16.04 LTS, Linode 8GB: 4 CPU, 160GB Storage, 8GB RAM
Server name is newark-music.allyn.com
You are welcome to try to stress it and break it.
Unfortunately, I don't know how to create the many virtual clients. I tested with two real clients on the same Windows PC.
I do have a question; it is appropriate for me to ask for people to try to break this on our Facebook groups?
Thank you
Mark Allyn
 maallyn
on 20 Aug 2020
maallyn
on 20 Aug 2020
I did have a comment about my setup on newark-music.allyn.com; this from Mats Wessling via Facebook:
"testing it from sweden now and there is a very weird effect: the relays lags! if i lower my level it takes it only lowers very slowly and gradually! almost same with mute: mute is also delayed but is abrupt (not gradually) my delay is 111ms ping 98 ms"
This got me curious. I got on from my home location in Bellingham, Washington, which has 141 total delay. What I did notice is that if I quickly push the fader all the way down, it seems to take about 1/2 to close to 1 second for the mute light to come on above my slider and about the same time for me to fade out in volume. The mute button and the mute myself button seem to act faster. The delay in the volume control is noticeably greater than the delay between me clapping into the microphone and hearing my clap coming back.
I am wondering if there is a difference between the way the faders are handled by the server vs the way that either the mute myself button or the mute button on each person's fader in the main panel are being handled.
maallyn
on 21 Aug 2020
We did have an anomaly that has me puzzled though....
I've done some tests on the multithreading build and it appears that only channel 0 (or the lowest connected channel) gets to hear audio. I can only connect a handful of clients tonight (5 max 1x Pi and 4 from the PC) This might affect results for client count if the server is not processing audio to all clients. I'm looking into how I can route the clients through jack to monitor the output but in the meantime @corrados could you have a look at the code please to see if there is a reason for this? If you pm me here or on FB, I can give you the ip of my server (It's on a private chain) if you want a look.
storeilly
on 22 Aug 2020
We did have an anomaly [...] only channel 0 (or the lowest connected channel) gets to hear audio
Was this something you did not see before but is new? Did you have this also when you did your test you reported here: https://github.com/corrados/jamulus/issues/455#issuecomment-677373376
I can only connect a handful of clients tonight (5 max 1x Pi and 4 from the PC)
It this some temporary effect then?
in the meantime @corrados could you have a look at the code please to see if there is a reason for this?
I am not at home right now. I can do it as soon as I am back (in some days).
corrados
on 22 Aug 2020
only channel 0 (or the lowest connected channel) gets to hear audio.
I've had that problem, too.
@maallyn: I checked your server just now and it has the same problem. Only the first channel receives audio.
dingodoppelt
on 22 Aug 2020
Thank you for letting me know. Tomorrow, I will restore the server back to the tip of the GIT tree and not use the multithread as the server is useless as it is now. It's 2 AM here in Bellingham and I am too tired to touch that server without disaster.
maallyn
on 22 Aug 2020
Thanks
Was this something you did not see before but is new? Did you have this also when you did your test you reported here: #455 (comment)
Yes, but as there were only two of us testing, using Jamulus and Zoom to communicate we knew there was a problem but I assumed it was on my end. Only further testing identified the actual issue. We ran out of time and I reported here
I can only connect a handful of clients tonight (5 max 1x Pi and 4 from the PC)
It this some temporary effect then?
No I don't have access to the multiple client setup to test further.
And no I've had about seven live clients connect last night to verify the issue, only the leftmost client could hear everyone. I've also tested maallyn's server and it is the same.
Further info ... Disconnecting the leftmost client restores incoming sound to the next in line to the right, and so on but reconnecting a client into a free slot GetFreeChan it gets a lower slot and the sound. There is a further and possibly linked issue with the pan and vu meters of the clients without sound, but I did not go too deep into diagnosing this as it is most likely related to this issue.
I am not at home right now. I can do it as soon as I am back (in some days).
That's fine! - A solution that takes time is usually more effective in my book. Thank you sir and enjoy your break!
storeilly
on 22 Aug 2020
Folks:
I don't know if this is relevant, but I got comments on Facebook that there is something weird with behavior of Linode droplets in that there is periodic distortion of the sound. I recompiled my instance at newark-music.allyn.com to be from the tip (took out the multithreading-2 tag and compile flag. This way, the server is running the production code. I will leave it this way until I hear an update from this ticket when there is an update to this branch. In the meantime, I am offering to temporarily upgrade that droplet to a dedicated CPU to see if there are audio glitches.
maallyn
on 22 Aug 2020
Hi Mark,
For stability you may have more success compiling from a release tag
(r3_5_10) if you are not sure of the reliability of the platform. I only
use released versions on my servers unless testing a particular feature
such as this.
On Sat 22 Aug 2020, 20:12 Mark Allyn, notifications@github.com wrote:
Folks:
I don't know if this is relevant, but I got comments on Facebook that
there is something weird with behavior of Linode droplets in that there is
periodic distortion of the sound. I recompiled my instance at
newark-music.allyn.com to be from the tip (took out the multithreading-2
tag and compile flag. This way, the server is running the production code.
I will leave it this way until I hear an update from this ticket when there
is an update to this branch. In the meantime, I am offering to temporarily
upgrade that droplet to a dedicated CPU to see if there are audio glitches.—
You are receiving this because you were mentioned.
Reply to this email directly, view it on GitHub
https://github.com/corrados/jamulus/issues/455#issuecomment-678680353,
or unsubscribe
https://github.com/notifications/unsubscribe-auth/ABIJSQLN5TUX7P5XJH4KGT3SCAKAZANCNFSM4OXQXIXQ
.
storeilly
on 22 Aug 2020
Storeilly: Thank you. I just re-cloned to the r3_5_10 tag and re-compiled without the multi-threading; and re-started the server.
Next week, I will temporarily upgrade to 2 CPU dedicated server and ask everyone to try to replicate the audio quality problem. If that problem persists, then we know it may be a Linode specific problem and my testing of any future patches on the multi-threading group work may not be valid unless I move to OVH or Vultr.
maallyn
on 22 Aug 2020
@storeilly Too bad, I had a bug in the multithreading Jamulus server which caused the server not to process the connected clients audio correctly. Therefore your test, unfortunately, with, e.g., "_T# ! 72 clients_" did not give any useful results with that previous buggy Jamulus code since the OPUS encoding of the clients was not done at all.
Anyway, I think I have fixed the bug and I have created a new label now: https://github.com/corrados/jamulus/releases/tag/multithreading_testing3
Sorry for the inconvenience.
corrados
on 24 Aug 2020
Thanks sir, no worries, I'll plan another test this week.. Great stuff
On Mon 24 Aug 2020, 10:39 Volker Fischer, notifications@github.com wrote:
@storeilly https://github.com/storeilly Too bad, I had a bug in the
multithreading Jamulus server which caused the server not to process the
connected clients audio correctly. Therefore your test, unfortunately,
with, e.g., "T# ! 72 clients" did not give any useful results with that
previous buggy Jamulus code since the OPUS encoding of the clients was not
done at all.Anyway, I think I have fixed the bug and I have created a new label now:
https://github.com/corrados/jamulus/releases/tag/multithreading_testing3Sorry for the inconvenience.
—
You are receiving this because you were mentioned.
Reply to this email directly, view it on GitHub
https://github.com/corrados/jamulus/issues/455#issuecomment-679022387,
or unsubscribe
https://github.com/notifications/unsubscribe-auth/ABIJSQI3ZSB2VZ74I224IHTSCIYNNANCNFSM4OXQXIXQ
.
storeilly
on 24 Aug 2020
Thank you all for the help.
I have just re-compiled with the multithreading-testing3 tag (HEAT at a5186b5) on my 4 CPU server at newark-music.allyn.com in New Jersey, in the Northeast United States. I will make announcements on Facebook to request people to test it and try to break it.
I do have a question; when I did the git chekout of the multithreading-testing3 tag (after re-doing git clone on a clean directory), I got this messages from git; I don't know if this is your message or from the github itself.
Note: checking out 'multithreading_testing3'.
You are in 'detached HEAD' state. You can look around, make experimental
changes and commit them, and you can discard any commits you make in this
state without impacting any branches by performing another checkout.
If you want to create a new branch to retain commits you create, you may
do so (now or later) by using -b with the checkout command again. Example:
git checkout -b
HEAD is now at a5186b5... bug fix
I did not do the git checkout -b command, but I did my comple using the multithreading build option which seemed to be okay. The message from git did not mention whether it is okay to do a compile and I have no intention of making any changes in the code so I am assuming it's okay for me not to do the git checkout -b command.
maallyn
on 24 Aug 2020
I do have a question; when I did the git chekout of the multithreading-testing3 tag (after re-doing git clone on a clean directory), I got this messages from git; I don't know if this is your message or from the github itself.
$ git fetch --all --tags # to update your local repo and make sure you have all the tags in
$ git checkout tags/mutithreading-testing3 # checkout the chosen tag named multithreading-testing3
 melcon
on 25 Aug 2020
melcon
on 25 Aug 2020
Folks:
I built and install multithreading-testing3 onto newark-music.allyn.com (Linode 4 CPU Dedicated in Newark, NJ Data center.
I then used two cloud machines (Linode in Toronto and Vultr in Seattle to hit newark-music.allyn.com with mass generated clients. With the help of some others, we were able to prove that audio quality was okay with up to about 55 connections; however, that was a time when newark-music was not dedicated.
After I made newark-music dedicated, I then tried to connect 80 connections (40 each from Seattle and Toronto). At about 69 or 70 connections, both the master server stopped listing connections (just had a big white gap after about listing 61 connections). And the client slider panel stopped showing sliders after about 60 or so connections. However, the total count (the number indicated adjacent to the server name on the master server listings showed the total count (81), along with the total number on the top of the client's panel.
I let it sit there for a while with no music playing in any of the clients. The htop showed about 40 to 60 percent CPU on each of the four CPU's on the machine (this is dedicated).
I waited about 15 minutes, but the listing on the master server seemed to be stuck with the big white gap after about 60 listings of connections and the client's panel showing about 60 faders.
At this point, I did not bother to try to feed music, but I tried to stop and start the server using the systemctl, but it would stop for about 5 minutes.
Right now, I rebooted all three machines; newark-music is now up and running; people can use it. I still plan to run a test with other people at 4 PM US Pacific Time on Thursday, August 26th.
Please note that I am willing to get up and be available at about 8 AM Pacific US time on Thursday if anyone from the UK team needs my help. I will also note this on the Jamulus World Jam Facebook Page.
maallyn
on 27 Aug 2020
With the help of some others, we were able to prove that audio quality was okay with up to about 55 connections
That's a new record :-). Thank you for that test. That shows that the new multithreading modifications improved the situation, i.e. we are going in the right direction with the multithreading implementation. My next step is to merge the multithreading branch to the master (some slight modifications are still missing before I do that).
At about 69 or 70 connections, both the master server stopped listing connections (just had a big white gap after about listing 61 connections). And the client slider panel stopped showing sliders after about 60 or so connections.
This seems to be a bug in the Jamulus software. I have created a separate Issue for that: https://github.com/corrados/jamulus/issues/547
corrados
on 27 Aug 2020
Based on my understating that Qt based Threads, FutureSynchronization and Timers are basically queues, wouldn't it be worthy to instrument somehow the code to measure the queues when critical/time sensitive functions are invoked (ie OnTimer) and be able to detect processing/cycle overruns?
Somehow I have the feeling we're kind of moving blindly in terms of where to focus improvements or understand where the real performance showstoppers are in load processing for large ensembles; but that may be just be my perception... (as I'm still fighting with ALSA to present virtual devices that allow me to inject real audio for a set of massive clients run in parallel for testing)
WolfganP
on 27 Aug 2020
Folks:
Thank you for the feedback. Just for the fun of it, I am now running aout 45 connections simultaneously onto newark-music.allyn.com as of about 10 AM US Pacific Time Thursday Aug 27. I intent to leave this up and running until about 4 PM today (Thursday), when I will stop them and let us try our in-person test. They are all playing the same music. So far, if I listen to any one of them, the music is clear. You are welcome to join in; if you want to try your own jamming over an above what I am duing, you can use the SOLO button. I tested it and it seems to work okay.
maallyn
on 27 Aug 2020
To Wolfgan: What I am doing for parallel music is to first of all do everything from a cloud server. I first set up vncserver on the server and vnc back to my desktop (my internet connection is slow so I don't want music shoved through it to many connections). Once I set up vncserver, I set up alsa with a loopback device (a Linode dedicated cloud instance has no audio/video devices; it is headless).
Here is my also startup
alias and-card-0 snd-aloop
options snd-aloop index=0 pcm_substreams=8
Here is my modules.conf file
snd-aloop
Here's the stuff that I install:
apt-get install alsa-tools
apt-get install alsa-utils
apt-get install qjackctl pulseaudio-module-jack
apt-get install alsa-base
apt-get install libasound2
apt-get install tightvncserver
apt-get install -y xfce4 xfce4-goodies
apt-get install -y xubuntu-core^
apt-get install build-essential qt5-qmake qtdeclarative5-dev qt5-default qttools5-dev-tools libjack-jackd2-dev
I then create a script to kick off the clients
/bin/bash
for i in {1..20}
do
./llcon-jamulus/Jamulus --connect 172.104.29.25 &
done
Then I got into qjackctl and connect pulseaudio jack sink (on the left hand side of the connect panel ) to each jamulus (on the right side of the panel).
I hope this helps.
Mark
maallyn
on 27 Aug 2020
Thx @maallyn I got to that point as well with snd_aloop, but the problem is that those channels are silent, and not actual audio goes back and forth to the server.
My goal is to actually define some kind of reproducible recipe to lab test with standard tools, be able to inject audio to those jamulus clients playing a wav file and get audio back that I may direct to null sink if not interesting in measuring quality, but have actual "real" sound load thru the entire system.
Played a lot with .asoundrc and jack routing but I wasn't able to make it work... yet :)
WolfganP
on 27 Aug 2020
What about a collaboration, I can publish my 7 servers with the different config builds (fast/no fast)/(multi threaded/single threaded)/plain 3.5.10) which are on the same machine and share the htop results over a zoom screenshare. With enough live clients and dummy clients between us we can gauge the breakdown thresholds. A live edit/recompile is not out of the question either.... thoughts?
storeilly
on 27 Aug 2020
I am willing to partake in the during our test meeting at 4 PM pacific us time. Or if you want, I can get on at 1 PM US Pacific, which, I belive, is 4 PM us east coast or 9 PM London, which if I am not mistaken where you are. I am tied up until 1 PM US Pacific time. If you don't want to do zoom, I do have a jitsi video bridge at conference.allyn.com/jamulus
maallyn
on 27 Aug 2020
Servers are now on the jazz central. IP address = 52.49.128.29 for scripts... ports are 22124..22140 in the following sequence.
"Jam st 24" = port 22124; single threaded
Jam stF 25" = port 22125; single threaded with fast updates
Jam mt 26" = port 22126; multi threading enabled
Jam mtF 27" = port 22127; multi threading enabled with fast updates
Jam 35a 28" = port 22128; standard release tag 3.5.10
Jam 35aF29" = port 22129; standard release tag 3.5.10 with fast updates
Jam mt 30" = port 22130; multi threading enabled, no fast updates, MAX_NUM_CHANNELS = 256
storeilly
on 27 Aug 2020
Folks: If you want to poke around with the machine that I am using to create the artificial connections, it is tester.allyn.com and you can ssh into it as user jamulus with password jamulus123
That is a guest account to let you poke around, but it does not have privileges to kill any of the current clients. You could, however, theoretically cause your own clients from that machine. It is a dedicated 4 CPU Linode at the Toronto data center that I am renting for the next few days.
maallyn
on 27 Aug 2020
FYI, I am now sharing the htop output of newark-music.allyn.com on my jitsi conference server at conference.allyn.com/jamulus
maallyn
on 27 Aug 2020
We had a group of up to 14 live people on newark-music.allyn.com tonight and all went very well. I heard no issues with the audio and I could not discern any latency jittering as people entered and left.
Earlier today, I loaded the system down with about 55 artificial connections (all done from the same source and playing the same music on a loop recording). I did some sound checks by doing a solo between myself and someone else and the sound was fine. I watched the htop and it seems to me that none of the processors ever went over 50 percent or so.
I am not going to try to do the stress testing any more as I feel that the multi-threading patch did work and I did not want to pay for more time on the dedicated server that I was using to send the connections (Linode in Ontario). That server is now gone.
However, for the time being, I plan to leave the conference.allyn.com/jamulus Jitsi meet locked onto a screen shot of the htop on the newark-music.allyn.com until I go to bed tonight and and I will re-start it tomorrow morning.
Thank you all for the help!
Mark Allyn
Bellingham, Washington
maallyn
on 28 Aug 2020
Good testing @maallyn
Earlier today, I loaded the system down with about 55 artificial connections (all done from the same source and playing the same music on a loop recording). I did some sound checks by doing a solo between myself and someone else and the sound was fine. I watched the htop and it seems to me that none of the processors ever went over 50 percent or so.
Do you mind to share how did you inject the sound into the clients? (which player, which sound device used as input / output, ...) It seems that's the part I'm still missing to nail (maybe easier to document the whole stuff on a gist?)
Thanks!
WolfganP
on 28 Aug 2020
I tried out I think the Newark server a couple of days ago and I think it reacted very slow to lowering volumes and soloing etc. The changes took up to maybe ten seconds to apply to the sound.
 38github
on 28 Aug 2020
38github
on 28 Aug 2020
To Wolfgan: Can we schedule a Jitsi meet so that I could walk through my procedure with you? Or better yet, if any of the others are here, are you all interested in a brief Jitsi or Zoom get together? I am willing.
maallyn
on 29 Aug 2020
@storeilly I just have changed the enabling of the new multithreading functionality. Now it is not required to re-compile Jamulus to activate this functionality since now the switch is no longer a qmake CONFIG flag but a simple command line flag. The code is available on Git master (https://github.com/corrados/jamulus/commit/7ca52e3adfcf555f82f3003252d25c21713c5102). You can now test the new multithreading functionality by using:
./Jamulus -s -n -T
I hope that this simplifies the multithreading testing.
corrados
on 29 Aug 2020
I tried out I think the Newark server a couple of days ago and I think it reacted very slow to lowering volumes and soloing etc. The changes took up to maybe ten seconds to apply to the sound.
Did you observe this issue when you were the only client on the server or when there was the multithreading test going on where about 50 clients were connected at that time?
corrados
on 29 Aug 2020
I tried it when there were at least 25 clients broadcasting (probably) pre-recorded material.
Aug 29, 2020, 13:51 by [email protected]:
>
>
>
>
>
I tried out I think the Newark server a couple of days ago and I think it reacted very slow to lowering volumes and soloing etc. The changes took up to maybe ten seconds to apply to the sound.
Did you observe this issue when you were the only client on the server or when there was the multithreading test going on where about 50 clients were connected at that time?
—
You are receiving this because you commented.
Reply to this email directly, > view it on GitHub https://github.com/corrados/jamulus/issues/455#issuecomment-683280047> , or > unsubscribe https://github.com/notifications/unsubscribe-auth/AELSLBL6LG6VD6YWW3JNIQ3SDDTT5ANCNFSM4OXQXIXQ> .
38github
on 29 Aug 2020
I tried it when there were at least 25 clients broadcasting (probably) pre-recorded material.
Ok, if you have a lot of clients connected, a lot of information must be exchanged with the protocol. If the server has a high ping time of, e.g., > 100 ms, that not only has influence on the audio but also on the speed of the protocol messages. All protocol messages must be acknowledged so that you get a delay of about 200 ms per protocol message. If you, e.g., need to send a gain update for 25 clients, that would take about 5 seconds. If you connect to a server close to you with, e.g., a ping of 15 ms, the same amount of protocol messages only require 750 ms so the response is much faster.
corrados
on 29 Aug 2020
Tested with
server started with -T on 32 logical processor machine
fastupdates disabled on server
buffer delay 128 for all clients
mono-in/stereo out, audio quality high for all clients ==> 657 kbps audio stream rate per client
100 clients connected (on the same LAN as the server ==> low ping times)
Results:
Audio quality: Good and stable
Client control responsivenes: Fast
cpu load: no logical processor peak load above 60%

 brynalf
on 29 Aug 2020
brynalf
on 29 Aug 2020
Edited global.h to increase number of clients above 100.
Server broke at 104 clients.
cpu load: no logical processor peak load above 65%
Same config as my last post.
brynalf
on 29 Aug 2020
Thank you for your tests. I assume you have 6 physical CPU cores. One core for OPUS decoding and the socket thread makes 5 cores left for mixing and OPUS encoding. Each of these cores get 20 clients to process so we are at about 100 clients.
What you could do is to increase this number a bit: https://github.com/corrados/jamulus/blob/master/src/server.cpp#L1023
Maybe try to set iMTBlockSize to 22 or even 25. Maybe you can increase the maximum number of supported clients at the server further with that modification...
Edit: _Oops, I thought your machine has 12 logical cores. But reading your initial message again showed that you have 32 logical cores... So my calculation is obviously incorrect. Anyway, maybe changing the number still makes a difference :-)_
corrados
on 29 Aug 2020
Yes, 16 physical cpu cores
I will try your suggestion tomorrow I hope.
brynalf
on 29 Aug 2020
I have now played around wiith the iMTBlockSize in the range 10 to 25.
The main conclusion is that it does not affect the upper limit for the number of users with ok audio quality.
This (subjective) quality limit is constant at approximately 100 users when all clients have settings for 657 kbps and at 45 users when all clients have settings for 900 kbps.
brynalf
on 30 Aug 2020
I'm sure the client count per thread can be optimised with code with the right metrics (outside my skill set) but Looking at the cpu graphs and our results the cpu never goes above 60% before the audio quality drops. Does this mean that something other than cpu count and power is capping client count......?
Is there a pinch point in the process and what is the maths behind it please?
storeilly
on 30 Aug 2020
I have now played around wiith the iMTBlockSize in the range 10 to 25. The main conclusion is that it does not affect the upper limit for the number of users with ok audio quality.
That was not expected. Can you please set it to 1 and check if you still get the same number of clients?
100 users when all clients have settings for 444 kbps and at 45 users when all clients have settings for 900 kbps.
444 kbps = mono-in/stereo-out at 128 samples block size?
900 kbps = mono-in/stereo-out at 64 samples block size?
Are these the settings you have used? If yes, you could also try the following:
Start the server with -T and also -F and check if you know can server more clients on 900 kbps rate. Since with -F the server also runs on 64 samples block size.
corrados
on 30 Aug 2020
The 900 kbps were mono-in/stereo-out at 64 samples block size on the clients and -F on the server. Above 45 users the audio quality is not ok. Above 50 users the server breaks (ping > 500 ms).
The 657 kbps (corrected from my earlier statement of 444 kbps) was mono-in/stereo-out at 128 samples block size and high Audio Quality=high on the clients without -F on the server ==> 100 clients ok audio quality
(Also, for the fun of it, tested the 657 kbps (mono-in/stereo-out at 128 samples block size on the clients) with -F on the server ==> 95 clients ok audio quality.)
I will test the iMTBlockSize=1. That will be many threads:)
brynalf
on 30 Aug 2020
Tested with iMTBlockSize=1
mono-in/stereo-out at 128 samples block size and AUdio Quality=high on the clients without -F on the server ==> 90 clients ok audio quality
All logical processors get their share as can be seen by the attached image. DIfferent load distribution compared to corresponding plot in one of my earlier posts in this thread. There seems to be some other bottle neck than processor load. Additional observation: The iMTBlockSize=1 for the server resulted in much more responsive behavior when killing a group of 50 clients on a load computer.

brynalf
on 30 Aug 2020
That's very interesting. So using a larger MTBlockSize gives us an improvement from about 90 clients to 100. That is less than I have hoped but at least we get some improvement. Have you tried to do the test without the -T? That would be the reference from where we started before the multithreading implementation. To my knowledge the highest number was about 35. Another interesting number would be to use mono for all clients with -T, without -F and 128 samples. Unfortunately, I do not have such a fast CPU as you have so I cannot run such tests myself.
corrados
on 31 Aug 2020
Nice tests, interesting results @brynalf . Thx!
What I'm puzzled is that the sound breaks after certain number of clients connected, but it seems not to be a case of CPU boundaries/load now (as the performance seems to improve a lot with latest multi-threading improvements by @corrados -big thanks again-).
What's the most likely candidate for impacting performance now? Network I/O, packet processing at app/stack level, memory/stack handling, Qt queues, ???
I still think that some performance instrumentation would help a lot to focus on areas of improvement and later be able to validate effectiveness between strategies (as suggested a few days ago https://github.com/corrados/jamulus/issues/455#issuecomment-682015046). Thoughts?
WolfganP
on 31 Aug 2020
It looks like the network traffic's running at 6.4 MB/s. For a 1Gb/s interface, that's pretty low -- i.e. max would be about 100MB/s. So for 6.4% of network capacity the CPU/core capacity is running around the 25-30% mark. Neither is "high"...
I have to agree with @WolfganP -- it's going to take more detailed metrics.
pljones
on 31 Aug 2020
Folks I tried the multi threading method outlined in Volker's suggestion.
I did a git clone of the latest code as of about 9 AM Pacific Time (US) on Monday, August 31.
git clone https://github.com/corrados/jamulus.git
I then did the compile:
cd jamulus/
qmake "CONFIG+=nosound" Jamulus.pro
make clean
make
I then used the following jamulus.service file (note the -T in the command)
[Unit]
Description=Jamulus-Server
After=network.target
[Service]
Type=simple
User=jamulus
NoNewPrivileges=true
ProtectSystem=true
ProtectHome=true
Nice=-20
IOSchedulingClass=realtime
IOSchedulingPriority=0
# This line below is what you want to edit according to your preferences
ExecStart=/usr/local/bin/jamulus/Jamulus --server --nogui -T \
--log /var/log/jamulus/jamulus.log \
--centralserver jamulusallgenres.fischvolk.de:22224 \
--serverinfo "newark-music.allyn.com;Newark, NJ Linode;225" \
--welcomemessage "<h2>This is a Jamulus Server on the Linode cloud in Newark, New Jersey. This is for testing of multithreading. It is not yet stable code, but all are welcome. If you have any questions, please email (Mark Allyn) at [email protected] if you have any comments or questions. <p>In addition I am trying another experiment. I have set up a Jitsi Conference server at conference.allyn.com/jamulus-seattle for those of you who want to have video. Jitsi is an open source alternative to Zoom. It sometimes has better latency than Zoom. When you join the Jitsi conference, make sure that you stay muted. You only want video as you will be getting audio through Jamulus.<p>Please give me feedback at [email protected] on how you feel about the Jitsi.<p>Thank you.<p>I luv you all!</h2>"\
--numchannels 100
# end of section you might want to alter
Restart=on-failure
RestartSec=30
StandardOutput=journal
StandardError=inherit
SyslogIdentifier=jamulus
[Install]
WantedBy=multi-user.target
Once this is running, I then go to another machine (in the cloud); using vncserver, I run a script to attempt to kick off
80 clients:
for i in {1..20}
do
  sleep 2
  ./llcon-jamulus/Jamulus -n --connect 172.104.29.25 &
done
Note that the -n signals no gui.
After about 50 interations, I cannot add any more clients because I get the following error:
- connect on startup to address: 172.104.29.25
 *** Jamulus, Version 3.5.9
 *** Internet Jam Session Software
 *** Released under the GNU General Public License (GPL)
- no GUI mode chosen
- connect on startup to address: 172.104.29.25
 *** Jamulus, Version 3.5.9
 *** Internet Jam Session Software
 *** Released under the GNU General Public License (GPL)
- no GUI mode chosen
- connect on startup to address: 172.104.29.25
Network Error: Cannot bind the socket (maybe the software is already running).
- no GUI mode chosen
- connect on startup to address: 172.104.29.25
Network Error: Cannot bind the socket (maybe the software is already running).
- no GUI mode chosen
- connect on startup to address: 172.104.29.25
Network Error: Cannot bind the socket (maybe the software is already running).
This seems to consistantly happen around 50 connections; with or without sound.
You can get the tcpdump.out (at the time of the failure) at:
allyn.com/tcpdump.out
Mark
maallyn
on 31 Aug 2020
After about 50 interations, I cannot add any more clients
This is because of the following line: https://github.com/corrados/jamulus/blob/master/src/socket.h#L49
#define NUM_SOCKET_PORTS_TO_TRY 50
If you increase this number to, e.g., 200, you should not get this error message anymore.
corrados
on 31 Aug 2020
Please note that qmake "CONFIG+=nosound" Jamulus.pro is not meant to be used for the client. The "nosound" interface is not synchronized and produces much too much network traffic. Today I have implemented some blocking which does not work as expected (the buffer LEDs are still red) but the traffic is much lower and it comes closer to a real audio interface. See my commit: https://github.com/corrados/jamulus/commit/d9d4dfdbf8e97567414bfd287329881715268218
corrados
on 31 Aug 2020
Volker:
Thank you. I will try the server with the NUM_SOCKET_PORTS_TO_TRY up to 200.
Also, the CONFIG+=nosound was compiled on the server, not the client. I have made no changes to the client compile.
I am running the clients from another ubuntu server on the cloud using vncserver, so they all have the GUI. I am also pumping audio into each client using audacity connected to pulse and then pulse-src connected to each client. I have to manually set those up using the qjackctl connection panel. If you know how to script the connections, that would be a big help.
maallyn
on 31 Aug 2020
You can take a look at this script: https://github.com/corrados/jamulus/wiki/Tips,-Tricks-&-More#jamulus-client-linux-start-script
There are examples for disconnection and connection, e.g.:
jack_disconnect system:capture_1 Jamulus:'input left'
jack_connect gx_head_fx:out_0 Jamulus:'input left'
Thank you very much!!! I will try this later today.
maallyn
on 31 Aug 2020
Here are the results from the first part of the requested baseline/reference test without multithreading on the same machine as my previous tests.
Tested with
multithreading disabled (=not using -T)
mono-in/stereo-out at 128 samples block size and audio quality high (i.e. 657 kbps) on the clients without -F on the server ==> 75 clients ok audio quality
The audio quality was only breaking down when the peak load on the logical processor reached 100%.
For 75 clients the peak load was below 98% also during connection of the clients and the audio quality very good and stable.
Attached you find the processor load during 60 seconds for the 75 client case.

brynalf
on 1 Sep 2020
I discovered that I have made an error that affect the bandwidth calculations. I previously stated that my clients use 444 kbps, when they were in fact using 657 kbps(mono-in/stereo-out with Audio Quality set to High). I have edited my posts above to the correct statement. Sorry for any potential confusion. The main coclusions still stand though:)
brynalf
on 1 Sep 2020
Here are the results from the second part of the requested baseline/reference test without multithreading on the same machine as my previous tests.
Tested with
multithreading disabled (=not using -T)
mono at 128 samples block size and audio quality normal (i.e. 366 kbps) on the clients without -F on the server ==> 101 clients ok audio quality
The audio quality was only breaking down when the peak load on the logical processor reached 100%.
For 101 clients the peak load was below 99% also during connection of the clients. The audio quality was a bit affected during the connection of the clients when reaching above approximately 80 clients, but ok when the clients had stabilized.
Attached you find the processor load during 60 seconds for this 101 client case.

brynalf
on 1 Sep 2020
Multithreading test as comparison on the same machine as my previous tests.
multithreading enabled ( -T ) iMTBlockSize=20 (i.e. default value)
mono at 128 samples block size and audio quality normal (i.e. 366 kbps) on the clients without -F on the server ==> 108 clients ok audio quality
No logical processor reached above 40%.
The audio quality was a bit affected during the connection of the clients when reaching above approximately 80 clients, and very affected while connecting clients above approximately 100, but ok when the clients had stabilized.
At 108 the ping time seen in the client settings window swings between 0 and 6 ms compared to the normal 0 to 1 ms for this setup.
Attached you find the processor load during 60 seconds for this 108 client case.
Has been stable with ok Audio quality for 40 minutes.

brynalf
on 1 Sep 2020
Thank you brynalf for all your testing. Let's put your results in a table:
32 logical processor machine Jamulus server performance
| -T | -F | B | mode | # |
|----|----|-----|--------|-----|
| X | X | 64 | stereo | 45 |
| X | X | 128 | stereo | 95 |
| X | | 128 | stereo | 100 |
| X | | 128 | mono | 108 |
| | | 128 | stereo | 75 |
| | | 128 | mono | 101 |
Conclusions
- Even in single-threading mode if all clients use mono we can reach the 100 clients.
- The multi-threading mode with 64 samples stereo has a very low number.
- Would be good to know why the number is so low, this is not expected.
- Direct comparison between single-threaded and multi-threaded of most common case with 128 samples stereo gives about 30 % improvement.
- Why is the multi-threaded with 128 samples and mono so bad? This shows that we hit another limit which is not the CPU...
corrados
on 1 Sep 2020
Folks:
I just discovered a new issue, but I don't think it's jamulus related, but it affects my ability to do large number of client testing. I have been doing my testing by launching large numbers of connections from a 2nd server on the cloud (a Volkr instance in Seattle) hitting the newark-music.allyn.com (a Linode instance in Newark).
Apparently the Jack sound service for Linux starts to break down when I have more than about 60 connections to is. I have it configured so that audacity is sending music to the pulse-jack sink and then I connect the pulse-jack source to each jamulus client. I have to manually do the routing for each of the clients.
What I noticed is that even before I do the routing, Jack breaks down at about 60 connections.
I did try the trick of creating thirty connections, stopping, then manually reconnecting those to the pulse-jack-source, confirmed music was getting through (watching the vu lights). After that, then I try to create the next batch of 30 connection. It varies, but it seems that around a total of 60 connections, Jamulus complains that the Jack is not running. Jamulus then tries to re-start Jack and fails.
I manually tried to re-start jack, but then it seems that once I do that, I lose all existing Jamulus clients and everything gets into a funny state and I have to reboot the machine.
I know that this is most likely NOT a Jamulus issue, but it does impact my ability to help you folks.
Is there anyone out there who can help me with the Jamulus / Jack relationship in handling large numbers of connections?
I am asking this here because I don't know if it would be appropriate to ask this type of question on the World Jam Discord Channel as that is World Jam production oriented.
maallyn
on 1 Sep 2020
-T | -F | B | mode | # | bitrate/client kbps | bitrate tot Mbps
-- | -- | -- | -- | -- | -- | --
X | X | 64 | stereo | 45 | 900 | 41
X | X | 128 | stereo | 95 | 657 | 62
X | | 128 | stereo | 100 | 657 | 66
X | | 128 | mono | 108 | 366 | 40
| | 128 | stereo | 75 | 657 | 49
| | 128 | mono | 101 | 366 | 37
It is also clear that it is not the total audio bitrate that is the limiting factor.
brynalf
on 1 Sep 2020
- The multi-threading mode with 64 samples stereo has a very low number.
Would be good to know why the number is so low, this is not expected.
Indeed. More investigation around the small buffers / fast update code is needed. People have said to me it does seem to cause problems that switching it off fix. Although sometimes switching it on fixes problems. Potentially an old wives tale, of course.
But seeing something more concrete like this number does indicate it could be a real problem somewhere.
pljones
on 1 Sep 2020
For the sake of structured problem solving I also tested buffer=64 and -F without multithreading.
For that case I hit the processor limit before hitting our mystery limit (see last row in the table below)
T | -F | B | mode | audio quality setting | # | bitrate/client kbps | bitrate tot Mbps | processor limited
-- | -- | -- | -- | -- | -- | -- | -- | --
X | X | 64 | stereo | High | 45 | 900 | 41 | N
X | X | 128 | stereo | High | 95 | 657 | 62 | N
X | | 128 | stereo | High | 100 | 657 | 66 | N
X | | 128 | mono | Normal | 108 | 366 | 40 | N
| | 128 | stereo | High | 75 | 657 | 49 | Y
| | 128 | mono | Normal | 101 | 366 | 37 | Y
| X | 64 | stereo | High | 44 | 900 | 40 | Y
brynalf
on 2 Sep 2020
Additional observation.
When the server breaks (ping>500 ms), for the non-processor limited cases, the processor load goes down.
Audio is still processed but is returned distorted.
brynalf
on 2 Sep 2020
@brynalf One question to your tests: Have you changed the following define: https://github.com/corrados/jamulus/blob/master/src/global.h#L180 (#define MAX_NUM_CHANNELS) to a larger number like, e.g., 200? Otherwise the client/server do not support more than 100 connections.
corrados
on 2 Sep 2020
Yes. to 256 for all the tests
brynalf
on 2 Sep 2020
Also an interesting observation, with max clients at 256 and connected
clients >100 the server shows server full on the connection setup window
but still accepts new connections. I thought it might be that we needed to
edit another place also.
On Wed 2 Sep 2020, 20:06 brynalf, notifications@github.com wrote:
Yes. to 256
—
You are receiving this because you were mentioned.
Reply to this email directly, view it on GitHub
https://github.com/corrados/jamulus/issues/455#issuecomment-685938720,
or unsubscribe
https://github.com/notifications/unsubscribe-auth/ABIJSQL4LVMIJW5KYTQ7QCDSD2JUFANCNFSM4OXQXIXQ
.
storeilly
on 2 Sep 2020
I have just commited https://github.com/corrados/jamulus/commit/c9c5e41456609bb7573d0d6577bf21c7ea4b72d7 which possibly solves https://github.com/corrados/jamulus/issues/547.
@storeilly Could you please update your server "_Jam mt 26" = port 22126; multi threading enabled_" with the newest Git code so I can test if the fix really solves the problem?
One more question: What is the maximum up/down stream rate of your Jam mt 26 server? When I did a test with close to 100 clients, I noticed that I had a lot of protocol retransmissions which could indicate that we hit a network traffic limit.
corrados
on 4 Sep 2020
with max clients at 256 and connected clients >100 the server shows server full on the connection setup window but still accepts new connections.
That is an interesting effect. I have checked in the code but I could not find an obvious error causing this behavior. In the newest Jamulus client the maximum number of allowed clients is shown (e.g. 2/10). Was the number after the "/" correctly shown? So, as a result, just the "full" text was shown too early?
Edit: _I just saw in the code that if "(full)" is shown, the maximum number of supported clients is not shown, i.e. the number after the "/"._
corrados
on 4 Sep 2020
@storeilly Could you please update your server "_Jam mt 26" = port 22126; multi threading enabled_" with the newest Git code so I can test if the fix really solves the problem?
Thanks @corrados I have added a new instance Jam 69c5e41 31 built with this tag, edited the version and the max users as before to 255, run with -T on port 22131. I have also implemented tcpdump as per notes from @softins (Thank you very much Tony) so just let me know the dates and times you want the capture files and I'll post them here. (or send them wherever)
I've left Jam mt 26 running on port 22126 if you want to compare experience
One more question: What is the maximum up/down stream rate of your Jam mt 26 server? When I did a test with close to 100 clients, I noticed that I had a lot of protocol retransmissions which could indicate that we hit a network traffic limit.
The limit on the machine is 7TB according to AWS Lightsail. The only instances on the machine are the ones you see from port 22124-22131 so keep an eye in case someone is load testing the other instances at the same time, not that that is likely to ever hit 7TB!!!
Thanks again sir!
S
storeilly
on 4 Sep 2020
Thank you!
I have added a new instance Jam 69c5e41 31 built with this tag
I cannot find tag 69c5e41. The commit ID of my change was c9c5e41. Since I changed something today, the last commit on master is ef0c5d7. Is this 69c5e41 a commit on your fork?
The limit on the machine is 7TB according to AWS Lightsail
I assume the 7TB is the total amount of traffic you can have per month. What I am interested in is something different. It is the maximum stream rate you can have per up-/downstream. E.g., on my virtual server I have 100 Mbps for upstream. So I need a number with the unit "Mbps". Do you know that number for your server?
corrados
on 4 Sep 2020
Doh!! no that is a typo, see git status below, sorry, I typed the server name manually!!
HEAD detached at c9c5e414
Changes not staged for commit:
(use "git add
(use "git checkout --
    modified:   Jamulus.pro
    modified:   src/global.h
I assume the 7TB is the total amount of traffic you can have per month. What I am interested in is something different. It is the maximum stream rate you can have per up-/downstream. E.g., on my virtual server I have 100 Mbps for upstream. So I need a number with the unit "Mbps". Do you know that number for your server?
You are correct, I can't find that in the docs so have run a speedtest from the server... dissapointing results below!!!!!
ubuntu@ip-xxx-xxx-xxx-xxx:~$ speedtest
Retrieving speedtest.net configuration...
Testing from Amazon.com (52.49.128.29)...
Retrieving speedtest.net server list...
Selecting best server based on ping...
Hosted by Airspeed Telecom (Dublin) [1.78 km]: 1.74 ms
Testing download speed................................................................................
Download: 971.57 Mbit/s
Testing upload speed......................................................................................................
Upload: 4.17 Mbit/s
storeilly
on 4 Sep 2020
Here is the speedtest from the server that I have been doing my testing on, which is newark-music.allyn.com at the Linode data center in Newark, NJ in the U.S.
root@bicycle-bellingham:~# speedtest
Retrieving speedtest.net configuration...
Retrieving speedtest.net server list...
Testing from Linode (172.104.29.25)...
Selecting best server based on latency...
Hosted by Kansas Research and Education Network (Wichita, KS) [43.14 km]: 57.39 ms
Testing download speed........................................
Download: 1161.19 Mbit/s
Testing upload speed..................................................
Upload: 86.58 Mbit/s
I hope this helps.
maallyn
on 5 Sep 2020
Ok update.. better numbers with latest version of speedtest.....
Retrieving speedtest.net configuration...
Testing from Amazon.com (x.x.x.x)...
Retrieving speedtest.net server list...
Selecting best server based on ping...
Hosted by Airspeed Telecom (Dublin) [1.78 km]: 1.973 ms
Testing download speed................................................................................
Download: 930.18 Mbit/s
Testing upload speed................................................................................................
Upload: 942.43 Mbit/s
storeilly
on 5 Sep 2020
Upload: 942.43 Mbit/s
That number looks very good :-). Ok, so now we know that we are not bandwidth limited but CPU limited if I see issues with the protocol when a lot of clients are connected. I assume that the socket thread is blocked by the audio threads so that it cannot handle any protocol messages in time anymore.
Yesterday I did a test where I used 100 clients with mono (instead of stereo) and that worked fine. I noticed that the jitter was increased which forced my jitter buffers to go higher than usual (if only one client is connected, it goes to 2/2 and with 100 mono clients connected it goes to 5/5) but still the audio was perfect. So it would be interesting if we could reproduce this with a real-live session. Would it be possible to get a choir of about 100 musicians trying out your multi-threaded Jamulus server if a choir rehearsal is possible when all clients use mono?
corrados
on 5 Sep 2020
Doh!! no that is a typo
I tried your new server today and I could see the same issue https://github.com/corrados/jamulus/issues/547 on that new version as well. So unfortunately my change did not solve the issue. So I'll investigate further now.
corrados
on 5 Sep 2020
Doh!! no that is a typo
I tried your new server today and I could see the same issue #547 on that new version as well. So unfortunately my change did not solve the issue. So I'll investigate further now.
I've captured the jamulus log and the tcpdump files covering the connection time here if it helps.
https://www.dropbox.com/sh/9dwy7h97lvf1l9q/AAAZXpn7YaOTeIlP15zZo6ixa?dl=0
@softins
storeilly
on 5 Sep 2020
I tried your new server today and I could see the same issue #547 on that new version as well. So unfortunately my change did not solve the issue. So I'll investigate further now.
I've captured the jamulus log and the tcpdump files covering the connection time here if it helps.
I've fetched those files and just having a look...
 softins
on 5 Sep 2020
softins
on 5 Sep 2020
@storeilly Could you please do another test if possible? I have to find out if the protocol timer causes the issue. Could you please uncomment the following line: TimerSendMess.stop(); -> https://github.com/corrados/jamulus/blob/master/src/protocol.cpp#L481
So that the resulting code looks like this:
    Mutex.lock();
    {
        // we have to check that list is not empty, since in another thread the
        // last element of the list might have been erased
        if ( !SendMessQueue.empty() )
        {
            vecMessage.Init ( SendMessQueue.front().vecMessage.Size() );
            vecMessage = SendMessQueue.front().vecMessage;

            // start time-out timer if not active
            if ( !TimerSendMess.isActive() )
            {
                TimerSendMess.start ( SEND_MESS_TIMEOUT_MS );
            }

            bSendMess = true;
        }
        else
        {
            // no message to send, stop timer
// TimerSendMess.stop();
        }
    }
    Mutex.unlock();
@storeilly Could you please do another test if possible? I have to find out if the protocol timer causes the issue. Could you please uncomment the following line:
TimerSendMess.stop();-> https://github.com/corrados/jamulus/blob/master/src/protocol.cpp#L481So that the resulting code looks like this:
    Mutex.lock();
    {
        // we have to check that list is not empty, since in another thread the
        // last element of the list might have been erased
        if ( !SendMessQueue.empty() )
        {
            vecMessage.Init ( SendMessQueue.front().vecMessage.Size() );
            vecMessage = SendMessQueue.front().vecMessage;

            // start time-out timer if not active
            if ( !TimerSendMess.isActive() )
            {
                TimerSendMess.start ( SEND_MESS_TIMEOUT_MS );
            }

            bSendMess = true;
        }
        else
        {
            // no message to send, stop timer
// TimerSendMess.stop();
        }
    }
    Mutex.unlock();
I think you mean "comment line 481" not "uncomment".. Edited code below... and server running now on port 22132
void CProtocol::SendMessage()
{
CVector
bool bSendMess = false;
Mutex.lock();
{
    // we have to check that list is not empty, since in another thread the
    // last element of the list might have been erased
    if ( !SendMessQueue.empty() )
    {
        vecMessage.Init ( SendMessQueue.front().vecMessage.Size() );
        vecMessage = SendMessQueue.front().vecMessage;

        // start time-out timer if not active
        if ( !TimerSendMess.isActive() )
        {
            TimerSendMess.start ( SEND_MESS_TIMEOUT_MS );
        }

        bSendMess = true;
    }
    else
    {
        // no message to send, stop timer
// TimerSendMess.stop();
}
}
Mutex.unlock();
if ( bSendMess )
{
    // send message
    emit MessReadyForSending ( vecMessage );
}
}
storeilly
on 5 Sep 2020
Wow, that was quick, thanks :-)
I think you mean "comment line 481" not "uncomment".
Yes, it should read "comment".
I just did a test and the issue is still there even with your modified code. So now I know that the timer is not the issue. So I have to look at another place for finding the real cause of the issue.
I've fetched those files and just having a look...
Let's see if you can find something which could explain the cause of the issue.
corrados
on 5 Sep 2020
Not quite sure what I'm looking for. What is the symptom? Currently looking at the test from 6:39 BST this morning (07:39 in Germany).
softins
on 5 Sep 2020
Symptom: I first connect to the server with my single Windows client. Then I start 58 dummy clients on my Linux server so the total number of clients at the server is 59. On my Windows client, I can see that for two mixer faders there are no name tags received. When I disconnect the 58 dummy clients, the mixer panel on my Windows client still shows all faders. If I type in a chat text in the Windows client, I do not get a response. But when I connect with another Windows client, that second Windows client receives the chat text. So for the first Windows client it seems that it cannot receive any more protocol messages after the 58 dummy clients had connected to the server.
Note that when the first Windows client sends protocol messages to the server, I get an acknowledge packet back. So that protocol path client->server seems to work but the path server->client does no longer work.
corrados
on 5 Sep 2020
Great, thanks. I can see the single windows client. I'll concentrate on the traffic between it and the server, and let you know if I find any clues.
softins
on 5 Sep 2020
Is it possible in your dummy clients to provide a different name for each client connection? At the moment, they are all "dummytest". If a serial number could be added, it might be useful for identifying whether a missing name is due to a server issue or to a missing CHANNEL_INFOS from the client.
I observed that as soon as a client starts sending audio (as Jamulus does not have a CONNECT message), the client is added to the list and a new CONN_CLIENTS_LIST is sent to each client, with an empty name for the new client. Once a CHANNEL_INFOS is received from the client, the name is filled in and the CONN_CLIENTS_LIST is resent. So when it first got to 59 clients, the CONN_CLIENTS_LIST send to the Windows client was only 1098 bytes long, and many of the clients had no name. It kept getting sent again, with longer and longer packets as the names got filled in. Eventually it settled at a packet length of 1512 and didn't increase after that. Examining one of those revealed that client 43 still had no name. Without distinct client names I can't tell whether that was due to a dropped client message or a server processing error.
softins
on 5 Sep 2020
I'm leaving the tcpdump running with smaller file size of 32MB for easier uploading. If you want to do another "hit" just let me know what time you did it and I'll upload the files to the same dropbox folder. I've put a few more there tonight along with the logfile from server 9
storeilly
on 5 Sep 2020
At 05:39:43 UTC, while the server still said it had 59 clients connected, the server received sixteen CLM_DISCONNECTION messages from the Windows client over a period of 100ms. This reduced the client count to 58. The server didn't start to receive CLM_DISCONNECTION messages from the Linux clients until 9 seconds later, at 05:39:52 UTC. A lot of disconnect messages were received over the next 2 seconds. No CONN_CLIENTS_LIST messages were sent by the server after that (as you would expect).
I wonder whether it would help reduce the amount of traffic if the following technique were used:
- When the channel list has changed, if a client has not received a list in the last 1 second (timer not running), send the list immediately, and start a client-specific timer for 1 second.
- If the timer is running when an update to the channel list has happened, set a flag for that client to say the client list has changed.
- When the timer expires, if the flag is set, send a clients list now and restart the timer. Don't start the timer if the flag was not set. This way, the client would only receive one update every 1 second, if many clients were joining or leaving at once. This could be tweaked to 500ms or something if preferred.
The above has been edited to improve on my original suggestion
softins
on 6 Sep 2020
I'm leaving the tcpdump running with smaller file size of 32MB for easier uploading. If you want to do another "hit" just let me know what time you did it and I'll upload the files to the same dropbox folder. I've put a few more there tonight along with the logfile from server 9
@storeilly if you are running multiple servers on that machine with different port numbers, maybe you could also modify the tcpdump to capture only the port of the test server? You appear to have several other Jamulus servers running on different ports.
softins
on 6 Sep 2020
Is it possible in your dummy clients to provide a different name for each client connection? At the moment, they are all "dummytest". If a serial number could be added, it might be useful for identifying whether a missing name is due to a server issue or to a missing
CHANNEL_INFOSfrom the client.
As per https://github.com/corrados/jamulus/issues/530#issuecomment-677279884 , the client name cannot be customized from the command line (--clientname only has effect on the client window title and jack connection name). I proposed to override the profile name if --clientname was specified at the command line at https://github.com/corrados/jamulus/pull/162#issuecomment-682006515 exactly with this automated testing use case in mind.
Anyways, the client/profile name being submitted to the server is read from the ini file, and is base64 encoded (which means temp ini files can be automatically generated by an script, but it will require additional shell trickery :-)
<name_base64>UFHHLIBwYw=</name_base64>
WolfganP
on 6 Sep 2020
@storeilly if you are running multiple servers on that machine with different port numbers, maybe you could also modify the tcpdump to capture only the port of the test server? You appear to have several other Jamulus servers running on different ports.
@softins, they are all different variations on the multi-threaded builds, they are all test servers really. @corrados can I shut any of these down if they are no longer useful in the performance and optimization quest? I'm happy to leave them if needed as reference.
They are
https://github.com/corrados/jamulus/issues/455#issuecomment-682129226
and the two additional servers
Jam c9c5e41 31 port 22131 build c9c5e41
Jam c9c5e41_e 32 port 22132 build c9c5e41 with edits as per https://github.com/corrados/jamulus/issues/455#issuecomment-687629236
I can move them to my private chain but will need to give you in a PM my central IP!
storeilly
on 6 Sep 2020
I shut any of these down if they are no longer useful in the performance and optimization quest?
I was using _"Jam st 24" = port 22124; single threaded_ and _Jam mt 26" = port 22126; multi threading enabled_ for my tests. For debugging the bug, this is sufficient for now.
I wonder whether it would help reduce the amount of traffic if the following technique were used
Sure you can reduce the protocol traffic by some smart implementations. I already started doing this with, e.g., this commit: https://github.com/corrados/jamulus/commit/bdd2c09b6e1dfa48210c8ad165d60272c0ac2ae9
But we should not mix things here. We should focus on the protocol issue for now since Jamulus get's in a state where the protocol mechanism get's stuck and does not recover until a re-connect. This is a bug and should be solved. After that bug is solved, we can look into optimizing the protocol if necessary.
If a serial number could be added, it might be useful for identifying whether a missing name is due to a server issue or to a missing CHANNEL_INFOS from the client.
I am pretty sure it is just the protocol communication between the server and the Windows client. If I connect with another client to the same server just after all 58 dummy had connected, the audio mixer board is completely shown will all names.
Eventually it settled at a packet length of 1512 and didn't increase after that. Examining one of those revealed that client 43 still had no name.
I assume you are talking about the communication between the server and this single Windows client, right? It seems at some point the server does not send any more protocol messages to that Windows client. It would be good to see what happens at that point. This packet with size 1512, is this repeated over and over again? So that it seems the client cannot receive this packet?
I think what happens for the server-to-Windows-client communication at that moment is the key to understand what goes wrong.
corrados
on 6 Sep 2020
@storeilly I have implemented some extensive logging for the protcol now. I have created a new branch for it: https://github.com/corrados/jamulus/tree/logging_for_bugfix and also a new tag for it: extlogging (https://github.com/corrados/jamulus/releases/tag/extlogging). The additional log goes in the normal Jamulus log file and looks like this:
0: Enqueue iID: 32, iCnt: 0, wasempty: 1
0: SendMessage iID: 32, iCnt: 0
0: Enqueue iID: 21, iCnt: 1, wasempty: 0
0: Enqueue iID: 11, iCnt: 2, wasempty: 0
0: Enqueue iID: 23, iCnt: 3, wasempty: 0
0: Enqueue iID: 29, iCnt: 4, wasempty: 0
0: Enqueue iID: 33, iCnt: 5, wasempty: 0
2020-09-06 14:23:20, 127.0.0.1, connected (1)
0: Ackn iID: 32, iRecCounter: 0, bSendNextMess: 1
0: SendMessage iID: 21, iCnt: 1
0: Enqueue iID: 10, iCnt: 6, wasempty: 0
0: Ackn iID: 21, iRecCounter: 1, bSendNextMess: 1
0: SendMessage iID: 11, iCnt: 2
0: Ackn iID: 11, iRecCounter: 2, bSendNextMess: 1
0: SendMessage iID: 23, iCnt: 3
0: Enqueue iID: 24, iCnt: 7, wasempty: 0
0: Ackn iID: 23, iRecCounter: 3, bSendNextMess: 1
0: SendMessage iID: 29, iCnt: 4
0: Ackn iID: 29, iRecCounter: 4, bSendNextMess: 1
0: SendMessage iID: 33, iCnt: 5
0: Enqueue iID: 24, iCnt: 8, wasempty: 0
0: Ackn iID: 33, iRecCounter: 5, bSendNextMess: 1
0: SendMessage iID: 10, iCnt: 6
0: Ackn iID: 10, iRecCounter: 6, bSendNextMess: 1
0: SendMessage iID: 24, iCnt: 7
0: Ackn iID: 24, iRecCounter: 7, bSendNextMess: 1
0: SendMessage iID: 24, iCnt: 8
0: Ackn iID: 24, iRecCounter: 8, bSendNextMess: 1
0: Enqueue iID: 10, iCnt: 9, wasempty: 1
0: SendMessage iID: 10, iCnt: 9
0: Ackn iID: 10, iRecCounter: 9, bSendNextMess: 1
2020-09-06 14:23:21,, server idling -------------------------------------
It would be gread if you could compile this version and setup a new server like you did with, e.g., the "Jam 69c5e41 31". Thanks in advance.
corrados
on 6 Sep 2020
1b16dc38 is on port 22133
tcpdump only collecting now on 22133 for now.
Older logs and files now uploaded to dropbox
storeilly
on 6 Sep 2020
Great :-). I just did a test run on that new server. Could you please upload the log file which was generated by that Jamulus server?
corrados
on 6 Sep 2020
jamulus10.log Done
storeilly
on 6 Sep 2020
tcpdump only collecting now on 22133 for now.
Cool :)
jamulus10.log Done
I'll fetch this and have a look at it.
softins
on 6 Sep 2020
jamulus-proto-20200906-133725.pkt now up there too
storeilly
on 6 Sep 2020
That is very interesting. If you look at the end of the log file you can see:
0: SendMessage iID: 24, iCnt: 70
0: SendMessage iID: 24, iCnt: 70
0: SendMessage iID: 24, iCnt: 70
0: SendMessage iID: 24, iCnt: 70
0: SendMessage iID: 24, iCnt: 70
0: SendMessage iID: 24, iCnt: 70
0: SendMessage iID: 24, iCnt: 70
0: SendMessage iID: 24, iCnt: 70
0: SendMessage iID: 24, iCnt: 70
0: SendMessage iID: 24, iCnt: 70
0: SendMessage iID: 24, iCnt: 70
0: SendMessage iID: 24, iCnt: 70
0: SendMessage iID: 24, iCnt: 70
0: SendMessage iID: 24, iCnt: 70
0: SendMessage iID: 24, iCnt: 70
0: SendMessage iID: 24, iCnt: 70
0: SendMessage iID: 24, iCnt: 70
0: SendMessage iID: 24, iCnt: 70
0: SendMessage iID: 24, iCnt: 70
0: SendMessage iID: 24, iCnt: 70
0: SendMessage iID: 24, iCnt: 70
0: SendMessage iID: 24, iCnt: 70
0: SendMessage iID: 24, iCnt: 70
0: Enqueue iID: 18, iCnt: 128, wasempty: 0
0: SendMessage iID: 24, iCnt: 70
0: SendMessage iID: 24, iCnt: 70
0: SendMessage iID: 24, iCnt: 70
0: SendMessage iID: 24, iCnt: 70
0: SendMessage iID: 24, iCnt: 70
0: SendMessage iID: 24, iCnt: 70
0: SendMessage iID: 24, iCnt: 70
0: SendMessage iID: 24, iCnt: 70
0: SendMessage iID: 24, iCnt: 70
0: SendMessage iID: 24, iCnt: 70
0: SendMessage iID: 24, iCnt: 70
0: SendMessage iID: 24, iCnt: 70
0: SendMessage iID: 24, iCnt: 70
0: SendMessage iID: 24, iCnt: 70
0: SendMessage iID: 24, iCnt: 70
0: SendMessage iID: 24, iCnt: 70
0: SendMessage iID: 24, iCnt: 70
0: SendMessage iID: 24, iCnt: 70
0: SendMessage iID: 24, iCnt: 70
0: SendMessage iID: 24, iCnt: 70
0: Enqueue iID: 18, iCnt: 129, wasempty: 0
0: SendMessage iID: 24, iCnt: 70
0: SendMessage iID: 24, iCnt: 70
0: SendMessage iID: 24, iCnt: 70
0: Enqueue iID: 18, iCnt: 130, wasempty: 0
0: SendMessage iID: 24, iCnt: 70
0: SendMessage iID: 24, iCnt: 70
0: SendMessage iID: 24, iCnt: 70
0: SendMessage iID: 24, iCnt: 70
0: SendMessage iID: 24, iCnt: 70
0: SendMessage iID: 24, iCnt: 70
0: SendMessage iID: 24, iCnt: 70
2020-09-06 13:59:18,, server idling -------------------------------------
That is when all dummy clients are already disconnected. The server tries to get the message 24 (connected clients list) to the Windows client but never get's an acknowledge packet back. During that time I wrote some chat text messages (ID 18) and you can see that they are correctly enqueued as expected. So what I can see from the log is that the Jamulus protocol works ok.
@softins Can you please check in the wireshark dump if that packet for ID 24 is sent over and over again as I can see in my log given above?
corrados
on 6 Sep 2020
Yes, that's what is happening. The CONN_CLIENTS_LIST with cnt=69 has length 1500 and is acked. In that list, clients 54 and 55 have not had their name filled in yet. When client 54's name is filled in, the list gets sent again, but is now 1509 bytes in length. It has cnt=70 and never gets asked. My suspicion is that the packet never arrives at the windows client. Either it is getting fragmented en route and fragments get dropped, or it is just too large for an MTU somewhere in the path and gets dropped. 1509 is just over the 1500 byte limit for Ethernet frames.
Now, if instead I look at the traffic to/from a particular test client, e.g. port 22172, I can see that a list with 1509 bytes and cnt=66 gets acked correctly. This is the list with client 55's name still missing. I can then see acks of client list coming back from the test client with cnts of 67, 68 and again 68, but I can't see the outbound client list. This is because it is fragmented at the sending end. The tcpdump captures the first fragment, with packet length 1514, but my tcpdump expression evidently doesn't match the remaining fragment of the same message.
Once the client list starts to drop again (Windows client disconnects), I can see the outbound lists to the test client again, and they continue to get acked.
softins
on 6 Sep 2020
1509 is just over the 1500 byte limit for Ethernet frames.
So would it get fragmented or just dropped? I don't know how that situation is meant to be handled.
It is supposed to be handled by the OS network stack, not by the application. If a network node wants to send an IP packet larger than the MTU for its egress interface, it is supposed to:
- Check the
DFbit in the header. If set, discard the packet and notify the sender using ICMP. This is how path MTU discovery works for TCP. - If
DFis clear, divide the packet according to the MTU size and use the fragmentation bits in the IP header to identify the fragments for reassembly by the receiving end.
https://www.wains.be/pub/networking/tcpdump_advanced_filters.txt has some useful description.
Apparently some routers will not allow fragmented IP datagrams. I don't know if they think it is more secure. I believe there are some kinds of DDoS attack that send unmatched fragments to fill up a router's or client's network stack memory with pending fragments.
In this case, it looks like the MTU to Volker's Windows client is a little less than the maximum, and the 1509-byte packet is not making it through. The maximum for Ethernet is 1514, including the Ethernet header: 1500 bytes payload and 14 bytes header. So the 1509-byte message (including Ethernet header) is 5 bytes under the limit. But some network connections are set instead to slightly smaller sizes such as 1492 (can't remember why). If the MTU in one hop to Volker is 1492, that would explain why the 1509-byte packet doesn't get through (although it ought still to get fragmented).
softins
on 6 Sep 2020
The interesting thing is that if I put a "sleep" of about a second in the loop each time I create a new dummy client, there is no issue with the Windows client. It gets all protocol packets correctly and the protocol does not get stuck. Just if I create the dummy clients in a very short time, the UDP packet seems to get blocked forever. Very strange...
corrados
on 6 Sep 2020
Anyway... We see problems with large UDP protocol messages and this should be solved. I am thinking of introducing an extra layer in the protocol to split large messages. I'll take a look at this now.
corrados
on 6 Sep 2020
Anyway... We see problems with large UDP protocol messages and this should be solved. I am thinking of introducing an extra layer in the protocol to split large messages. I'll take a look at this now.
The problem with this is that you have no easy way of knowing what the smallest per-hop MTU is between the server and any given client, so you don't know how small to split large messages. The TCP protocol takes care of this automatically using path MTU discovery as I mentioned above.
If you are going to make non-backward compatible changes to the protocol, maybe for Jamulus V4, I would recommend redesigning it completely to use TCP connections for data/control messages and UDP for audio streams. This is how many telephony protocols work, and would allow, for example, a client to connect using TCP and establish the connection parameters before starting audio. Also, a listen-only client could then maintain a connection without having to send an audio stream to the server. The TCP messages could be textual and line-based, similarly to SIP or HTTP, which would aid parsing. The audio streams could maybe use the standard RTP format.
I don't underestimate the size of such a project, though! It would be quite substantial.
softins
on 6 Sep 2020
I already wrote a comment to that in another Issue, see: https://github.com/corrados/jamulus/issues/255#issuecomment-683310370
corrados
on 6 Sep 2020
If you are going to make non-backward compatible changes to the protocol
No, that will not be non-backward compatible. I'll do it so that it will be compatible to older versions of Jamulus.
corrados
on 6 Sep 2020
I've updated my tcpdump script to capture fragmented IP packets too (which Wireshark will reassemble for display):
[root@vps2 ~]# cat capture-jamulus-proto.sh
#!/bin/sh

DATE=`date '+%Y%m%d-%H%M%S'`
FILE=jamulus-proto-$DATE.pkt

cd /var/tmp

tcpdump -C 32 -i eth0 -nn -p -s0 -w $FILE '(ip[6:2]&0x3fff) != 0 or (udp portrange 22120-22139 and (udp[8:2] == 0 and udp[4:2]-17 == (udp[14]<<8)+udp[13]))' </dev/null >/dev/null 2>&1 &
Of course, portrange 22120-22139 can be replaced by a specific port designation such as port 22124
softins
on 6 Sep 2020
Thanks Tony, capture now running as above on 22133
storeilly
on 6 Sep 2020
@storeilly I have implemented a proof-of-conecpt code of splitting large UDP messages to avoid the problem we see with a lot of clients connected. I have created a tag for it: proof_of_concept_protsplit (https://github.com/corrados/jamulus/releases/tag/proof_of_concept_protsplit). I tested it quickly but it could contain any sort of instability and security issues. And also it is not compatible to old Jamulus versions (yet). But we may do a quick test on your server if you like. Then I could make sure that the problem is really solved. If you want to compile/run that code, you should shut down that Jamulus server shortly after I have done my testing.
corrados
on 6 Sep 2020
Running on same port 22133
storeilly
on 6 Sep 2020
Wow, you are super responsive!
But unfortunately, I still see the issue :-(. What I can see with your server "_Jam 270a5c39 33_" is that it takes a little bit longer until the mixer board faders get their label which is expected since we now have more "ping-pong" communication between the clients but still, the protocol get's stuck for the Windows client. So maybe it seems not to be an issue with the protocol size which causes the protocol message not to reach the Windows client.
Have you stored the wireshark log for that server? Maybe @softins could check that the protocol UDP packets are really smaller now and therefore verify that my implementation does work correctly.
corrados
on 6 Sep 2020
Sure, let me know when it's up, and I'll have a look sometime tomorrow (Monday)
softins
on 6 Sep 2020
Wow, you are super responsive!
This is important to me, I'm speaking to the Irish Choral Association tomorrow evening promoting this! :)
This is the run command....
./Jamulus-270a5c39 -n -d -T -l /var/log/jamulus/jamulus11.log -u 100 -e jamulusjazz.fischvolk.de:22324 -o "Jam 270a5c39 33;Dublin;104" -p 22133 -s
But it didn't write the log file!
tcpdump file uploaded to dropbox.... jamulus-proto-20200906-201952.pkt and server now stopped.
That's all for tonight though!
storeilly
on 6 Sep 2020
Folk:
I will have some free time tonight (U.S. Pacific time, when most of you are in bed); I also plan to set up a 2nd server to kick off clients in the same data center as my dedicated server (newark-music.allyn.com) so I could bang with with clients at a faster clip than from my current setup with clients running from my Seattle server. I am wondering what tests I could do for you either for this ticket or with #547. I also have a question; if I want to create some test code, can I set up a separate branch without affecting the main tip and what everyone else is doing?
maallyn
on 6 Sep 2020
I'll leave the proper report to the expert @softins I only dabble but I will say that there are 4 packets with frame length of 1518 CLM_CONN_CLIENTS_LIST (59 clients) and CONN_CLIENTS_LIST (59 clients) and many fragmented reassembled packets.
storeilly
on 6 Sep 2020
Not quite sure what was happening on that test (20200906-201952), but it looks the same as the previous test. Either the server didn't have Volker's latest test changes, or they didn't have the desired effect. The size of the CONN_CLIENTS_LIST grows until all but one of the names have been filled in, at which point the whole packet is 1509 bytes long. This gets acked by the test clients, but not by the Windows client. When the last name is filled in, the list gets fragmented into two IP packets, the first of which is 1514 bytes long. These messages continue to get acked by the test clients, but the communication with the Windows client is stalled.
softins
on 7 Sep 2020
@storeilly it's not a solution, but might be a useful data point, if you could reduce your MTU by 8 bytes, and then Volker repeat the test with standard server code. This will cause fragmentation to kick in slightly earlier, and might then keep the Windows client going, if indeed it can receive fragmented packets (does the Windows client correctly display the Default Server list? I imagine it must do).
To do this, on the fly:
# ifconfig eth0 mtu 1492 up
(replacing eth0 with the actual interface name, of course)
softins
on 7 Sep 2020
I don't have time to do anything much with the server today, but I've amended the MTU (thank you)
ubuntu@ip-172-26-14-115:~$ ifconfig | grep -i MTU
eth0: flags=4163
lo: flags=73
and restarted server 10. The binary I was using last night is now in dropbox Jamulus-270a5c39
storeilly
on 7 Sep 2020
Not quite sure what was happening on that test (20200906-201952), but it looks the same as the previous test.
Sorry, my fault. The code I've done yesterday was a bit too much of a "quick hack". It obviously does not work as expected which I found out today when I tried it out again. So I need some more time to do it correctly and then we should do the test again.
corrados
on 7 Sep 2020
Can I create my own test branch? Or will that harm the codebase? I do not plan to merge it into the main.
maallyn
on 7 Sep 2020
Sorry, I forgot to answer your question. Yes, of course, you can do whatever changes you want on your private branch in your fork. It will not harm the codebase.
corrados
on 7 Sep 2020
Thank you
maallyn
on 7 Sep 2020
@storeilly and @softins I made good progress on my split_messages Git branch. The new protocol now seems to work. I also have already implemented the backward compatibility and added some security checks. Right now there are still a lot of debug messages added to the code which have to be removed and also some cleanup and improvement of the code must be done. But I am pretty sure that latest at the end of the weekend the new code should be ready for testing.
corrados
on 8 Sep 2020
That sounds good. Once I have details of the new protocol, I will update my Wireshark dissector to understand it.
softins
on 8 Sep 2020
Excellent, well done!! Can't wait 👍
storeilly
on 8 Sep 2020
A first working version of the new protocol split code is finished and can be tested. I created a new tag for it: feature_protosplit (https://github.com/corrados/jamulus/releases/tag/feature_protosplit). I hope this time it works correctly.
corrados
on 10 Sep 2020
@storeilly I have merge to code to the master branch now. It would be good if you could setup a Jamulus server with the new code so I could verify that the problem is solved now.
corrados
on 12 Sep 2020
@corrados I just compiled a server with the master branch code. (server name "SWE mt test" under Jazz)
 genesisproject2020
on 12 Sep 2020
genesisproject2020
on 12 Sep 2020
@storeilly I have merge to code to the master branch now. It would be good if you could setup a Jamulus server with the new code so I could verify that the problem is solved now.
@corrados That's up now on port 22134 with tcpdump monitoring. @softins I was tempted to edit the filter to include the local ip, but wasn't certain of the effect. The objective is to include only the local 22134 port packets, as I was collecting data before the server had been started. That file is in dropbox.
storeilly
on 12 Sep 2020
I can have a look at anything tomorrow (Sun). Not available today, sorry.
softins
on 12 Sep 2020
That's up now on port 22134 with tcpdump monitoring
Good news: The problem is solved now :-). I just did the test on the "_Jam mt 26_" and could see the issue as expected since it is the old server version. Then I did exactly the same test on the new "_Jam 1a3d2651 34_" and the issue was gone. I could see all clients on the mixer board and I could send and receive chat text messages. So the split messages algorithm works fine.
corrados
on 12 Sep 2020
Excellent!!!! @brynalf
storeilly
on 12 Sep 2020
I just compiled a server with the master branch code. (server name "SWE mt test" under Jazz)
Thanks. I tried that out, too, and it seems it has very similar performace as storeillys server.
corrados
on 12 Sep 2020
Excellent work everyone. Scalability solidly grew from the starting of this effort. What will be the area of focus for performance optimization now? (if it's there really anything known that may provide a huge jump in terms of performance or stability)
P.S.: Now the attack of the client drones to the server fortress may restart, how many will it hold this round? May the jamforce be with you :-)
WolfganP
on 12 Sep 2020
There is still room for improvement. On storeillys server I could run successfully about 70 clients using Stereo (I have not yet tried in Mono mode). It seems that the protocol management thread stalls first when at the same time you can still get some useful audio back from the server. Maybe it is an issue of thread priorities or blocking threads. Some more investigations should follow...
corrados
on 12 Sep 2020
@corrados I just compiled a server with the master branch code. (server name "SWE mt test" under Jazz)
I have now added some scripts that can be started from a webpage to be able to compile a new version of the code, start and stop tcpdump and possibility to download the cap file directly. If any of you that do testing like to have access to the server, just send me a message.
genesisproject2020
on 13 Sep 2020
There is still room for improvement. On storeillys server I could run successfully about 70 clients using Stereo (I have not yet tried in Mono mode). It seems that the protocol management thread stalls first when at the same time you can still get some useful audio back from the server. Maybe it is an issue of thread priorities or blocking threads. Some more investigations should follow...
It may also be an issue with OnTimer overrun (in the sense that all audio processing -decompress+mix+compress- doesn't fit in the allotted time between timer "interrupts" with the async i/o packets threads also getting data in and out from the buffers/arrays).
Maybe it'll help to add a check if timeout() triggers? (as per https://doc.qt.io/qtforpython/PySide2/QtCore/QTimer.html#accuracy-and-timer-resolution)
Beyond the initial process profiling we started with, it may be worthy to instrument the critical Qt queues inside the app to measure queue length and jobs consumption.
WolfganP
on 15 Sep 2020
Following up on the testing I mentioned in issue #599 here, rather than continuing to hijack that thread...
I set up an experiment where I created two pages of channel data, so that the decode thread can write to one page at the same time that the mix threads read from the other one. With that experiment, I was able to raise my stable client count from 65 to 80 on the same class of machine.
At 80, it seems like the decode thread reaches 90+% CPU usage for the one core it's on, and sound quality falls off rapidly as more clients join. It seems like the next beneficial change would be to break the decode into blocks similar to the way the mix thread is handled. I'll probably try that experiment tomorrow.
 kraney
on 1 Oct 2020
kraney
on 1 Oct 2020
@brynalf It would be interesting if you could do some testing of the new code provided by kraney in his pull request #653. Just clone from his repo (https://github.com/kraney/jamulus.git) and checkout his concurrency_tweaks branch. Then we would have a direct comparison of the performance gain between the code currently on master and with the tweaks.
corrados
on 2 Oct 2020
I will do my best to squeeze that activity in today Saturday.
brynalf
on 3 Oct 2020
I have now compared 3.5.11 to the kraney version.
Main conclusion:
No difference in upper limit in my regular test environment, i.e. server on 16 core processor and emulated users on two 4 core processors + sound quality probe on a raspberry pi with an audio interface.
I have verified that I am not comparing the same version to itself.
In my setup both the 3.5.11 and the kraney versions have an audio quality based limit of 85 users for buffer 128, mono-in/stereo-out, high quality, i.e. 657 kbps.
In my setup both the 3.5.11 and the kraney versions have an audio quality based limit of 45 users for buffer 64 and small network buffers enabled, mono-in/stereo-out, high quality, i.e. 900 kbps
Processor core peaks never go above 70%.
brynalf
on 3 Oct 2020
The emulated users are running 3.5.11 in all of the tests.
brynalf
on 3 Oct 2020
Thank you for testing.
Actually, these results were not expected. I knew that doing the decoding in one thread maybe a bottleneck if you have a lot of clients connected. This is one thing which was improved by kraney as far as I understood his code. And he reported about a gain in performance. The open question is now, what is the limiting factor on your system with such a huge amount of CPU cores.
corrados
on 3 Oct 2020
FWIW I also tried testing with 10 cores, and got identically the same performance as with 8. I haven’t yet found what’s the new bottleneck.
kraney
on 3 Oct 2020
Beyond the tweaking and the tests on scaling and the effects on audio + observed CPU usage, I still think we're "divining" what's the root cause on reaching the limits rather than knowing for sure if it's a timer overrun or some other interaction between the threads when on heavy load.
In order to detect if the timer overrruns (ie decode+mix+encode cycle not finished between timer's triggering) isn't it possible to log a counter of failed to complete audio processing cycles? (ie at https://github.com/corrados/jamulus/blob/2fd8f8ae3f03ae5018d0fdb660518d08318dbb35/src/server.cpp#L183 if I interpreted the code correctly)
WolfganP
on 3 Oct 2020
I ran perf on the code this weekend when it was full of clients, and unsurprisingly Mix topped the list. No major smoking gun although spinlock showed up rather high, which suggests that there's a lot of time lost trying to obtain a Mutex so there might be benefit in trying to make the big lock around decode more granular.
kraney
on 5 Oct 2020
although spinlock showed up rather high, which suggests that there's a lot of time lost trying to obtain a Mutex
Does that mean tasks were _waiting_ on a Mutex doing nothing, or that the call to acquire the Mutex was using computation time heavily? Just checking -- I think you mean the latter.
pljones
on 5 Oct 2020
A spinlock implies a thread is waiting for a lock without going to sleep, just using the CPU to wait. Going to sleep and waking up is expensive, so it's not necessarily a bad thing to do, but having it show up near the top of the profile results is kind of a red flag.
kraney
on 5 Oct 2020
I have now applied some multithreading improvements from kraney (_Thank you!_) to the Git master. Today I did a test where I connected 99 dummy clients using stereo over my LAN (i.e. no internet) from my laptop to my Linux desktop PC (i5 with 4 CPU cores, no hyperthreading) and on that Linux desktop PC I run a normal Jamulus client so the total number was 100 clients. I had perfect audio quality on that normal client. Here is a screenshot of that session:

corrados
on 5 Oct 2020
With that experiment, I was able to raise my stable client count from 65 to 80 on the same class of machine. At 80, it seems like the decode thread reaches 90+% CPU usage for the one core it's on, and sound quality falls off rapidly as more clients join.
I assume you did this test on your 8-core CPU. Now we have to find out why I can successfully run 100 stereo clients on my 4-core CPU whereas this is not possible on your 8-core CPU.
What type of dummy clients are you using? For my test I am using a separate Linux laptop and I use a special client.cpp file where I do not call the OPUS encoding/decoding but only send random encoded OPUS bits to the server. Otherwise my laptop would not be able to run such a large number of dummy clients. Maybe the type of coded data the OPUS decoder at the server gets influences it's CPU usage? But since I send random bits, I would imagine that the OPUS decoder must even require more CPU to decode this.
On my experiment the laptop and the PC where connected via a 100 Mbit switch via LAN cable. So I think I did not have any network limitation. Since the ping time is very short, all protocol messages get through in almost no time. Maybe if the ping is larger, the protocol messages take longer and you get more influence of the protocol messages on your audio performance.
Any other ideas?
corrados
on 6 Oct 2020
What type of dummy clients are you using? For my test I am using a separate Linux laptop and I use a special client.cpp file where I do not call the OPUS encoding/decoding but only send random encoded OPUS bits to the server. Otherwise my laptop would not be able to run such a large number of dummy clients. Maybe the type of coded data the OPUS decoder at the server gets influences it's CPU usage? But since I send random bits, I would imagine that the OPUS decoder must even require more CPU to decode this.
On my experiment the laptop and the PC where connected via a 100 Mbit switch via LAN cable. So I think I did not have any network limitation. Since the ping time is very short, all protocol messages get through in almost no time. Maybe if the ping is larger, the protocol messages take longer and you get more influence of the protocol messages on your audio performance.
Interesting... I've never thought about the client side on load testing a server. Your modified client is an smart way to test the server, but as it doesn't inject "real" audio is it really possible to evaluate the audio quality?
Would it be a good mod for a client as a load test tool for it to capture/process real audio once, and then behave as multiple clients? (ie send 100 registrations, encode the "real" audio once and send 100 audio packets as if they were coming from 100 diff clients, process/output the mix back for 1st client and discard the rest)
WolfganP
on 6 Oct 2020
I built jamulus and jack into a docker container along with a config file that sets to mono in / stereo out. Jack is set to dummy audio. I find I can run about 80 of these per 8-core cloud instance, so I launch a couple of those to act as clients. I run them in the same zone as the server, so network should similarly not be an issue.
I connect with a normal client to check the audio quality. That one has about 13-20ms network latency. Since the dummy audio is silent, the quality really only reflects how my own input sounds once it comes back from the server. I've tried to find a way to have jack read a wav file in a loop as input or something, but haven't had much luck. Still, this seems to produce decent result and I have had the opportunity to compare to behavior of a server handling about a dozen real clients, and it seems to be reasonably similar.
Only speculating here, but random audio would not compress well at all while silence should compress extremely well. Maybe it's more expensive to decompress when it has been more thoroughly compressed? Silence could be a pathological case, compression algorithms can be weird that way.
Another possibility is that it's due to running as a VM in the cloud compared to running on bare metal. Hypervisor overhead could account for some of the difference. Also this is on Intel Skylake architecture, which is not the newest generation.
Also, I learned over the weekend my "nice" setting was not taking effect. I fixed this and I get an incremental performance boost as a result. With that I get about 76 clients on 4 cores. I can get nearly to 100 with 6 cores. I don't believe I'm getting realtime priority either, but I have not addressed that yet. There might be another incremental gain to be had from that.
If you want to experiment with how network latency affects the results, it should be possible with your existing setup using tc. https://bencane.com/2012/07/16/tc-adding-simulated-network-latency-to-your-linux-server/
kraney
on 6 Oct 2020
I can get nearly to 100 with 6 cores.
Have you used the code on your branch or did you perform that test using the latest Git master code (as I did)?
corrados
on 6 Oct 2020
@storeilly I can see that you still have the test servers for multithreading testing running. Could you update one of these servers with the latest Git code on the master branch so that I can do some further testing? Maybe with the latest code we could increase the number of clients on the server hardware you are using.
corrados
on 6 Oct 2020
@corrados I haven't yet had time to try the current master, so the numbers I mention are based on my branch.
kraney
on 6 Oct 2020
Your modified client is an smart way to test the server, but as it doesn't inject "real" audio is it really possible to evaluate the audio quality?
I think it is enough to check the audio quality of the single "real" client. So I set this to Solo and play my drums for testing. If the audio and latency is ok, I assume that this is the case for all other dummy clients, too.
@corrados I haven't yet had time to try the current master, so the numbers I mention are based on my branch.
It would be a good comparison, if you have time, to use the code on master on exactly the same hardware to see if we have a loss in the number of clients compared to your branch.
corrados
on 6 Oct 2020
Will it help you all if I temporarily rent a 4 CPU dedicated server in the Linode Newark data center, which is the same data center as my newark-music.allyn.com, whish is a two CPU dedicated server? This way, perhaps I can try to overwhelm it with clients that I automatically generate using the existing Jamulus client and a script to start them (using no graphics), but play music through them using audacity running through jack. If you folks think this is worthwhile, I am willing to pay for a few days' rental.
maallyn
on 6 Oct 2020
[...] with clients that I automatically generate using the existing Jamulus client and a script to start them (using no graphics), but play music through them using audacity running through jack. If you folks think this is worthwhile, I am willing to pay for a few days' rental.
I'll certainly be interested in the script :-) (I tried to generate clients getting audio fed by a player via dummy/virtual audio cards, but never could get it working properly) TIA @maallyn!
WolfganP
on 6 Oct 2020
Will it help you all if I temporarily rent a 4 CPU dedicated server in the Linode Newark data center, which is the same data center as my newark-music.allyn.com
As far as I know, storeilly already has a 4 CPU server rented. So if he updates his server with the new code, that should be sufficient for testing. Thanks.
corrados
on 6 Oct 2020
@storeilly I can see that you still have the test servers for multithreading testing running. Could you update one of these servers with the latest Git code on the master branch so that I can do some further testing? Maybe with the latest code we could increase the number of clients on the server hardware you are using.
You got lucky, I had a few minutes :) Running now on port 22125
storeilly
on 6 Oct 2020
That's great, thanks :-). I am currently testing and it looks very good. I'll occupy 98 slots on that server right now. If anyone wants to join, just connect (but make sure you set yourself to solo since the dummy clients make a lot of noise.
corrados
on 6 Oct 2020
I just had a short session with "Andrew" on the server. We had 99 clients and our audio was good. A little bit higher jitter but still ok to play. So the code from kraney really seems to make a difference. Thanks again :-).
@storeilly I was using stereo dummy clients. So I can confirm that on your server hardware 100 clients can connect successfully. Can you please tell us the hardware specs of your server?
corrados
on 6 Oct 2020
That was me
 trombonepizza
on 6 Oct 2020
trombonepizza
on 6 Oct 2020
What I did was to set up jackd, qjackctl, jamulus, and audacity on the machine used for the clients. Then, using a shell script, I started the clients using something like this:
==========================================================
/bin/bash
for i in {1..46}
do
/home/maallyn/jamulus/Jamulus -j -n --connect 172.104.29.25 &
done
Once that is done, then I have to go into jack and connect jack's source to each client and then go into audacity and connect audacity to jack's sink.
You cannot have a user session on Linux with more than 50 or so clients due to the limits of Jack. So I have two user accounts on my server; each one kicking off 50 clients for a total of 100.
maallyn
on 6 Oct 2020
I just had a short session with "Andrew" on the server. We had 99 clients and our audio was good. A little bit higher jitter but still ok to play. So the code from kraney really seems to make a difference. Thanks again :-).
@storeilly I was using stereo dummy clients. So I can confirm that on your server hardware 100 clients can connect successfully. Can you please tell us the hardware specs of your server?
Thank you sir..
That server is on Amazon Lightsail with 32 GB RAM, 8 vCPUs, 640 GB SSD running Ubuntu 18.04
storeilly
on 7 Oct 2020
With the main branch, with my nice fix, I can support 91 clients on my 8-core VM. Building from my branch, same server same fix, I was able to run at least 125 clients. (That was where I'd set the MAX for my build. I decided not to rebuild with a higher ceiling because I was seeing occasional increases in latency that managed to subside, like I often see when I'm within a few clients of the limit.)
So there's still an incremental benefit to be had from some of the other changes I made. The question is just whether the benefit offsets the risks.
For what it's worth, the paging change similarly looks worse than it actually is. I just created structs to hold the same values that you're keeping in parallel vectors, and did a direct substitution of struct fields for vectors. (For example, vecvecsData[currentchan] becomes vecCurrentData[currentchan].sData - a direct substitution in every case with no change to the logic. And then I make a vector of that so I can easily have two (or more) pages, so the same field becomes vecvecCurrentData[currentpage][currentchan].sData. Same logical change for every field.
The reason for the move to structs was simply that I thought the extra layer of vector - vecvecvecsData - would be getting too obtuse.
Memory-wise the extra page seems of no concern. Even if I use the minimum memory size possible for my 8-core VM, the vast majority of the RAM is unused.
kraney
on 7 Oct 2020
So there's still an incremental benefit to be had from some of the other changes I made. The question is just whether the benefit offsets the risks.
I think the way to go here is to use what we have right now on Git master as a starting point for further improvements. E.g. you have optimized the iMTBlockSize for the mix/encoding but not for the decoding (it is still set to 20). Could you try to optimize this as well and do some testing if you see an improvement?
corrados
on 7 Oct 2020
What I did was to set up jackd, qjackctl, jamulus, and audacity on the machine used for the clients. Then, using a shell script, I started the clients using something like this:
==========================================================
/bin/bash
for i in {1..46}
do
/home/maallyn/jamulus/Jamulus -j -n --connect 172.104.29.25 &
doneOnce that is done, then I have to go into jack and connect jack's source to each client and then go into audacity and connect audacity to jack's sink.
You cannot have a user session on Linux with more than 50 or so clients due to the limits of Jack. So I have two user accounts on my server; each one kicking off 50 clients for a total of 100.
Thx @maallyn. The jamulus launcher script is not my issue, but which card to use with jack, as I don't want to use an actual one to avoid interference (I was trying to use virtual/dummy ones, so no external sound other than the one injected is going thru, but nothing worked for me).
But I think I'm going way out of topic.
WolfganP
on 7 Oct 2020
I think the way to go here is to use what we have right now on Git master as a starting point for further improvements. E.g. you have optimized the iMTBlockSize for the mix/encoding but not for the decoding (it is still set to 20). Could you try to optimize this as well and do some testing if you see an improvement?
I consider this to be explored territory already. I tried a number of things already; obviously none of the failed experiments made it into the pull request.
Decoding scales linearly with the number of clients, unlike mix which scales O(n^2). So it doesn't really need the same kind of math. One thing I did try for both was, instead of having a fixed group size, having a fixed number of threads - one per core. It turned out this might change the efficiency at lower numbers of clients, but it doesn't really affect the upper limit at all, which occurs around one thread per core already anyway. Actually, one thread per core performed slightly worse than the current branch; there appears to be some benefit to letting mix (especially) exceed the number of cores. I didn't see any particular benefit from changing block size for the decode. So I left it alone.
kraney
on 8 Oct 2020
One more interesting result was that when I did the test with 100 clients on my local PC over the local LAN, I could not see increased jitter. But when I did the test on storeilly's Amazon Lightsail server, I could see an increase of jitter. So we also have to consider on which hardware the Jamulus server is running and not only do tests on a local PC. That makes the debugging and optimization much harder.
I think we are at a point where it makes sense to implement something suggested by WolfgangP in his above comment:
In order to detect if the timer overrruns (ie decode+mix+encode cycle not finished between timer's triggering) isn't it possible to log a counter of failed to complete audio processing cycles? (ie at CHighPrecisionTimer::run() if I interpreted the code correctly)
corrados
on 8 Oct 2020
@storeilly
You got lucky, I had a few minutes :) Running now on port 22125
I can see that you still have all the multithreading Jam test servers running in the Jazz-Serverlist. I think you can shut them all down since I don't need them anymore for testing.
Maybe it is a good idea to setup a single Jamulus server on your Amazon Lightsail server using the latest Git master code (I just increased the max. number of supported clients to 150 on master) and then we could ask in the forums/Facebook for a big test to get the maximum of Jamulus client users online at the same time. This new server could be started with, e.g.:
./Jamulus -s -n -p 22124 -T -u 150 -e "jamulusclassical.fischvolk.de:22524" -o "ChoralTesting;Dublin;104"
I think since most choral singers will not use 64 samples, you should start it without the -F. And, of course, you should enable some logging.
What do you think about this?
corrados
on 8 Oct 2020
One reason they are still running is I haven't had a minute! The success of
Jamulus acceptance has me busy with clients but I should get to this soon.
I'm happy to help.
Stephen
On Thu 8 Oct 2020, 13:46 Volker Fischer, notifications@github.com wrote:
@storeilly https://github.com/storeilly
You got lucky, I had a few minutes :) Running now on port 22125
I can see that you still have all the multithreading Jam test servers
running in the Jazz-Serverlist. I think you can shut them all down since I
don't need them anymore for testing.Maybe it is a good idea to setup a single Jamulus server on your Amazon
Lightsail server using the latest Git master code (I just increased the
max. number of supported clients to 150 on master) and then we could ask in
the forums/Facebook for a big test to get the maximum of Jamulus client
users online at the same time. This new server could be started with, e.g.:./Jamulus -s -n -p 22124 -T -u 150 -e "jamulusclassical.fischvolk.de:22524"
-o "ChoralTesting;Dublin;104"I think since most choral singers will not use 64 samples, you should
start it without the -F. And, of course, you should enable some logging.What do you think about this?
—
You are receiving this because you were mentioned.
Reply to this email directly, view it on GitHub
https://github.com/corrados/jamulus/issues/455#issuecomment-705543723,
or unsubscribe
https://github.com/notifications/unsubscribe-auth/ABIJSQNY5DKHGULGCBO3YJTSJWYC5ANCNFSM4OXQXIXQ
.
storeilly
on 8 Oct 2020
About how to set up Jack without an audio device. You can use the Alsa loopback device.
in the /etc/modprobe.d/alsa-base.conf file have:
alias snd-card-0 snd-aloop
alias snd-card-1 snd-aloop
alias snd-card-2 snd-aloop
alias snd-card-3 snd-aloop
options snd-aloop enable=1,1,1,1 index=0,1,2,3
in the /etc/modules.conf, add:
snd-aloop
maallyn
on 9 Oct 2020
Fantastic work on the code!!!
Today (10 Oct at approximately 12 CET) I updated linux and pulled the experimental code for my home server and hit it with as many 3.5.12 clients as it would take to break it.
Buffer 128, mono-in/Stereo out, audio quality high ==> Audio stream rate=657 kbps.
That test broke at least my own record. If accepting some crackles and pops it was usable up to 155 clients and broke (in a recoverable way) at 162 clients. At these many clients it seems to take a while (around a minute) for all the clients to settle when adding or removing an additional client. The load is now spread very evenly over the cpu cores and is only at about 30% when the jamulus server "breaks". This time I had to use 4 computers for the clients. Network traffic at 88 Mbps both ways.
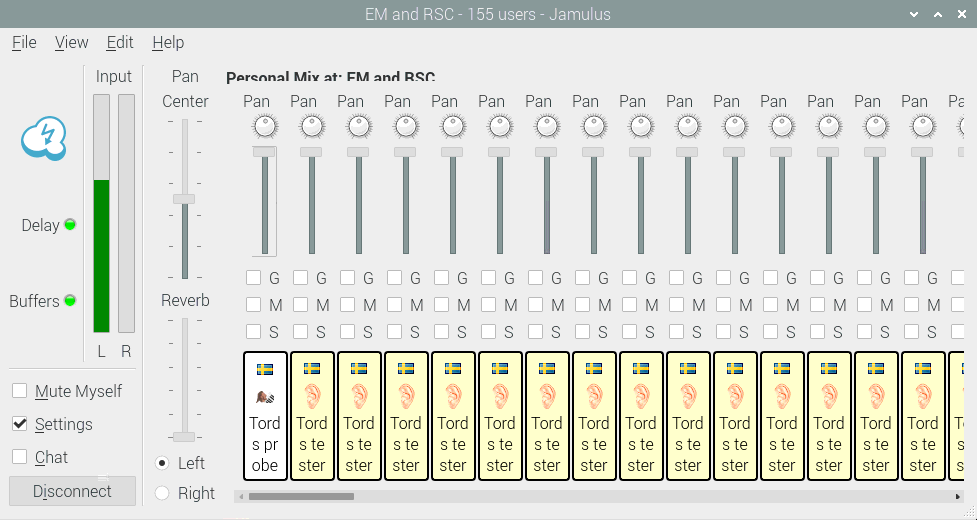
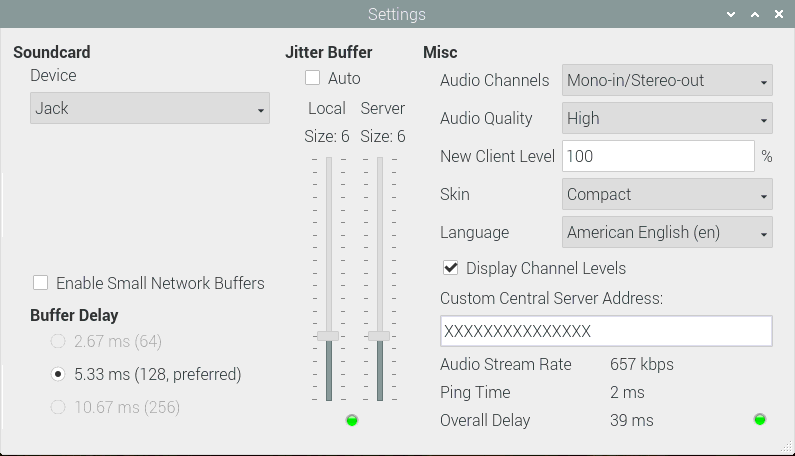
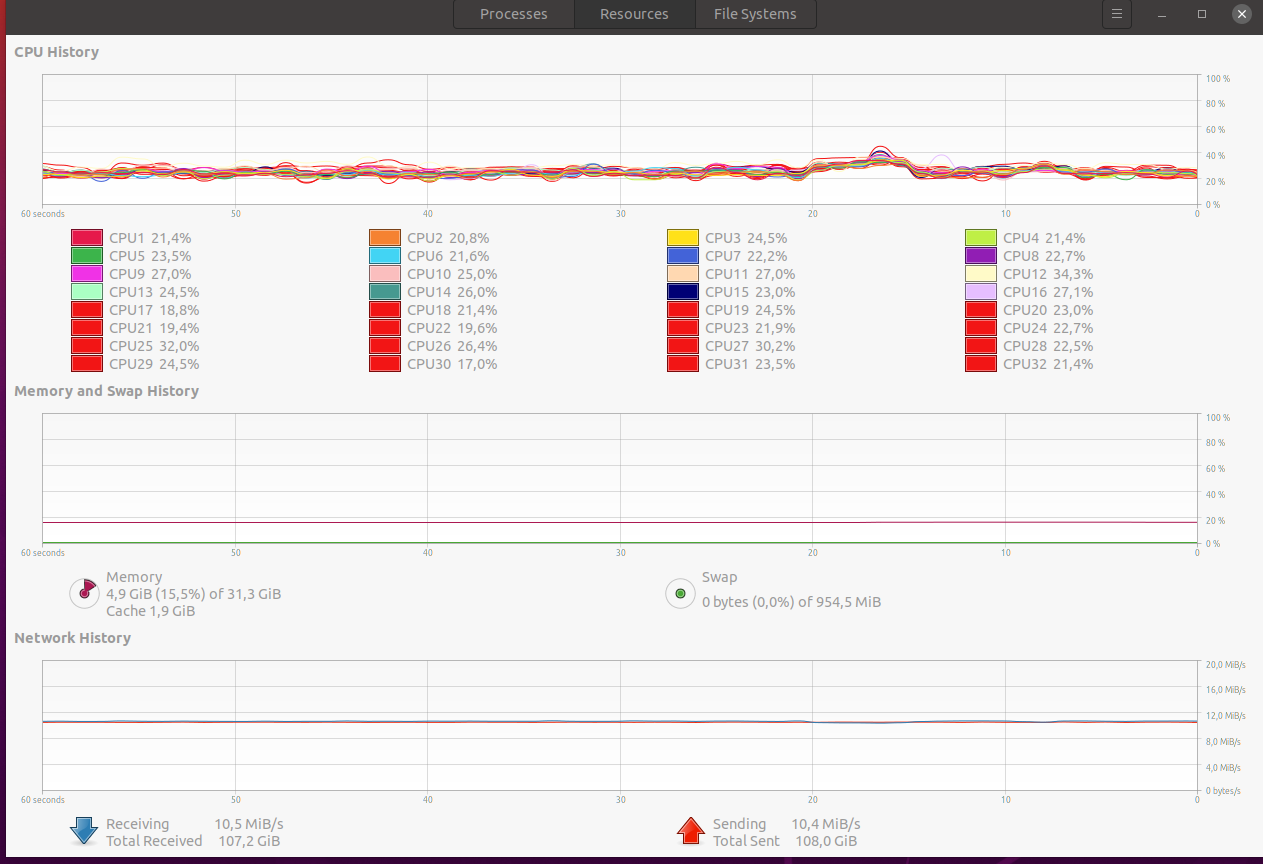
brynalf
on 10 Oct 2020
I updated linux and pulled the experimental code for my home server
What exactly do you mean by _experimental code_? Do you mean the latest Git master code? Or do you mean the private branch kraney:concurrency_tweaks?
corrados
on 10 Oct 2020
I meant the latest Git master code.
brynalf
on 12 Oct 2020
That's good news, thanks :-).
corrados
on 12 Oct 2020
we have a choral group with ~100 members who would like to use one of our jamulus instances with --numchannels=120 . at the moment, our jamulus 3.5.9 only supports 50. which version can i download or compile to take advantage of numchannels greater than 50? thanks in advance.
 plungerman
on 11 Nov 2020
plungerman
on 11 Nov 2020
we have a choral group with ~100 members who would like to use one of our jamulus instances with --numchannels=120 . at the moment, our jamulus 3.5.9 only supports 50. which version can i download or compile to take advantage of numchannels greater than 50? thanks in advance.
You can use the latest version, 3.6.0, which allows --numchannels of up to 150. To support that number, you will also want to run the server on a dedicated machine with good bandwidth and several CPU cores and to enable --multithreading
softins
on 11 Nov 2020
we have a choral group with ~100 members who would like to use one of our jamulus instances with --numchannels=120 . at the moment, our jamulus 3.5.9 only supports 50. which version can i download or compile to take advantage of numchannels greater than 50? thanks in advance.
You might also try my fork at https://github.com/kraney/jamulus where I've been able to boost performance further on lesser hardware. There's been some wishing for independent confirmation of the fork's performance.
kraney
on 11 Nov 2020
excellent. thanks. i will try 3.6.0 first and report back presently.
plungerman
on 11 Nov 2020
I made a test with ~ 20 to 30 jamulus/jack/fake sound card/headless clients with the latest 3.6.0 fork (and some mini changes from my fork) on a dual core virtual machine (Intel® Xeon® E5-2660V3) and the latency was so so. htop reported around 70% usage per core. The server was started with -F and -T
Before that I tried to connect my interface to jack on a laptop running a 6th gen intel core m5. The client went almost unresponsive and one core on the server was at 99%. Even chat messages from another device were delayed.
Sound quality was really bad.
Does that mean that slow clients can delay the server?
 ann0see
on 20 Nov 2020
ann0see
on 20 Nov 2020
Hi,
I tested my 4 vCore server with two jamulus servers running simultaneously in multithreaded mode. with small network buffers enabled the sound went bubbly around 20 users, as expected (CPU load at around 130/400%). i connected 35 clients which killed soundquality altogether. BUT: on the other jamulus instance running on the same server audio was perfect (around 10 more clients)
I could effectively fit almost 50 clients on the hardware (which is a virtual machine) but not in one server. Haven't checked yet if i could fit even more when launching even more server instances.
Is this to be expected or might that be a hint to some bottleneck still keeping the server from making full use of the processing power before the audio quality starts to degrade?
cheers
dingodoppelt
on 1 Dec 2020
Is this to be expected
I would say, no. But it's hard to find out this bottleneck in your scenario. What is interesting is that on my 4 CPU core machine I could server 100 clients, see https://github.com/corrados/jamulus/issues/455#issuecomment-703804934.
corrados
on 2 Dec 2020
What is interesting is that on my 4 CPU core machine I could server 100 clients
When I disable small network buffers I can fit way more clients. I did my tests with small network buffers enabled (buffersize 64) and this really kills most of the servers (which are virtual machines in the cloud) at around 20 - 30 clients. The interesting part was that I could overload just one server (by connecting 35 clients, it showed pings and delays as >500ms) but not the hardware the servers were running on (the other server still did fit 10 clients before it broke). I wonder if it is possible to give that spare processing power to just one server to fit as many clients as the hardware can handle.
dingodoppelt
on 4 Dec 2020
but not the hardware the servers were running on
This is an interesting point. As far as I understood, you are running a virtual server. So you cannot say that you reached the limit of the hardware but the limit of your virtual server. Maybe the virtual server limits CPU access an a per thread basis. That would explain your described behaviour.
I think if we really want to tweak the multithreading performance of the Jamulus server even further, we have to do it on a real hardware and not on a virtual server because the virtual server has too many unknowns when it comes to resource sharing.
corrados
on 4 Dec 2020
Two points here - it's definitely true both AWS and GCP offer instance types where you get fractional CPU cores; your instance gets "credits" that accumulate over time, and when you are actually using the CPU you spend those credits. That lets you "burst" and use the whole core for a little while, but with sustained use you'll run out of credits and get swapped out for another VM. These instances aren't a good fit for Jamulus if you're trying to maximize the number of clients you can support. There's an alternative to switching to bare hardware, which is to use an instance type that doesn't limit you to fractional cores.
Second, getting 10 more clients on a second server instance doesn't imply that there's a way to get the first instance to grow by 10 more clients instead, because the amount of work doesn't grow linearly with the number of clients. It grows by n^2. So going from 35 clients to 45 clients on a single server adds 800 new mix operations, while starting a second server instead having 10 clients only adds 100 mix operations. Having space for 100 more mix operations only gets you from 35 clients to 36, if it's all in the same server process.
kraney
on 4 Dec 2020
I am wondering if we are taking the wrong perspective on performance with cloud services. Each cloud service has different approaches to maximize utilization of their computing and networking resources. Jamulus is unique because we care about real-time performance. Most (the ideal) cloud apps care more about lots of computing in burst and less about real-time performance (or real-time to these apps are in the 100s of milliseconds). Task switching means buffering and we know buffering means latency. As we measure the load for additional clients, we should be looking at how buffering and latency changes.
 gene96817
on 4 Dec 2020
gene96817
on 4 Dec 2020
Folks:
I have a Linode dedicated (2 CPU) machine (newark-music.allyn.com) which is at the latest stable (3.6.1) compiled with config = nosound. I did not notice any configs for multi-thread or buffer size when I looked at the Jamulus.pro file.
I hope this can help. I am willing to spend the extra for a dedicated 4 cpu for a short while if you thank that will help.
maallyn
on 4 Dec 2020
Folks:
I have a Linode dedicated (2 CPU) machine (newark-music.allyn.com) which is at the latest stable (3.6.1) compiled with config = nosound. I did not notice any configs for multi-thread or buffer size when I looked at the Jamulus.pro file.
hi there,
i couldn't fit more than 20 clients on your machine. are you running it with -F and -T parameters?
I have been playing around with sysbench, a tool for performance measurement and i found that cloud server performance is pretty good cpu-wise but awful for memory performance where my dedicated machine really shines. i ran this test on my home machine:
sysbench --threads=`nproc` memory run
sysbench 1.0.18 (using system LuaJIT 2.1.0-beta3)

Running the test with following options:
Number of threads: 8
Initializing random number generator from current time


Running memory speed test with the following options:
  block size: 1KiB
  total size: 102400MiB
  operation: write
  scope: global

Initializing worker threads...

Threads started!

Total operations: 104857600 (19856820.40 per second)

102400.00 MiB transferred (19391.43 MiB/sec)


General statistics:
    total time:                          5.2791s
    total number of events:              104857600

Latency (ms):
         min:                                    0.00
         avg:                                    0.00
         max:                                    1.84
         95th percentile:                        0.00
         sum:                                28463.16

Threads fairness:
    events (avg/stddev):           13107200.0000/0.00
    execution time (avg/stddev):   3.5579/0.08
and on my cloud server:
sysbench --threads=`nproc` memory run
sysbench 1.0.18 (using system LuaJIT 2.1.0-beta3)

Running the test with following options:
Number of threads: 4
Initializing random number generator from current time


Running memory speed test with the following options:
  block size: 1KiB
  total size: 102400MiB
  operation: write
  scope: global

Initializing worker threads...

Threads started!

Total operations: 21430802 (2142010.21 per second)

20928.52 MiB transferred (2091.81 MiB/sec)


General statistics:
    total time:                          10.0010s
    total number of events:              21430802

Latency (ms):
         min:                                    0.00
         avg:                                    0.00
         max:                                   10.76
         95th percentile:                        0.00
         sum:                                34558.68

Threads fairness:
    events (avg/stddev):           5357700.5000/266087.46
    execution time (avg/stddev):   8.6397/0.05
this doesn't look too good in comparison. maybe this is the bottleneck? do you think sysbench could be a reliable tool to measure server performance instead of trial and error or are there any other tools i could try?
dingodoppelt
on 6 Dec 2020
How much memory is used by a Jamulus server thread?
pljones
on 6 Dec 2020
On my windows system at home a server uses only about 60 MB memory.
It scales slightly with the number of attached clients. Example: 0 clients ==> 56 MB, 50 clients ==> 59 MB.
Edit: You probably were asking about a specific case above, so never mind my answer :)
brynalf
on 6 Dec 2020
Edit: You probably were asking about a specific case above, so never mind my answer :)
I meant Jamulus memory usage, as you've given.
The test was about memory throughput, if I read it correctly. If Jamulus isn't memory constrained, then the test shown won't be representative of Jamulus performance.
pljones
on 6 Dec 2020
The test was about memory throughput, if I read it correctly. If Jamulus isn't memory constrained, then the test shown won't be > representative of Jamulus performance.
I just wondered if that might be the issue with the cloud servers. The CPU performance is fine and doesn't really deviate from what I measure on real hardware. The only thing I could find using sysbench was the restricted performance on memory throughput in comparison to real hardware so I figured this might be another thing to look at since cloud servers die long before the CPU is used up.
dingodoppelt
on 7 Dec 2020
The CPU performance is fine and doesn't really deviate from what I measure on real hardware.
On average, that may be true. Are you getting a reading for consistency of performance - i.e. how much the CPU performance deviates between maximum throughput and minimum? As noted above, it's that stability that Jamulus needs and which directly affects its capacity.
pljones
on 7 Dec 2020
@dingodoppelt I don't know if you are on facebook, but there is a report about successfully have 53 clients connected to a Jamulus server on a 4 CPU virtual server: https://www.facebook.com/groups/619274602254947/permalink/811257479723324: "_Had 53 members of a youth orchestra this evening on Jamulus (and another 15-20 listening on Zoom). Took about 90 minutes of setup so we only got through a reading of Jingle Bells at the end but it was a great first step! AWS 4 vCPU server hit ~55%_."
corrados
on 7 Dec 2020
@corrados : my server does this, too. but not with every client on small network buffers. I've played on servers with around 50 people, but you can never tell if everybody has small network buffers enabled. in my tests i connected every client with the same buffersize and small network buffers enabled. It only worked for me on dedicated hardware (namely WorldJam, Jazzlounge servers)
dingodoppelt
on 7 Dec 2020
haven't done any testing / thorough research here yet, but just a heads up: there are also several kernel parameters for the UDP networking stack and general network parameters that could be tuned with sysctl that might have a positive effect:
(Is jamulus ever network-bound?)
https://www.kernel.org/doc/Documentation/networking/ip-sysctl.txt
 sbaier1
on 12 Dec 2020
sbaier1
on 12 Dec 2020
@sbaier1 I am out in the Internet frontier (aka far from the small distances at Europe) and see the network behavior being a dominant contributor to latency dependent performance. I'd be interested in a discussion about what can be done to quench traffic and discard packets. These mechanisms might be a good way to improve the performance (at the expense of audio interruption, which would be happening anyway). Especially with regards to a different thread on buffer backups (they called it buffer-bloat), the only way to manage problems in the network with packet backup at some routers would be creating some code to detect backups and quench traffic. I have some musicians that will "tolerate" 20-70 ms latency rather than not have music. Actively managing the packet rate up at 40+ ms would greatly improve the experience. (Note, I am thinking that some of the buffer back-ups is the interaction between our UDP traffic and other people's TCP cross traffic.)
gene96817
on 12 Dec 2020
Related issues
 mawess
·
14Comments
mawess
·
14Comments
 lefty665
·
14Comments
lefty665
·
14Comments
 keepers305
·
7Comments
keepers305
·
7Comments
 Brian-McBride
·
15Comments
corrados
·
5Comments
Brian-McBride
·
15Comments
corrados
·
5Comments
Most helpful comment
I have now applied some multithreading improvements from kraney (_Thank you!_) to the Git master. Today I did a test where I connected 99 dummy clients using stereo over my LAN (i.e. no internet) from my laptop to my Linux desktop PC (i5 with 4 CPU cores, no hyperthreading) and on that Linux desktop PC I run a normal Jamulus client so the total number was 100 clients. I had perfect audio quality on that normal client. Here is a screenshot of that session:
