Jaeger: collector.queue-size-memory option doesn't appear to account for all of the memory used by enqueued trace spans
Describe the bug
The documentation related to constraining the memory used by the queue is unclear.
We have attempted to use the collector.queue-size-memory option (on k8s so via the env variable COLLECTOR_QUEUE_SIZE_MEMORY) but our expectations based on the docs were different to how it actually works.
From a user perspective, this option feels like it should allow us to constrain the total memory used by the spans on the queue.
This would be very useful when looking to control the overall memory used by the collector, particularly when changes in the trace spans and their associated metadata/tags could cause unexpected growth in memory usage, ultimately resulting in processes being OOM killed.
To Reproduce
Steps to reproduce the behavior:
- Deploy the jaeger collector to k8s (or equivalent) with
- memory request = 200
- memory limit = 250
COLLECTOR_QUEUE_SIZE_MEMORY= 80
- Break connectivity with storage backend e.g. Elasticsearch in our case
- Queue fills up, memory grows to > 250MB, pod OOM killed by k8s
Expected behavior
We expected the traces/spans on the queue to be constrained to a memory size of 80MB.
With our configuration this would leave 120MB of memory free, allowing for queue resizing and other memory usage by the process.
Assuming my understanding of this is correct, either the docs should call out the fact that additional memory will be used by items on the queue.
Or if this is in fact a bug, then the calculations of queue size based on spans should also consider the additional memory footprint that doesn't currently appear to be accounted for.
Version (please complete the following information):
- OS: Linux (using the Jaeger Docker images)
- Jaeger version: 1.21.0
- Deployment: Kubernetes
What troubleshooting steps did you try?
Debugged using pprof, experimented with increased memory to eventually get to a point where the queue maxed out, spans were dropped and the process memory usage stabilised as expected.
For our setup, increasing the memory request to 1GB with the COLLECTOR_QUEUE_SIZE_MEMORY = 80MB, allows us to see that when the queue is full it consumes ~750MB RAM.
The following is the heap analysis from pprof for inuse_space with the above configuration. As can be observed, the zipkin.toDomain.getTags (amongst others) consumes much more than the 80MB we specified.

Additional context
Whilst debugging the problem I used pprof to analyse the inuse_space on the heap and observed that a large chunk of memory was being used by zipkin.toDomain.getTags.
This led me to believe that the 80MB is specifically related to the lower level memory used by the queue and its size but not the additional objects and memory usage associated with items on the queue.
 nickebbitt
All 6 comments
queue-size-memory is certainly not the total memory limit, that would be quite difficult to enforce. However, aside from some maps that store metrics (and hopefully those should be relatively small), the queue should be the only place where memory is actually held for data in the pipeline. Conversions like zipkin.toDomain allocate objects that will eventually be held in that queue, so it's not surprising that this path gets hot in the heap analysis. There's also some constant churn of short-lived objects that are gc-ed, they will require extra memory on the heap (and they are the ones that are very difficult to control).
 yurishkuro
on 5 Jan 2021
yurishkuro
on 5 Jan 2021
Hey, understood re: total memory limit although, as a user, this means that using a number such as 80MB to constrain the queue doesn't feel like it makes much sense.
Here are a couple of graphs that show how memory is affected with a full queue based on 80MB and 1Gb memory request, the queue being full results in ~75% of the available memory being consumed, and the memory consistently stays at that level until the queue drains.
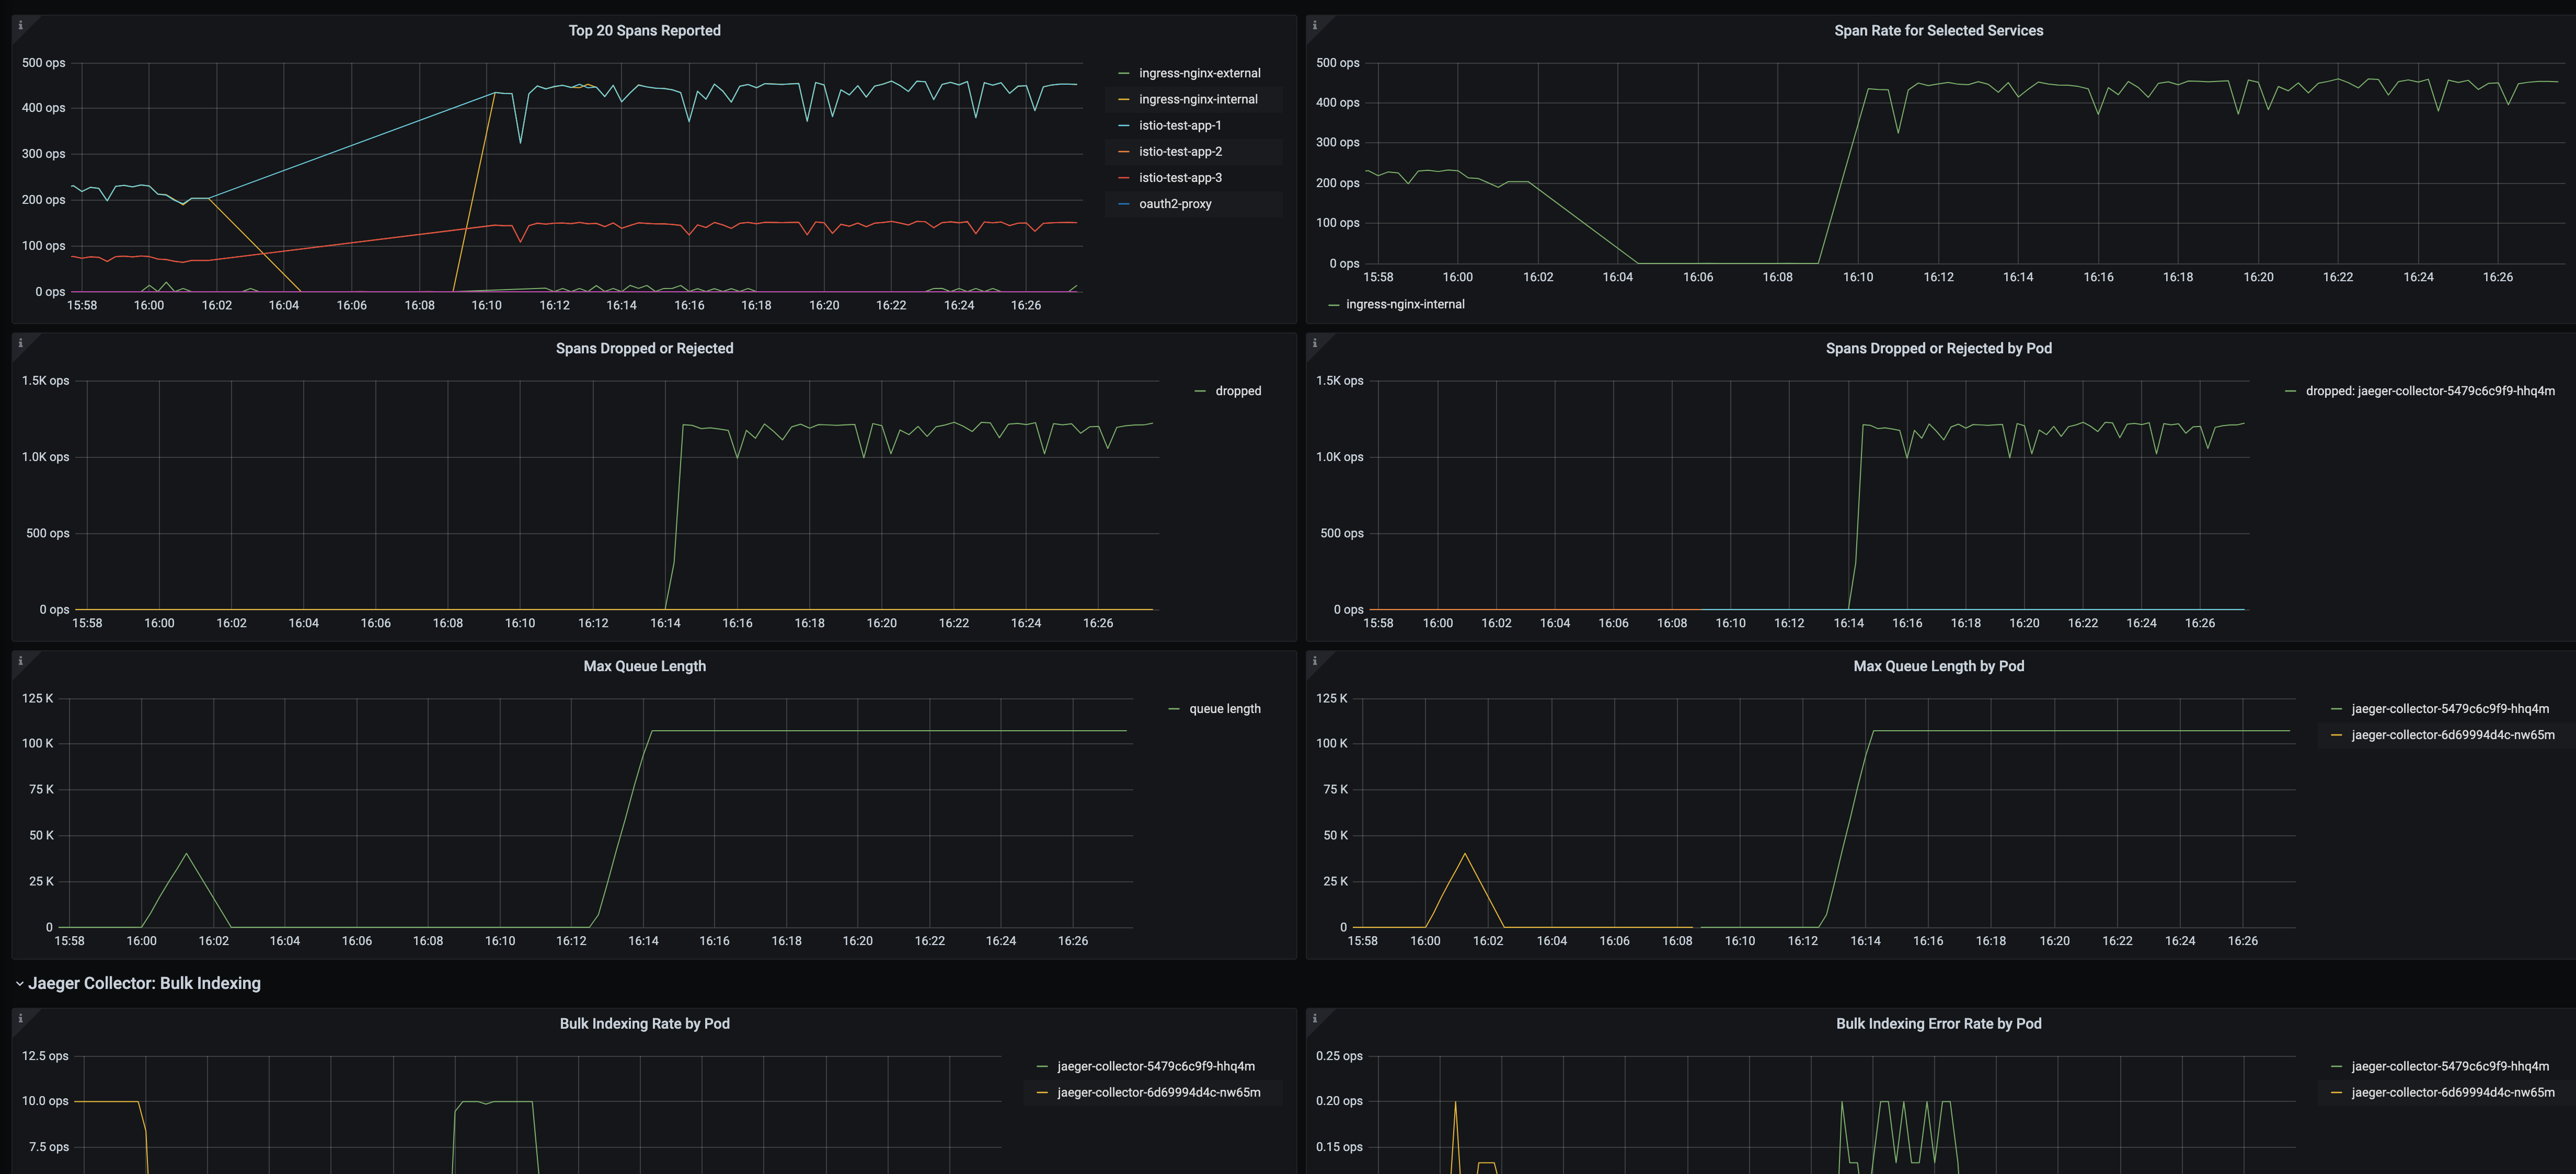

When the queue is being managed effectively (i.e. no backlog) then memory consumption sits around 18MB for the whole process.
The fact that the queue being full results in ~750MB of additional memory usage instead of 80MB is confusing.
Maybe it's just a misunderstanding of the purpose of that configuration item and something that could be clarified in the docs?
nickebbitt
on 5 Jan 2021
I've always been suspicious about trying to limit actual mem size of the queue :-) Sounds like the calculations used are not accurate. In fact, we might be using the Size() function provided by Proto classes, which likely only refers to on-the-wire size, not in-memory size; the latter can be larger due to alignments, etc.
yurishkuro
on 5 Jan 2021
cc @jpkrohling
yurishkuro
on 5 Jan 2021
I can take a look at this one, but before moving forward, do you have a positive confirmation that this setting is indeed taking place? There should be both an entry in the logs and a Gauge in the metrics endpoint.
 jpkrohling
on 12 Jan 2021
jpkrohling
on 12 Jan 2021
Here's an example log message, we are now configuring the queue at 15MB
{"level":"info","ts":1609847386.5267882,"caller":"app/span_processor.go:119","msg":"Dynamically adjusting the queue size at runtime.","memory-mib":15,"queue-size-warmup":2000}
And I can see the following metric, if that's the one you're referring to
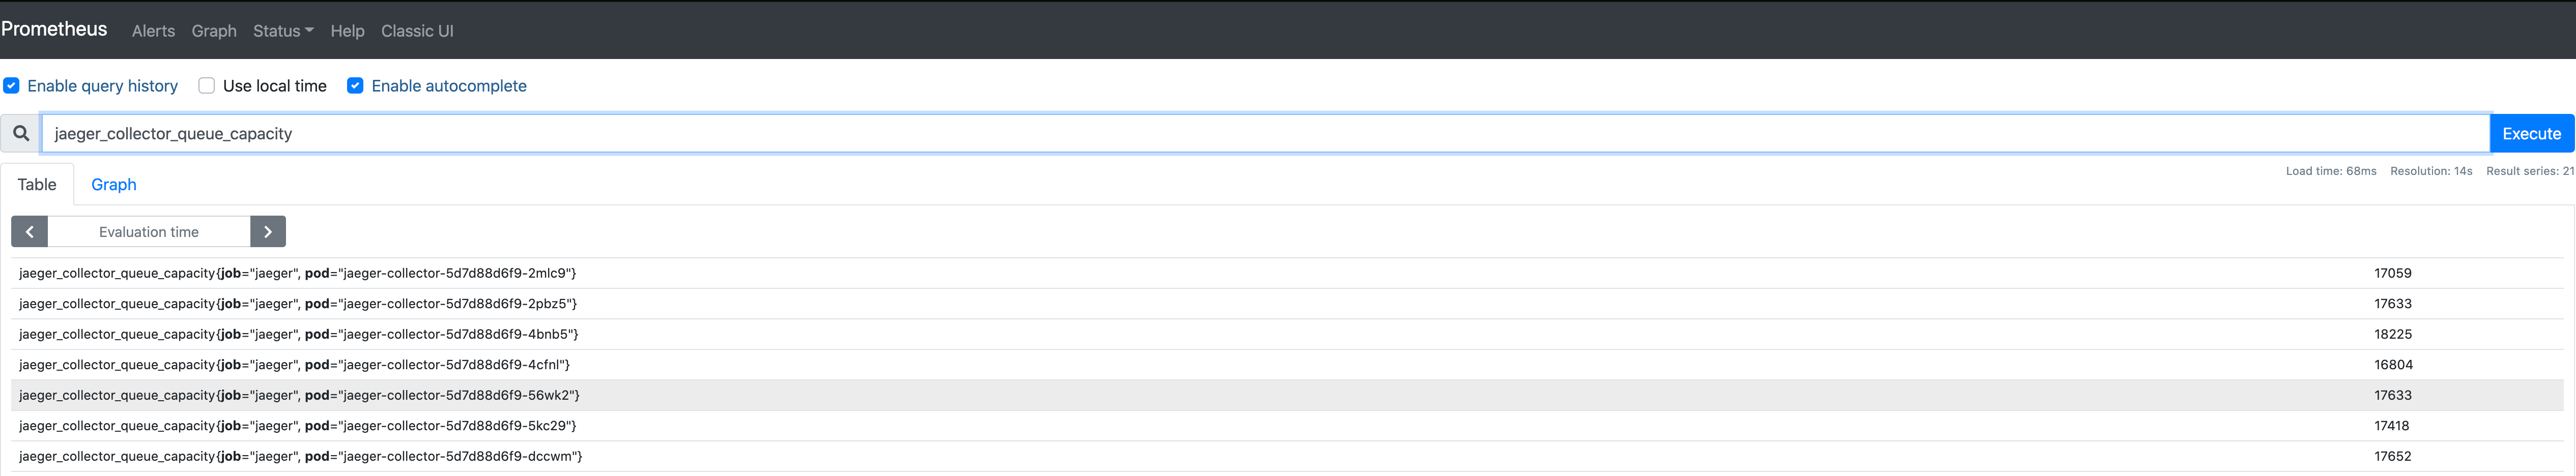
nickebbitt
on 12 Jan 2021
Related issues
 trondhindenes
·
4Comments
trondhindenes
·
4Comments
 benraskin92
·
3Comments
yurishkuro
·
4Comments
benraskin92
·
3Comments
yurishkuro
·
4Comments
 jvans1
·
3Comments
jvans1
·
3Comments
 elgalu
·
3Comments
elgalu
·
3Comments
Most helpful comment
I've always been suspicious about trying to limit actual mem size of the queue :-) Sounds like the calculations used are not accurate. In fact, we might be using the Size() function provided by Proto classes, which likely only refers to on-the-wire size, not in-memory size; the latter can be larger due to alignments, etc.